Estatísticas Básicas
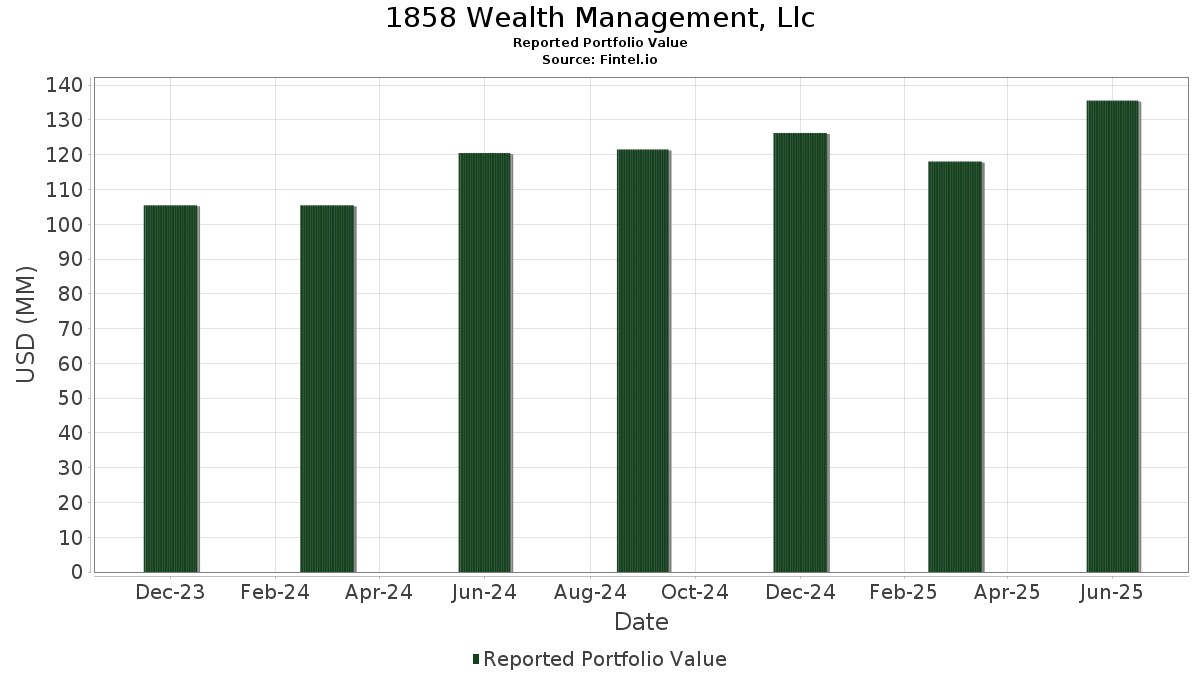
| Valor do Portfólio | $ 142,425,869 |
| Posições Atuais | 113 |
Últimas Participações, Desempenho, AUM (de 13F, 13D)
1858 Wealth Management, Llc divulgou 113 participações totais em seus últimos arquivamentos da SEC. O valor mais recente da carteira é calculado como $ 142,425,869 USD. O Ativo Total Sob Gestão (AUM) é esse valor mais o caixa (que não é divulgado). As principais posições de 1858 Wealth Management, Llc são Microsoft Corporation (US:MSFT) , Direxion Shares ETF Trust - Direxion Daily NVDA Bear 1X Shares (US:NVDD) , Apple Inc. (US:AAPL) , iShares Trust - iShares 7-10 Year Treasury Bond ETF (US:IEF) , and Meta Platforms, Inc. (US:META) . As novas posições de 1858 Wealth Management, Llc incluem iShares Trust - iShares 7-10 Year Treasury Bond ETF (US:IEF) , Tidal Trust III - Fundstrat Granny Shots US Large Cap ETF (US:GRNY) , iShares Trust - iShares 1-3 Year Treasury Bond ETF (US:SHY) , Tidal ETF Trust - Dana Unconstrained Equity ETF (US:DUNK) , and CRH plc (US:CRH) .
Maiores Aumentos Este Trimestre
Usamos a mudança na alocação do portfólio porque esta é a métrica mais significativa. As mudanças podem ser devido a operações ou mudanças nos preços das ações.
| Ativo | Ações (MM) |
Valor (MM$) |
% do Portfólio | Δ% do Portfólio |
|---|---|---|---|---|
| 0.06 | 5.50 | 3.8607 | 3.8607 | |
| 0.15 | 3.87 | 2.7172 | 2.7172 | |
| 0.04 | 3.47 | 2.4397 | 2.4397 | |
| 0.13 | 3.28 | 2.3039 | 2.3039 | |
| 0.04 | 7.32 | 5.1412 | 0.5964 | |
| 0.03 | 7.22 | 5.0663 | 0.5841 | |
| 0.01 | 3.08 | 2.1647 | 0.5218 | |
| 0.03 | 1.83 | 1.2870 | 0.4896 | |
| 0.02 | 2.73 | 1.9151 | 0.4227 | |
| 0.01 | 1.93 | 1.3544 | 0.3551 |
Maiores Diminuições Este Trimestre
Usamos a mudança na alocação do portfólio porque esta é a métrica mais significativa. As mudanças podem ser devido a operações ou mudanças nos preços das ações.
| Ativo | Ações (MM) |
Valor (MM$) |
% do Portfólio | Δ% do Portfólio |
|---|---|---|---|---|
| 0.00 | 0.00 | -0.6819 | ||
| 0.01 | 4.41 | 3.0990 | -0.6237 | |
| 0.01 | 5.07 | 3.5624 | -0.4783 | |
| 0.00 | 0.00 | -0.4311 | ||
| 0.00 | 2.46 | 1.7300 | -0.4209 | |
| 0.02 | 3.99 | 2.8019 | -0.2937 | |
| 0.00 | 1.96 | 1.3755 | -0.2662 | |
| 0.00 | 0.00 | -0.2492 | ||
| 0.02 | 4.94 | 3.4716 | -0.2488 | |
| 0.02 | 3.14 | 2.2075 | -0.2403 |
Arquivamentos 13F e Fundo
Este formulário foi arquivado em 2025-11-14 para o período de relatório 2025-09-30. Clique no ícone de link para ver o histórico completo da transação.
Atualize para desbloquear dados premium e exportar para Excel ![]() .
.
| Ativo | Tipo | Preço Médio por Ação | Ações (MM) |
ΔAções (%) |
Valor ($MM) |
ΔAções (%) |
Portfólio (%) |
ΔPortfólio (%) |
|
|---|---|---|---|---|---|---|---|---|---|
| MSFT / Microsoft Corporation | 0.02 | 0.55 | 8.66 | 4.70 | 6.0804 | -0.0206 | |||
| NVDD / Direxion Shares ETF Trust - Direxion Daily NVDA Bear 1X Shares | 0.04 | 0.63 | 7.32 | 18.84 | 5.1412 | 0.5964 | |||
| AAPL / Apple Inc. | 0.03 | -4.32 | 7.22 | 18.75 | 5.0663 | 0.5841 | |||
| IEF / iShares Trust - iShares 7-10 Year Treasury Bond ETF | 0.06 | 5.50 | 3.8607 | 3.8607 | |||||
| META / Meta Platforms, Inc. | 0.01 | -6.91 | 5.07 | -7.39 | 3.5624 | -0.4783 | |||
| CME / CME Group Inc. | 0.02 | 0.00 | 4.94 | -1.96 | 3.4716 | -0.2488 | |||
| GEV / GE Vernova Inc. | 0.01 | -24.74 | 4.41 | -12.56 | 3.0990 | -0.6237 | |||
| AMZN / Amazon.com, Inc. | 0.02 | -4.99 | 3.99 | -4.91 | 2.8019 | -0.2937 | |||
| AME / AMETEK, Inc. | 0.02 | -4.14 | 3.98 | -0.40 | 2.7945 | -0.1534 | |||
| GRNY / Tidal Trust III - Fundstrat Granny Shots US Large Cap ETF | 0.15 | 3.87 | 2.7172 | 2.7172 | |||||
| VRT / Vertiv Holdings Co | 0.02 | -13.49 | 3.49 | 1.63 | 2.4494 | -0.0824 | |||
| SHY / iShares Trust - iShares 1-3 Year Treasury Bond ETF | 0.04 | 3.47 | 2.4397 | 2.4397 | |||||
| DUNK / Tidal ETF Trust - Dana Unconstrained Equity ETF | 0.13 | 3.28 | 2.3039 | 2.3039 | |||||
| PANW / Palo Alto Networks, Inc. | 0.02 | -4.79 | 3.14 | -5.24 | 2.2075 | -0.2403 | |||
| GOOGL / Alphabet Inc. | 0.01 | 0.82 | 3.08 | 38.44 | 2.1647 | 0.5218 | |||
| UBER / Uber Technologies, Inc. | 0.03 | -4.93 | 2.91 | -0.17 | 2.0434 | -0.1069 | |||
| GRID / First Trust NASDAQ Clean Edge Smart Grid Infrastructure Index Fund | 0.02 | 24.05 | 2.73 | 34.80 | 1.9151 | 0.4227 | |||
| ANET / Arista Networks, Inc. | 0.02 | -21.41 | 2.56 | 11.91 | 1.7951 | 0.1102 | |||
| NOW / ServiceNow, Inc. | 0.00 | 23.92 | 2.49 | 10.95 | 1.7504 | 0.0927 | |||
| CSCO / Cisco Systems, Inc. | 0.04 | 3.94 | 2.48 | 2.52 | 1.7414 | -0.0434 | |||
| BRK.A / Berkshire Hathaway Inc. | 0.00 | -18.36 | 2.46 | -15.53 | 1.7300 | -0.4209 | |||
| GCOW / Pacer Funds Trust - Pacer Global Cash Cows Dividend ETF | 0.06 | 0.00 | 2.38 | 4.35 | 1.6691 | -0.0113 | |||
| GE / General Electric Company | 0.01 | -22.48 | 2.13 | -9.41 | 1.4937 | -0.2383 | |||
| NFLX / Netflix, Inc. | 0.00 | -1.68 | 1.96 | -11.96 | 1.3755 | -0.2662 | |||
| AVGO / Broadcom Inc. | 0.01 | 18.96 | 1.93 | 42.39 | 1.3544 | 0.3551 | |||
| FXO / First Trust Exchange-Traded AlphaDEX Fund - First Trust Financials AlphaDEX Fund | 0.03 | 60.05 | 1.83 | 69.47 | 1.2870 | 0.4896 | |||
| NU / Nu Holdings Ltd. | 0.11 | -5.18 | 1.82 | 10.63 | 1.2797 | 0.0647 | |||
| CAT / Caterpillar Inc. | 0.00 | -6.52 | 1.67 | 14.88 | 1.1716 | 0.1003 | |||
| ADP / Automatic Data Processing, Inc. | 0.01 | -5.31 | 1.57 | -9.87 | 1.1027 | -0.1828 | |||
| PLTR / Palantir Technologies Inc. | 0.01 | -14.31 | 1.53 | 14.71 | 1.0729 | 0.0899 | |||
| BA / The Boeing Company | 0.01 | 8.28 | 1.48 | 11.56 | 1.0364 | 0.0602 | |||
| VRTX / Vertex Pharmaceuticals Incorporated | 0.00 | 43.81 | 1.39 | 26.55 | 0.9740 | 0.1652 | |||
| ADBE / Adobe Inc. | 0.00 | 30.20 | 1.28 | 18.72 | 0.8958 | 0.1031 | |||
| LDOS / Leidos Holdings, Inc. | 0.01 | -7.86 | 1.27 | 10.32 | 0.8937 | 0.0429 | |||
| RTX / RTX Corporation | 0.01 | -7.44 | 1.24 | 6.06 | 0.8732 | 0.0084 | |||
| GD / General Dynamics Corporation | 0.00 | 7.03 | 1.19 | 25.18 | 0.8344 | 0.1339 | |||
| LLY / Eli Lilly and Company | 0.00 | 8.45 | 1.16 | 6.06 | 0.8116 | 0.0084 | |||
| V / Visa Inc. | 0.00 | -7.59 | 1.14 | -11.16 | 0.7994 | -0.1458 | |||
| COWZ / Pacer Funds Trust - Pacer US Cash Cows 100 ETF | 0.02 | 0.00 | 1.06 | 4.32 | 0.7465 | -0.0054 | |||
| JPM / JPMorgan Chase & Co. | 0.00 | -9.13 | 0.94 | -1.16 | 0.6571 | -0.0411 | |||
| GOOGL / Alphabet Inc. | 0.00 | -9.21 | 0.82 | 25.23 | 0.5757 | 0.0928 | |||
| AMD / Advanced Micro Devices, Inc. | 0.00 | 33.33 | 0.79 | 52.12 | 0.5539 | 0.1711 | |||
| ABT / Abbott Laboratories | 0.01 | -10.77 | 0.77 | -12.13 | 0.5393 | -0.1054 | |||
| SNOW / Snowflake Inc. | 0.00 | 29.02 | 0.76 | 30.17 | 0.5302 | 0.1019 | |||
| ETN / Eaton Corporation plc | 0.00 | 10.73 | 0.75 | 16.05 | 0.5287 | 0.0502 | |||
| ABBV / AbbVie Inc. | 0.00 | -5.73 | 0.74 | 17.59 | 0.5214 | 0.0556 | |||
| LRCX / Lam Research Corporation | 0.01 | -1.48 | 0.68 | 35.40 | 0.4758 | 0.1070 | |||
| DELL / Dell Technologies Inc. | 0.00 | 0.00 | 0.65 | 15.51 | 0.4556 | 0.0417 | |||
| CDNS / Cadence Design Systems, Inc. | 0.00 | 4.01 | 0.63 | 18.71 | 0.4410 | 0.0503 | |||
| AXP / American Express Company | 0.00 | -3.18 | 0.55 | 0.92 | 0.3836 | -0.0161 | |||
| HD / The Home Depot, Inc. | 0.00 | -16.41 | 0.53 | -7.67 | 0.3724 | -0.0511 | |||
| QTUM / ETF Series Solutions - Defiance Quantum ETF | 0.01 | 43.43 | 0.53 | 63.86 | 0.3698 | 0.1327 | |||
| DIS / The Walt Disney Company | 0.00 | 1.01 | 0.51 | -6.83 | 0.3552 | -0.0449 | |||
| FITB / Fifth Third Bancorp | 0.01 | 0.00 | 0.50 | 8.24 | 0.3507 | 0.0106 | |||
| MRK / Merck & Co., Inc. | 0.01 | -15.82 | 0.48 | -10.72 | 0.3394 | -0.0601 | |||
| CGBD / Carlyle Secured Lending, Inc. | 0.04 | -7.26 | 0.48 | -15.22 | 0.3365 | -0.0807 | |||
| NEE / NextEra Energy, Inc. | 0.01 | -1.45 | 0.47 | 7.06 | 0.3306 | 0.0065 | |||
| BSX / Boston Scientific Corporation | 0.00 | -18.68 | 0.47 | -26.15 | 0.3279 | -0.1381 | |||
| ORCL / Oracle Corporation | 0.00 | 0.13 | 0.43 | 29.13 | 0.3019 | 0.0557 | |||
| BK / The Bank of New York Mellon Corporation | 0.00 | -3.64 | 0.42 | 15.34 | 0.2958 | 0.0261 | |||
| TJX / The TJX Companies, Inc. | 0.00 | 37.41 | 0.40 | 60.64 | 0.2814 | 0.0976 | |||
| DASH / DoorDash, Inc. | 0.00 | -27.12 | 0.40 | -19.68 | 0.2813 | -0.0862 | |||
| KO / The Coca-Cola Company | 0.01 | -18.43 | 0.39 | -23.62 | 0.2728 | -0.1020 | |||
| TPR / Tapestry, Inc. | 0.00 | -12.07 | 0.38 | 13.39 | 0.2681 | 0.0197 | |||
| PHM / PulteGroup, Inc. | 0.00 | -5.29 | 0.36 | 18.73 | 0.2493 | 0.0286 | |||
| CRWD / CrowdStrike Holdings, Inc. | 0.00 | 21.18 | 0.35 | 16.50 | 0.2482 | 0.0247 | |||
| ZTS / Zoetis Inc. | 0.00 | 13.61 | 0.35 | 6.73 | 0.2452 | 0.0035 | |||
| TMUS / T-Mobile US, Inc. | 0.00 | -38.87 | 0.34 | -38.53 | 0.2408 | -0.1711 | |||
| CRH / CRH plc | 0.00 | 0.33 | 0.2347 | 0.2347 | |||||
| DIVO / Amplify ETF Trust - Amplify CWP Enhanced Dividend Income ETF | 0.01 | 0.00 | 0.32 | 4.56 | 0.2259 | -0.0007 | |||
| BAC / Bank of America Corporation | 0.01 | -6.91 | 0.31 | 1.32 | 0.2167 | -0.0076 | |||
| GJR / Strats Trust For Procter & Gambel Security - Preferred Security | 0.00 | -22.77 | 0.31 | -25.73 | 0.2155 | -0.0885 | |||
| PKW / Invesco Exchange-Traded Fund Trust - Invesco BuyBack Achievers ETF | 0.00 | 0.00 | 0.30 | 7.42 | 0.2135 | 0.0042 | |||
| ALL / The Allstate Corporation | 0.00 | 0.30 | 0.2133 | 0.2133 | |||||
| MCK / McKesson Corporation | 0.00 | 0.30 | 0.2105 | 0.2105 | |||||
| PAVE / Global X Funds - Global X U.S. Infrastructure Development ETF | 0.01 | 0.00 | 0.30 | 9.16 | 0.2097 | 0.0081 | |||
| TXN / Texas Instruments Incorporated | 0.00 | 0.00 | 0.29 | -11.28 | 0.2043 | -0.0382 | |||
| FE / FirstEnergy Corp. | 0.01 | 0.00 | 0.29 | 13.73 | 0.2043 | 0.0157 | |||
| BR / Broadridge Financial Solutions, Inc. | 0.00 | -26.67 | 0.28 | -28.06 | 0.1982 | -0.0915 | |||
| BLK / BlackRock, Inc. | 0.00 | 0.00 | 0.28 | 11.46 | 0.1981 | 0.0108 | |||
| BMY / Bristol-Myers Squibb Company | 0.01 | 0.00 | 0.28 | -2.45 | 0.1963 | -0.0154 | |||
| IQV / IQVIA Holdings Inc. | 0.00 | 0.28 | 0.1951 | 0.1951 | |||||
| GIS / General Mills, Inc. | 0.01 | 1.06 | 0.28 | -1.77 | 0.1950 | -0.0133 | |||
| MCD / McDonald's Corporation | 0.00 | -0.98 | 0.28 | 2.99 | 0.1944 | -0.0039 | |||
| TOST / Toast, Inc. | 0.01 | 0.00 | 0.27 | -17.48 | 0.1892 | -0.0519 | |||
| T / AT&T Inc. | 0.01 | 0.26 | 0.1860 | 0.1860 | |||||
| QCOM / QUALCOMM Incorporated | 0.00 | -25.85 | 0.26 | -22.65 | 0.1853 | -0.0660 | |||
| AFL / Aflac Incorporated | 0.00 | -5.34 | 0.26 | 0.38 | 0.1834 | -0.0088 | |||
| ALV / Autoliv, Inc. | 0.00 | 3.52 | 0.25 | 14.41 | 0.1787 | 0.0144 | |||
| GPC / Genuine Parts Company | 0.00 | 0.25 | 0.1780 | 0.1780 | |||||
| JCI / Johnson Controls International plc | 0.00 | -14.96 | 0.25 | -11.66 | 0.1759 | -0.0329 | |||
| SYY / Sysco Corporation | 0.00 | -6.41 | 0.25 | 2.04 | 0.1756 | -0.0057 | |||
| EMR / Emerson Electric Co. | 0.00 | 0.00 | 0.25 | -1.58 | 0.1752 | -0.0119 | |||
| SPGI / S&P Global Inc. | 0.00 | -1.59 | 0.24 | -9.06 | 0.1695 | -0.0265 | |||
| SPHB / Invesco Exchange-Traded Fund Trust II - Invesco S&P 500 High Beta ETF | 0.00 | 0.00 | 0.24 | 12.74 | 0.1681 | 0.0112 | |||
| KR / The Kroger Co. | 0.00 | -2.61 | 0.24 | -8.46 | 0.1675 | -0.0248 | |||
| WCN / Waste Connections, Inc. | 0.00 | 0.00 | 0.24 | -5.95 | 0.1668 | -0.0193 | |||
| HWM / Howmet Aerospace Inc. | 0.00 | -20.45 | 0.24 | -16.31 | 0.1662 | -0.0420 | |||
| JNJ / Johnson & Johnson | 0.00 | -5.42 | 0.24 | 15.12 | 0.1659 | 0.0141 | |||
| BX / Blackstone Inc. | 0.00 | 0.00 | 0.23 | 14.22 | 0.1637 | 0.0131 | |||
| SYK / Stryker Corporation | 0.00 | 7.61 | 0.23 | 0.44 | 0.1614 | -0.0072 | |||
| WDAY / Workday, Inc. | 0.00 | -1.26 | 0.23 | -0.88 | 0.1589 | -0.0096 | |||
| FANG / Diamondback Energy, Inc. | 0.00 | 2.08 | 0.22 | 6.37 | 0.1526 | 0.0018 | |||
| LNG / Cheniere Energy, Inc. | 0.00 | 0.22 | 0.1521 | 0.1521 | |||||
| KMB / Kimberly-Clark Corporation | 0.00 | -1.25 | 0.22 | -4.87 | 0.1516 | -0.0156 | |||
| TMO / Thermo Fisher Scientific Inc. | 0.00 | -20.94 | 0.21 | -5.36 | 0.1492 | -0.0165 | |||
| SCI / Service Corporation International | 0.00 | 0.00 | 0.21 | 2.43 | 0.1484 | -0.0041 | |||
| ACN / Accenture plc | 0.00 | 0.21 | 0.1468 | 0.1468 | |||||
| SLB / SLB N.V. | 0.01 | 0.21 | 0.1468 | 0.1468 | |||||
| CP / Canadian Pacific Kansas City Limited | 0.00 | 0.00 | 0.21 | -6.33 | 0.1459 | -0.0172 | |||
| FERG / Ferguson Enterprises Inc. | 0.00 | 0.21 | 0.1444 | 0.1444 | |||||
| AMAT / Applied Materials, Inc. | 0.00 | 0.20 | 0.1438 | 0.1438 | |||||
| MGNI / Magnite, Inc. | 0.01 | -34.53 | 0.20 | -41.00 | 0.1409 | -0.1094 | |||
| SGOV / iShares Trust - iShares 0-3 Month Treasury Bond ETF | 0.00 | -100.00 | 0.00 | 0.0000 | |||||
| FTNT / Fortinet, Inc. | 0.00 | -100.00 | 0.00 | 0.0000 | |||||
| EOG / EOG Resources, Inc. | 0.00 | -100.00 | 0.00 | -100.00 | -0.2492 | ||||
| LIN / Linde plc | 0.00 | -100.00 | 0.00 | 0.0000 | |||||
| SHV / iShares Trust - iShares 0-1 Year Treasury Bond ETF | 0.00 | -100.00 | 0.00 | 0.0000 | |||||
| SNPS / Synopsys, Inc. | 0.00 | -100.00 | 0.00 | -100.00 | -0.4311 | ||||
| XOM / Exxon Mobil Corporation | 0.00 | -100.00 | 0.00 | 0.0000 | |||||
| AMT / American Tower Corporation | 0.00 | -100.00 | 0.00 | 0.0000 | |||||
| WFRD / Weatherford International plc | 0.00 | -100.00 | 0.00 | 0.0000 | |||||
| GWW / W.W. Grainger, Inc. | 0.00 | -100.00 | 0.00 | 0.0000 | |||||
| IVRA / Invesco Actively Managed Exchange-Traded Fund Trust - Invesco Real Assets ESG ETF | 0.00 | -100.00 | 0.00 | 0.0000 | |||||
| CLH / Clean Harbors, Inc. | 0.00 | -100.00 | 0.00 | 0.0000 | |||||
| FI / Fiserv, Inc. | 0.00 | -100.00 | 0.00 | 0.0000 | |||||
| CARR / Carrier Global Corporation | 0.00 | -100.00 | 0.00 | 0.0000 | |||||
| ISRG / Intuitive Surgical, Inc. | 0.00 | -100.00 | 0.00 | 0.0000 | |||||
| VRSK / Verisk Analytics, Inc. | 0.00 | -100.00 | 0.00 | 0.0000 | |||||
| KIE / SPDR Series Trust - State Street SPDR S&P Insurance ETF | 0.00 | -100.00 | 0.00 | -100.00 | -0.6819 | ||||
| RGA / Reinsurance Group of America, Incorporated | 0.00 | -100.00 | 0.00 | -100.00 | -0.2155 | ||||
| USFR / WisdomTree Trust - WisdomTree Floating Rate Treasury Fund | 0.00 | -100.00 | 0.00 | 0.0000 |