Estatísticas Básicas
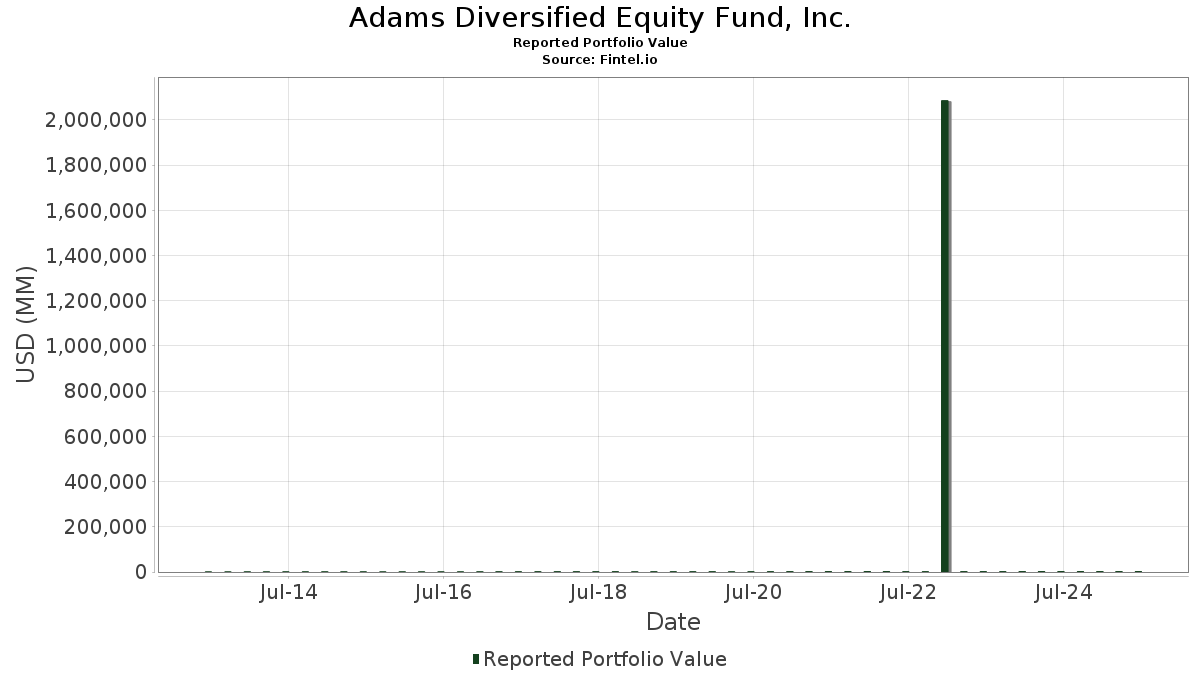
| Valor do Portfólio | $ 2,968,437,924 |
| Posições Atuais | 93 |
Últimas Participações, Desempenho, AUM (de 13F, 13D)
Adams Diversified Equity Fund, Inc. divulgou 93 participações totais em seus últimos arquivamentos da SEC. O valor mais recente da carteira é calculado como $ 2,968,437,924 USD. O Ativo Total Sob Gestão (AUM) é esse valor mais o caixa (que não é divulgado). As principais posições de Adams Diversified Equity Fund, Inc. são NVIDIA Corporation (US:NVDA) , Microsoft Corporation (US:MSFT) , Apple Inc. (US:AAPL) , Alphabet Inc. (US:GOOGL) , and Amazon.com, Inc. (US:AMZN) . As novas posições de Adams Diversified Equity Fund, Inc. incluem Johnson Controls International plc (US:JCI) , Snowflake Inc. (US:SNOW) , Axon Enterprise, Inc. (US:AXON) , PulteGroup, Inc. (US:PHM) , and The Select Sector SPDR Trust - State Street Materials Select Sector SPDR ETF (US:XLB) .
Maiores Aumentos Este Trimestre
Usamos a mudança na alocação do portfólio porque esta é a métrica mais significativa. As mudanças podem ser devido a operações ou mudanças nos preços das ações.
| Ativo | Ações (MM) |
Valor (MM$) |
% do Portfólio | Δ% do Portfólio |
|---|---|---|---|---|
| 1.31 | 245.32 | 8.2641 | 8.1893 | |
| 0.42 | 219.77 | 7.4034 | 7.3264 | |
| 0.82 | 209.54 | 7.0588 | 6.9980 | |
| 0.53 | 129.57 | 4.3650 | 4.3310 | |
| 0.52 | 114.77 | 3.8663 | 3.8254 | |
| 0.12 | 90.70 | 3.0553 | 3.0223 | |
| 0.27 | 87.49 | 2.9474 | 2.9212 | |
| 0.20 | 64.30 | 2.1663 | 2.1417 | |
| 0.12 | 54.17 | 1.8248 | 1.8110 | |
| 2.52 | 54.14 | 1.8240 | 1.8053 |
Maiores Diminuições Este Trimestre
Usamos a mudança na alocação do portfólio porque esta é a métrica mais significativa. As mudanças podem ser devido a operações ou mudanças nos preços das ações.
| Ativo | Ações (MM) |
Valor (MM$) |
% do Portfólio | Δ% do Portfólio |
|---|---|---|---|---|
| 0.00 | 0.00 | -0.0083 | ||
| 0.00 | 0.00 | -0.0072 | ||
| 0.00 | 0.00 | -0.0058 | ||
| 0.00 | 0.00 | -0.0047 | ||
| 0.00 | 0.00 | -0.0041 | ||
| 0.00 | 0.00 | -0.0024 |
Arquivamentos 13F e Fundo
Este formulário foi arquivado em 2025-10-22 para o período de relatório 2025-09-30. Clique no ícone de link para ver o histórico completo da transação.
Atualize para desbloquear dados premium e exportar para Excel ![]() .
.
| Ativo | Tipo | Preço Médio por Ação | Ações (MM) |
ΔAções (%) |
Valor ($MM) |
ΔAções (%) |
Portfólio (%) |
ΔPortfólio (%) |
|
|---|---|---|---|---|---|---|---|---|---|
| NVDA / NVIDIA Corporation | 1.31 | -0.99 | 245.32 | 16.92 | 8.2641 | 8.1893 | |||
| MSFT / Microsoft Corporation | 0.42 | -2.33 | 219.77 | 1.71 | 7.4034 | 7.3264 | |||
| AAPL / Apple Inc. | 0.82 | -0.97 | 209.54 | 22.90 | 7.0588 | 6.9980 | |||
| GOOGL / Alphabet Inc. | 0.53 | -1.39 | 129.57 | 36.03 | 4.3650 | 4.3310 | |||
| AMZN / Amazon.com, Inc. | 0.52 | 0.00 | 114.77 | 0.08 | 3.8663 | 3.8254 | |||
| META / Meta Platforms, Inc. | 0.12 | -1.59 | 90.70 | -2.09 | 3.0553 | 3.0223 | |||
| AVGO / Broadcom Inc. | 0.27 | -0.75 | 87.49 | 18.79 | 2.9474 | 2.9212 | |||
| JPM / JPMorgan Chase & Co. | 0.20 | -14.37 | 64.30 | -6.83 | 2.1663 | 2.1417 | |||
| TSLA / Tesla, Inc. | 0.12 | 0.00 | 54.17 | 40.00 | 1.8248 | 1.8110 | |||
| PEO / Adams Natural Resources Fund, Inc. | 2.52 | 2.44 | 54.14 | 3.16 | 1.8240 | 1.8053 | |||
| BAC / Bank of America Corporation | 0.92 | -1.29 | 47.40 | 7.62 | 1.5969 | 1.5812 | |||
| BRK.B / Berkshire Hathaway Inc. | 0.09 | -2.51 | 46.78 | 0.89 | 1.5758 | 1.5593 | |||
| GE / General Electric Company | 0.15 | -6.53 | 45.18 | 9.24 | 1.5221 | 1.5074 | |||
| ABBV / AbbVie Inc. | 0.19 | 0.00 | 43.46 | 24.74 | 1.4641 | 1.4517 | |||
| NFLX / Netflix, Inc. | 0.03 | 0.00 | 41.75 | -10.47 | 1.4064 | 1.3898 | |||
| V / Visa Inc. | 0.12 | 0.00 | 39.89 | -3.85 | 1.3439 | 1.3291 | |||
| LRCX / Lam Research Corporation | 0.28 | -2.08 | 37.22 | 34.70 | 1.2540 | 1.2441 | |||
| WMT / Walmart Inc. | 0.35 | 0.00 | 36.41 | 5.40 | 1.2264 | 1.2141 | |||
| PM / Philip Morris International Inc. | 0.21 | 14.12 | 34.86 | 1.64 | 1.1744 | 1.1622 | |||
| UBER / Uber Technologies, Inc. | 0.35 | 13.06 | 34.26 | 18.72 | 1.1541 | 1.1439 | |||
| COF / Capital One Financial Corporation | 0.16 | 0.00 | 33.52 | -0.08 | 1.1291 | 1.1172 | |||
| GS / The Goldman Sachs Group, Inc. | 0.04 | -15.66 | 33.45 | -5.10 | 1.1267 | 1.1142 | |||
| MAST / Mastercard Incorporated | 0.06 | 4.35 | 32.74 | 5.63 | 1.1030 | 1.0919 | |||
| HD / The Home Depot, Inc. | 0.08 | 112.93 | 32.70 | 135.32 | 1.1016 | 1.0966 | |||
| LLY / Eli Lilly and Company | 0.04 | 0.00 | 32.02 | -2.12 | 1.0787 | 1.0671 | |||
| ANET / Arista Networks, Inc. | 0.21 | -2.34 | 30.40 | 39.09 | 1.0243 | 1.0165 | |||
| BKNG / Booking Holdings Inc. | 0.01 | 0.00 | 30.24 | -6.74 | 1.0186 | 1.0070 | |||
| BA / The Boeing Company | 0.14 | 12.19 | 29.20 | 15.56 | 0.9837 | 0.9747 | |||
| CVX / Chevron Corporation | 0.18 | 33.58 | 27.69 | 44.87 | 0.9329 | 0.9261 | |||
| MRK / Merck & Co., Inc. | 0.31 | 25.92 | 0.8731 | 0.8731 | |||||
| CSCO / Cisco Systems, Inc. | 0.37 | 0.00 | 25.64 | -1.38 | 0.8639 | 0.8546 | |||
| GEV / GE Vernova Inc. | 0.04 | -9.96 | 25.03 | 4.64 | 0.8431 | 0.8346 | |||
| IBM / International Business Machines Corporation | 0.09 | -32.23 | 24.80 | -35.13 | 0.8355 | 0.8219 | |||
| ORCL / Oracle Corporation | 0.09 | 75.82 | 24.13 | 126.17 | 0.8129 | 0.8091 | |||
| COR / Cencora, Inc. | 0.08 | 0.00 | 24.10 | 4.23 | 0.8117 | 0.8035 | |||
| ORLY / O'Reilly Automotive, Inc. | 0.22 | -12.12 | 23.45 | 5.11 | 0.7899 | 0.7820 | |||
| TMUS / T-Mobile US, Inc. | 0.10 | 0.00 | 23.20 | 0.47 | 0.7814 | 0.7732 | |||
| MCD / McDonald's Corporation | 0.07 | 13.59 | 22.61 | 18.14 | 0.7617 | 0.7548 | |||
| PANW / Palo Alto Networks, Inc. | 0.11 | 0.00 | 21.95 | -0.50 | 0.7395 | 0.7316 | |||
| PH / Parker-Hannifin Corporation | 0.03 | 25.55 | 21.61 | 36.28 | 0.7279 | 0.7222 | |||
| PGR / The Progressive Corporation | 0.09 | 13.76 | 21.24 | 5.27 | 0.7155 | 0.7083 | |||
| BSX / Boston Scientific Corporation | 0.21 | 0.00 | 20.86 | -9.11 | 0.7028 | 0.6947 | |||
| AMD / Advanced Micro Devices, Inc. | 0.13 | 0.00 | 20.71 | 14.02 | 0.6976 | 0.6912 | |||
| XLV / The Select Sector SPDR Trust - State Street Health Care Select Sector SPDR ETF | 0.14 | 7.69 | 20.08 | 11.19 | 0.6765 | 0.6701 | |||
| ETR / Entergy Corporation | 0.21 | -3.01 | 19.84 | 8.75 | 0.6684 | 0.6619 | |||
| MCO / Moody's Corporation | 0.04 | 19.77 | 0.6661 | 0.6661 | |||||
| ECL / Ecolab Inc. | 0.07 | 25.78 | 19.77 | 27.85 | 0.6661 | 0.6606 | |||
| AIG / American International Group, Inc. | 0.25 | 18.47 | 19.49 | 8.71 | 0.6567 | 0.6503 | |||
| ADI / Analog Devices, Inc. | 0.08 | 0.00 | 19.41 | 3.23 | 0.6539 | 0.6472 | |||
| LECO / Lincoln Electric Holdings, Inc. | 0.08 | 19.10 | 0.6435 | 0.6435 | |||||
| JNJ / Johnson & Johnson | 0.10 | 0.00 | 19.06 | 21.39 | 0.6421 | 0.6365 | |||
| JCI / Johnson Controls International plc | 0.17 | 18.80 | 0.6334 | 0.6334 | |||||
| DUK / Duke Energy Corporation | 0.15 | 0.00 | 18.56 | 4.87 | 0.6253 | 0.6190 | |||
| MTB / M&T Bank Corporation | 0.09 | 18.50 | 0.6231 | 0.6231 | |||||
| 1MDT / Medtronic plc | 0.19 | 0.00 | 18.37 | 9.25 | 0.6189 | 0.6129 | |||
| PLD / Prologis, Inc. | 0.16 | 18.19 | 0.6126 | 0.6126 | |||||
| UNH / UnitedHealth Group Incorporated | 0.05 | 0.00 | 17.54 | 10.68 | 0.5909 | 0.5853 | |||
| RTX / RTX Corporation | 0.10 | 0.00 | 17.32 | 14.59 | 0.5834 | 0.5780 | |||
| CARR / Carrier Global Corporation | 0.28 | 0.00 | 16.55 | -18.43 | 0.5575 | 0.5503 | |||
| TROW / T. Rowe Price Group, Inc. | 0.15 | 15.89 | 0.5353 | 0.5353 | |||||
| RSG / Republic Services, Inc. | 0.07 | 0.00 | 15.72 | -6.94 | 0.5296 | 0.5235 | |||
| SYY / Sysco Corporation | 0.19 | -3.66 | 15.60 | 4.73 | 0.5256 | 0.5203 | |||
| CBRE / CBRE Group, Inc. | 0.10 | 0.00 | 15.47 | 12.45 | 0.5212 | 0.5163 | |||
| SNOW / Snowflake Inc. | 0.07 | 15.38 | 0.5182 | 0.5182 | |||||
| ES / Eversource Energy | 0.21 | 0.00 | 15.30 | 11.82 | 0.5153 | 0.5104 | |||
| BKR / Baker Hughes Company | 0.31 | 0.00 | 15.07 | 27.07 | 0.5078 | 0.5036 | |||
| CCK / Crown Holdings, Inc. | 0.15 | 43.65 | 14.53 | 34.73 | 0.4894 | 0.4855 | |||
| VICI / VICI Properties Inc. | 0.42 | 0.00 | 13.75 | 0.03 | 0.4632 | 0.4583 | |||
| VRTX / Vertex Pharmaceuticals Incorporated | 0.04 | 0.00 | 13.75 | -12.03 | 0.4631 | 0.4575 | |||
| CRM / Salesforce, Inc. | 0.06 | -41.49 | 13.04 | -49.15 | 0.4391 | 0.4300 | |||
| ADSK / Autodesk, Inc. | 0.04 | 0.00 | 12.93 | 2.62 | 0.4356 | 0.4311 | |||
| LHX / L3Harris Technologies, Inc. | 0.04 | 12.86 | 0.4331 | 0.4331 | |||||
| COST / Costco Wholesale Corporation | 0.01 | 0.00 | 12.68 | -6.50 | 0.4272 | 0.4224 | |||
| PODD / Insulet Corporation | 0.04 | 0.00 | 12.57 | -1.74 | 0.4233 | 0.4187 | |||
| TEAM / Atlassian Corporation | 0.08 | 22.08 | 12.19 | -4.00 | 0.4105 | 0.4060 | |||
| POST / Post Holdings, Inc. | 0.11 | -4.64 | 11.93 | -6.00 | 0.4019 | 0.3974 | |||
| CI / The Cigna Group | 0.04 | 0.00 | 11.59 | -12.81 | 0.3904 | 0.3856 | |||
| AVB / AvalonBay Communities, Inc. | 0.06 | 0.00 | 11.13 | -5.08 | 0.3748 | 0.3707 | |||
| TKO / TKO Group Holdings, Inc. | 0.05 | 0.00 | 10.97 | 11.00 | 0.3694 | 0.3659 | |||
| GJR / Strats Trust For Procter & Gambel Security - Preferred Security | 0.07 | 0.00 | 10.79 | -3.57 | 0.3636 | 0.3596 | |||
| AXON / Axon Enterprise, Inc. | 0.01 | 10.55 | 0.3554 | 0.3554 | |||||
| PLTR / Palantir Technologies Inc. | 0.06 | 44.78 | 10.38 | 93.75 | 0.3497 | 0.3478 | |||
| CEG / Constellation Energy Corporation | 0.03 | 0.00 | 9.64 | 1.96 | 0.3248 | 0.3214 | |||
| CVS / CVS Health Corporation | 0.13 | 9.61 | 0.3238 | 0.3238 | |||||
| KO / The Coca-Cola Company | 0.14 | 0.00 | 9.55 | -6.26 | 0.3217 | 0.3181 | |||
| FCX / Freeport-McMoRan Inc. | 0.20 | 6.52 | 7.82 | -3.64 | 0.2635 | 0.2606 | |||
| VST / Vistra Corp. | 0.04 | 0.00 | 7.33 | 1.09 | 0.2468 | 0.2443 | |||
| PHM / PulteGroup, Inc. | 0.05 | 7.07 | 0.2381 | 0.2381 | |||||
| PEP / PepsiCo, Inc. | 0.05 | 0.00 | 6.71 | 6.37 | 0.2261 | 0.2239 | |||
| SPOT / Spotify Technology S.A. | 0.01 | 0.00 | 6.35 | -9.04 | 0.2140 | 0.2115 | |||
| CL / Colgate-Palmolive Company | 0.07 | -18.95 | 5.78 | -28.72 | 0.1947 | 0.1918 | |||
| LW / Lamb Weston Holdings, Inc. | 0.09 | 5.40 | 0.1818 | 0.1818 | |||||
| XLB / The Select Sector SPDR Trust - State Street Materials Select Sector SPDR ETF | 0.05 | 4.59 | 0.1546 | 0.1546 | |||||
| APO / Apollo Global Management, Inc. | 0.00 | -100.00 | 0.00 | -100.00 | -0.0047 | ||||
| DGX / Quest Diagnostics Incorporated | 0.00 | -100.00 | 0.00 | 0.0000 | |||||
| SHW / The Sherwin-Williams Company | 0.00 | -100.00 | 0.00 | 0.0000 | |||||
| ACN / Accenture plc | 0.00 | -100.00 | 0.00 | 0.0000 | |||||
| TMO / Thermo Fisher Scientific Inc. | 0.00 | -100.00 | 0.00 | -100.00 | -0.0058 | ||||
| DE / Deere & Company | 0.00 | -100.00 | 0.00 | -100.00 | -0.0083 | ||||
| CME / CME Group Inc. | 0.00 | -100.00 | 0.00 | 0.0000 | |||||
| PAYC / Paycom Software, Inc. | 0.00 | -100.00 | 0.00 | 0.0000 | |||||
| XLY / The Select Sector SPDR Trust - State Street Consumer Discretionary Select Sector SPDR ETF | 0.00 | -100.00 | 0.00 | 0.0000 | |||||
| SKX / Skechers U.S.A., Inc. | 0.00 | -100.00 | 0.00 | 0.0000 | |||||
| DPZ / Domino's Pizza, Inc. | 0.00 | -100.00 | 0.00 | 0.0000 | |||||
| REGN / Regeneron Pharmaceuticals, Inc. | 0.00 | -100.00 | 0.00 | 0.0000 | |||||
| MMM / 3M Company | 0.00 | -100.00 | 0.00 | 0.0000 | |||||
| HES / Hess Corporation | 0.00 | -100.00 | 0.00 | -100.00 | -0.0024 | ||||
| 1FISV / Fiserv, Inc. | 0.00 | -100.00 | 0.00 | -100.00 | -0.0041 | ||||
| TT / Trane Technologies plc | 0.00 | -100.00 | 0.00 | 0.0000 | |||||
| KVUE / Kenvue Inc. | 0.00 | -100.00 | 0.00 | 0.0000 | |||||
| AMT / American Tower Corporation | 0.00 | -100.00 | 0.00 | -100.00 | -0.0072 |