Estatísticas Básicas
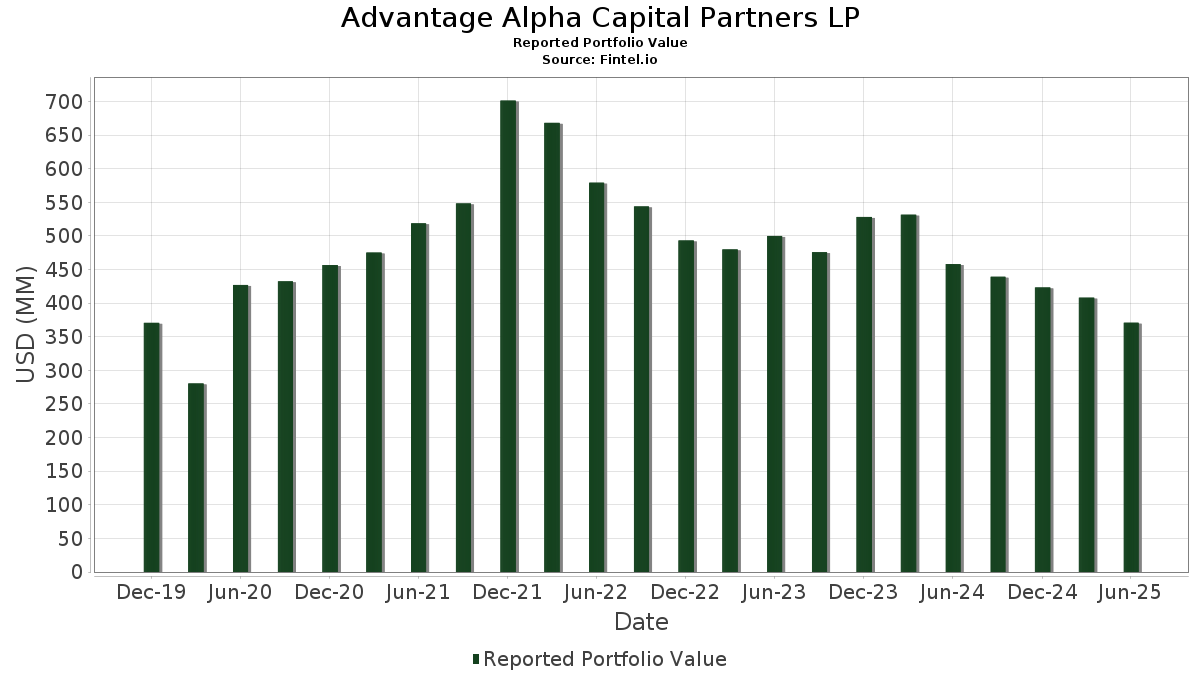
| Valor do Portfólio | $ 331,909,237 |
| Posições Atuais | 130 |
Últimas Participações, Desempenho, AUM (de 13F, 13D)
Advantage Alpha Capital Partners LP divulgou 130 participações totais em seus últimos arquivamentos da SEC. O valor mais recente da carteira é calculado como $ 331,909,237 USD. O Ativo Total Sob Gestão (AUM) é esse valor mais o caixa (que não é divulgado). As principais posições de Advantage Alpha Capital Partners LP são FTAI Aviation Ltd. (US:FTAI) , AvidXchange Holdings, Inc. (US:AVDX) , Zeta Global Holdings Corp. (US:ZETA) , Privia Health Group, Inc. (US:PRVA) , and CECO Environmental Corp. (US:CECO) . As novas posições de Advantage Alpha Capital Partners LP incluem Harrow, Inc. (US:HROW) , Transcat, Inc. (US:TRNS) , Universal Technical Institute, Inc. (US:UTI) , Waystar Holding Corp. (US:WAY) , and Ryman Hospitality Properties, Inc. (MX:RHP) .
Maiores Aumentos Este Trimestre
Usamos a mudança na alocação do portfólio porque esta é a métrica mais significativa. As mudanças podem ser devido a operações ou mudanças nos preços das ações.
| Ativo | Ações (MM) |
Valor (MM$) |
% do Portfólio | Δ% do Portfólio |
|---|---|---|---|---|
| 0.11 | 5.37 | 1.6193 | 1.6193 | |
| 0.05 | 3.41 | 1.0283 | 1.0283 | |
| 0.10 | 3.32 | 0.9999 | 0.9999 | |
| 0.08 | 3.00 | 0.9038 | 0.9038 | |
| 0.03 | 2.90 | 0.8730 | 0.8730 | |
| 0.10 | 2.63 | 0.7924 | 0.7924 | |
| 0.24 | 6.00 | 1.8086 | 0.7462 | |
| 0.02 | 2.43 | 0.7328 | 0.7328 | |
| 0.03 | 2.13 | 0.6410 | 0.6410 | |
| 0.00 | 1.69 | 0.5103 | 0.5103 |
Maiores Diminuições Este Trimestre
Usamos a mudança na alocação do portfólio porque esta é a métrica mais significativa. As mudanças podem ser devido a operações ou mudanças nos preços das ações.
| Ativo | Ações (MM) |
Valor (MM$) |
% do Portfólio | Δ% do Portfólio |
|---|---|---|---|---|
| 0.16 | 3.49 | 1.0529 | -1.1745 | |
| 0.02 | 1.66 | 0.4988 | -0.9394 | |
| 0.02 | 1.81 | 0.5467 | -0.9008 | |
| 0.03 | 1.66 | 0.5006 | -0.7601 | |
| 0.07 | 2.29 | 0.6887 | -0.7249 | |
| 0.11 | 2.86 | 0.8627 | -0.6206 | |
| 0.21 | 2.56 | 0.7723 | -0.4999 | |
| 0.49 | 3.76 | 1.1332 | -0.4697 | |
| 0.04 | 3.46 | 1.0425 | -0.4602 | |
| 0.49 | 1.78 | 0.5348 | -0.4383 |
Arquivamentos 13F e Fundo
Este formulário foi arquivado em 2025-11-12 para o período de relatório 2025-09-30. Clique no ícone de link para ver o histórico completo da transação.
Atualize para desbloquear dados premium e exportar para Excel ![]() .
.
| Ativo | Tipo | Preço Médio por Ação | Ações (MM) |
ΔAções (%) |
Valor ($MM) |
ΔAções (%) |
Portfólio (%) |
ΔPortfólio (%) |
|
|---|---|---|---|---|---|---|---|---|---|
| FTAI / FTAI Aviation Ltd. | 0.06 | -31.90 | 10.04 | -1.22 | 3.0263 | 0.2853 | |||
| AVDX / AvidXchange Holdings, Inc. | 0.69 | -4.80 | 6.82 | -3.24 | 2.0542 | 0.1546 | |||
| ZETA / Zeta Global Holdings Corp. | 0.31 | -30.58 | 6.21 | -10.95 | 1.8697 | -0.0088 | |||
| PRVA / Privia Health Group, Inc. | 0.24 | 40.69 | 6.00 | 52.30 | 1.8086 | 0.7462 | |||
| CECO / CECO Environmental Corp. | 0.11 | -56.24 | 5.82 | -20.85 | 1.7531 | -0.2286 | |||
| HROW / Harrow, Inc. | 0.11 | 5.37 | 1.6193 | 1.6193 | |||||
| GBTG / Global Business Travel Group, Inc. | 0.63 | -20.82 | 5.09 | 1.56 | 1.5337 | 0.1824 | |||
| CWST / Casella Waste Systems, Inc. | 0.05 | 58.18 | 5.02 | 30.07 | 1.5121 | 0.4720 | |||
| HQY / HealthEquity, Inc. | 0.05 | 13.48 | 4.81 | 2.65 | 1.4488 | 0.1861 | |||
| KEX / Kirby Corporation | 0.06 | 39.18 | 4.81 | 2.41 | 1.4481 | 0.1830 | |||
| KN / Knowles Corporation | 0.20 | -20.88 | 4.67 | 4.67 | 1.4057 | 0.2041 | |||
| GTLS / Chart Industries, Inc. | 0.02 | -14.99 | 4.62 | 3.34 | 1.3910 | 0.1867 | |||
| FCFS / FirstCash Holdings, Inc. | 0.03 | -6.31 | 4.60 | 9.83 | 1.3871 | 0.2572 | |||
| FAF / First American Financial Corporation | 0.07 | -15.07 | 4.57 | -11.14 | 1.3775 | -0.0093 | |||
| CON / Concentra Group Holdings Parent, Inc. | 0.22 | 2.17 | 4.57 | 3.96 | 1.3772 | 0.1920 | |||
| KWR / Quaker Chemical Corporation | 0.03 | -28.95 | 4.39 | -16.38 | 1.3214 | -0.0924 | |||
| WSC / WillScot Holdings Corporation | 0.20 | 16.27 | 4.28 | -10.42 | 1.2900 | 0.0016 | |||
| AIZ / Assurant, Inc. | 0.02 | -8.53 | 4.21 | 0.33 | 1.2677 | 0.1371 | |||
| CBZ / CBIZ, Inc. | 0.08 | 58.32 | 4.15 | 16.95 | 1.2495 | 0.2934 | |||
| BHA / Bright Horizons Family Solutions Inc. | 0.04 | 25.73 | 4.07 | 10.47 | 1.2276 | 0.2332 | |||
| OPCH / Option Care Health, Inc. | 0.15 | 30.91 | 4.07 | 11.89 | 1.2275 | 0.2460 | |||
| FA / First Advantage Corporation | 0.26 | -11.13 | 4.07 | -17.67 | 1.2274 | -0.1063 | |||
| SPSC / SPS Commerce, Inc. | 0.04 | 0.01 | 3.99 | -23.47 | 1.2036 | -0.2035 | |||
| CDRE / Cadre Holdings, Inc. | 0.10 | -10.40 | 3.83 | 2.71 | 1.1545 | 0.1488 | |||
| SWIM / Latham Group, Inc. | 0.49 | -46.97 | 3.76 | -36.75 | 1.1332 | -0.4697 | |||
| OMCL / Omnicell, Inc. | 0.12 | 46.47 | 3.76 | 51.76 | 1.1317 | 0.4642 | |||
| FOXF / Fox Factory Holding Corp. | 0.15 | 14.08 | 3.72 | 6.83 | 1.1219 | 0.1823 | |||
| AIN / Albany International Corp. | 0.07 | 8.33 | 3.70 | -17.66 | 1.1152 | -0.0967 | |||
| PRMB / Primo Brands Corporation | 0.17 | 2.96 | 3.70 | -23.17 | 1.1148 | -0.1836 | |||
| LFUS / Littelfuse, Inc. | 0.01 | -23.11 | 3.69 | -12.16 | 1.1104 | -0.0206 | |||
| RDNT / RadNet, Inc. | 0.05 | -27.43 | 3.62 | -2.82 | 1.0919 | 0.0866 | |||
| SXI / Standex International Corporation | 0.02 | -37.98 | 3.62 | -16.00 | 1.0895 | -0.0711 | |||
| CCC / CCC Intelligent Solutions Holdings Inc. | 0.39 | -19.87 | 3.58 | -22.43 | 1.0773 | -0.1652 | |||
| PFSI / PennyMac Financial Services, Inc. | 0.03 | -16.63 | 3.51 | 3.66 | 1.0585 | 0.1448 | |||
| MGNI / Magnite, Inc. | 0.16 | -53.16 | 3.49 | -57.71 | 1.0529 | -1.1745 | |||
| PCOR / Procore Technologies, Inc. | 0.05 | -29.73 | 3.48 | -25.10 | 1.0491 | -0.2042 | |||
| AAON / AAON, Inc. | 0.04 | -51.01 | 3.46 | -37.93 | 1.0425 | -0.4602 | |||
| TRNS / Transcat, Inc. | 0.05 | 3.41 | 1.0283 | 1.0283 | |||||
| MSA / MSA Safety Incorporated | 0.02 | -13.31 | 3.41 | -10.97 | 1.0272 | -0.0050 | |||
| UAO / Sterling Infrastructure, Inc. | 0.01 | -30.86 | 3.39 | 1.80 | 1.0218 | 0.1236 | |||
| NOVT / Novanta Inc. | 0.03 | -6.27 | 3.36 | -27.18 | 1.0115 | -0.2314 | |||
| BLD / TopBuild Corp. | 0.01 | -24.99 | 3.33 | -9.42 | 1.0024 | 0.0121 | |||
| UTI / Universal Technical Institute, Inc. | 0.10 | 3.32 | 0.9999 | 0.9999 | |||||
| FND / Floor & Decor Holdings, Inc. | 0.04 | -33.57 | 3.30 | -35.56 | 0.9956 | -0.3865 | |||
| BL9B / Balchem Corporation | 0.02 | 2.40 | 3.27 | -3.45 | 0.9855 | 0.0720 | |||
| SITE / SiteOne Landscape Supply, Inc. | 0.02 | -41.91 | 3.20 | -38.14 | 0.9638 | -0.4301 | |||
| EXLS / ExlService Holdings, Inc. | 0.07 | -12.15 | 3.14 | -11.69 | 0.9475 | -0.0123 | |||
| EHC / Encompass Health Corporation | 0.02 | -12.47 | 3.10 | -9.34 | 0.9332 | 0.0123 | |||
| ESE / ESCO Technologies Inc. | 0.01 | 9.34 | 3.10 | 20.33 | 0.9328 | 0.2391 | |||
| WAY / Waystar Holding Corp. | 0.08 | 3.00 | 0.9038 | 0.9038 | |||||
| PLNT / Planet Fitness, Inc. | 0.03 | 17.78 | 2.95 | 12.08 | 0.8893 | 0.1796 | |||
| CWAN / Clearwater Analytics Holdings, Inc. | 0.16 | 114.83 | 2.95 | 76.53 | 0.8885 | 0.4382 | |||
| PK2 / Patrick Industries, Inc. | 0.03 | -29.79 | 2.90 | -21.32 | 0.8752 | -0.1198 | |||
| RHP / Ryman Hospitality Properties, Inc. | 0.03 | 2.90 | 0.8730 | 0.8730 | |||||
| UFPI / UFP Industries, Inc. | 0.03 | -19.74 | 2.89 | -24.49 | 0.8716 | -0.1610 | |||
| LSTR / Landstar System, Inc. | 0.02 | 39.42 | 2.88 | 22.92 | 0.8662 | 0.2357 | |||
| NCNO / nCino, Inc. | 0.11 | -46.31 | 2.86 | -47.96 | 0.8627 | -0.6206 | |||
| APG / APi Group Corporation | 0.08 | 62.10 | 2.86 | 9.16 | 0.8618 | 0.1553 | |||
| MTZ / MasTec, Inc. | 0.01 | 28.52 | 2.83 | 60.47 | 0.8526 | 0.3773 | |||
| WCC / WESCO International, Inc. | 0.01 | -38.33 | 2.81 | -29.58 | 0.8480 | -0.2293 | |||
| ESAB / ESAB Corporation | 0.03 | -6.12 | 2.80 | -12.96 | 0.8421 | -0.0237 | |||
| AZZ / AZZ Inc. | 0.03 | -30.16 | 2.79 | -19.33 | 0.8413 | -0.0918 | |||
| VRNS / Varonis Systems, Inc. | 0.05 | -46.14 | 2.78 | -39.00 | 0.8374 | -0.3909 | |||
| HLIO / Helios Technologies, Inc. | 0.05 | -15.77 | 2.76 | 31.63 | 0.8325 | 0.2665 | |||
| WMS / Advanced Drainage Systems, Inc. | 0.02 | -42.35 | 2.74 | -30.38 | 0.8244 | -0.2351 | |||
| TREX / Trex Company, Inc. | 0.05 | -29.82 | 2.72 | -33.32 | 0.8195 | -0.2801 | |||
| WTS / Watts Water Technologies, Inc. | 0.01 | -35.67 | 2.69 | -26.94 | 0.8100 | -0.1818 | |||
| TOL / Toll Brothers, Inc. | 0.02 | -36.93 | 2.67 | -23.65 | 0.8054 | -0.1386 | |||
| CCOI / Cogent Communications Holdings, Inc. | 0.07 | -21.25 | 2.64 | -37.36 | 0.7952 | -0.3406 | |||
| MHO / M/I Homes, Inc. | 0.02 | -33.29 | 2.63 | -14.06 | 0.7939 | -0.0326 | |||
| STVN / Stevanato Group S.p.A. | 0.10 | 2.63 | 0.7924 | 0.7924 | |||||
| CERT / Certara, Inc. | 0.21 | -48.00 | 2.56 | -45.69 | 0.7723 | -0.4999 | |||
| EXP / Eagle Materials Inc. | 0.01 | -47.64 | 2.53 | -39.63 | 0.7634 | -0.3678 | |||
| ROAD / Construction Partners, Inc. | 0.02 | 2.43 | 0.7328 | 0.7328 | |||||
| KNF / Knife River Corporation | 0.03 | 0.05 | 2.41 | -5.82 | 0.7270 | 0.0366 | |||
| SSD / Simpson Manufacturing Co., Inc. | 0.01 | -40.51 | 2.40 | -35.88 | 0.7246 | -0.2861 | |||
| DAR / Darling Ingredients Inc. | 0.07 | -46.43 | 2.29 | -56.42 | 0.6887 | -0.7249 | |||
| KAI / Kadant Inc. | 0.01 | -12.76 | 2.24 | -18.22 | 0.6763 | -0.0636 | |||
| MIDD / The Middleby Corporation | 0.02 | -16.90 | 2.16 | -23.29 | 0.6511 | -0.1083 | |||
| 2OX / Goosehead Insurance, Inc. | 0.03 | 2.13 | 0.6410 | 0.6410 | |||||
| HLIT / Harmonic Inc. | 0.20 | -6.19 | 2.00 | 0.86 | 0.6040 | 0.0681 | |||
| SLM / SLM Corporation | 0.07 | -19.03 | 2.00 | -31.64 | 0.6014 | -0.1859 | |||
| SPXC / SPX Technologies, Inc. | 0.01 | -21.68 | 1.98 | -12.74 | 0.5966 | -0.0153 | |||
| CW / Curtiss-Wright Corporation | 0.00 | -34.35 | 1.90 | -27.04 | 0.5725 | -0.1295 | |||
| BWXT / BWX Technologies, Inc. | 0.01 | -37.89 | 1.88 | -20.51 | 0.5674 | -0.0712 | |||
| WK / Workiva Inc. | 0.02 | -73.13 | 1.81 | -66.21 | 0.5467 | -0.9008 | |||
| GPI / Group 1 Automotive, Inc. | 0.00 | 8.66 | 1.78 | 8.81 | 0.5360 | 0.0955 | |||
| BLND / Blend Labs, Inc. | 0.49 | -55.54 | 1.78 | -50.82 | 0.5348 | -0.4383 | |||
| VERX / Vertex, Inc. | 0.07 | -5.01 | 1.72 | -33.36 | 0.5171 | -0.1771 | |||
| RBC / RBC Bearings Incorporated | 0.00 | 1.69 | 0.5103 | 0.5103 | |||||
| AWI / Armstrong World Industries, Inc. | 0.01 | -57.99 | 1.66 | -49.31 | 0.5011 | -0.3834 | |||
| BL / BlackLine, Inc. | 0.03 | -62.12 | 1.66 | -64.48 | 0.5006 | -0.7601 | |||
| SN / SharkNinja, Inc. | 0.02 | -70.22 | 1.66 | -68.98 | 0.4988 | -0.9394 | |||
| OS / OneStream, Inc. | 0.09 | 1.63 | 0.4897 | 0.4897 | |||||
| IPAR / Interparfums, Inc. | 0.01 | 843.88 | 1.47 | 610.14 | 0.4432 | 0.3871 | |||
| IREN / IREN Limited | 0.03 | -17.09 | 1.33 | 166.93 | 0.4016 | 0.2671 | |||
| CORZ / Core Scientific, Inc. | 0.07 | -18.25 | 1.20 | -14.08 | 0.3604 | -0.0149 | |||
| AN / AutoNation, Inc. | 0.00 | 9.10 | 0.95 | 20.18 | 0.2854 | 0.0729 | |||
| TBI / TrueBlue, Inc. | 0.15 | -28.60 | 0.91 | -32.45 | 0.2755 | -0.0894 | |||
| PAG / Penske Automotive Group, Inc. | 0.00 | 17.32 | 0.86 | 18.84 | 0.2605 | 0.0642 | |||
| RIOT / Riot Platforms, Inc. | 0.03 | -16.90 | 0.65 | 39.83 | 0.1949 | 0.0703 | |||
| HALO / Halozyme Therapeutics, Inc. | 0.01 | -15.62 | 0.62 | 19.00 | 0.1871 | 0.0464 | |||
| ANIP / ANI Pharmaceuticals, Inc. | 0.01 | -20.10 | 0.58 | 12.36 | 0.1754 | 0.0355 | |||
| VCYT / Veracyte, Inc. | 0.02 | -17.07 | 0.54 | 5.43 | 0.1640 | 0.0247 | |||
| ADMA / ADMA Biologics, Inc. | 0.03 | -22.54 | 0.50 | -37.64 | 0.1499 | -0.0652 | |||
| CLSK / CleanSpark, Inc. | 0.03 | -18.58 | 0.43 | 6.91 | 0.1307 | 0.0215 | |||
| ALKS / Alkermes plc | 0.01 | -18.47 | 0.42 | -14.55 | 0.1276 | -0.0059 | |||
| KRYS / Krystal Biotech, Inc. | 0.00 | -17.52 | 0.42 | 6.05 | 0.1270 | 0.0197 | |||
| TGTX / TG Therapeutics, Inc. | 0.01 | -18.97 | 0.42 | -18.83 | 0.1262 | -0.0126 | |||
| ARWR / Arrowhead Pharmaceuticals, Inc. | 0.01 | -8.95 | 0.41 | 99.02 | 0.1224 | 0.0673 | |||
| EBS / Emergent BioSolutions Inc. | 0.05 | 0.41 | 0.1221 | 0.1221 | |||||
| STOK / Stoke Therapeutics, Inc. | 0.02 | -5.29 | 0.40 | 96.06 | 0.1199 | 0.0652 | |||
| MDXG / MiMedx Group, Inc. | 0.06 | -14.21 | 0.40 | -1.99 | 0.1193 | 0.0106 | |||
| PTGX / Protagonist Therapeutics, Inc. | 0.01 | -16.75 | 0.39 | 0.00 | 0.1162 | 0.0123 | |||
| KURA / Kura Oncology, Inc. | 0.04 | 0.38 | 0.1145 | 0.1145 | |||||
| RIGL / Rigel Pharmaceuticals, Inc. | 0.01 | 0.33 | 0.1008 | 0.1008 | |||||
| CDNA / CareDx, Inc. | 0.02 | 0.31 | 0.0927 | 0.0927 | |||||
| KROS / Keros Therapeutics, Inc. | 0.02 | 0.29 | 0.0861 | 0.0861 | |||||
| HUT / Hut 8 Corp. | 0.01 | 0.27 | 0.0828 | 0.0828 | |||||
| CPRX / Catalyst Pharmaceuticals, Inc. | 0.01 | -17.82 | 0.26 | -25.36 | 0.0790 | -0.0157 | |||
| DVAX / Dynavax Technologies Corporation | 0.03 | -16.90 | 0.26 | -16.83 | 0.0775 | -0.0059 | |||
| TBBK / The Bancorp, Inc. | 0.00 | 0.24 | 0.0728 | 0.0728 | |||||
| AUPH / Aurinia Pharmaceuticals Inc. | 0.02 | -13.41 | 0.23 | 13.30 | 0.0694 | 0.0144 | |||
| ACAD / ACADIA Pharmaceuticals Inc. | 0.01 | -15.98 | 0.23 | -16.91 | 0.0683 | -0.0052 | |||
| MARA / MARA Holdings, Inc. | 0.01 | -19.74 | 0.22 | -6.78 | 0.0665 | 0.0028 | |||
| PTCT / PTC Therapeutics, Inc. | 0.00 | -13.87 | 0.22 | 8.37 | 0.0665 | 0.0115 | |||
| UMBF / UMB Financial Corporation | 0.00 | 0.22 | 0.0663 | 0.0663 | |||||
| TCBI / Texas Capital Bancshares, Inc. | 0.00 | 0.21 | 0.0634 | 0.0634 | |||||
| BANF / BancFirst Corporation | 0.00 | 0.21 | 0.0628 | 0.0628 | |||||
| AX / Axos Financial, Inc. | 0.00 | 0.20 | 0.0609 | 0.0609 | |||||
| LGND / Ligand Pharmaceuticals Incorporated | 0.00 | -100.00 | 0.00 | -100.00 | -0.0559 | ||||
| BOOT / Boot Barn Holdings, Inc. | 0.00 | -100.00 | 0.00 | 0.0000 | |||||
| FSS / Federal Signal Corporation | 0.00 | -100.00 | 0.00 | 0.0000 | |||||
| PAY / Paymentus Holdings, Inc. | 0.00 | -100.00 | 0.00 | 0.0000 | |||||
| CSTL / Castle Biosciences, Inc. | 0.00 | -100.00 | 0.00 | 0.0000 | |||||
| FOLD / Amicus Therapeutics, Inc. | 0.00 | -100.00 | 0.00 | 0.0000 | |||||
| KNSA / Kiniksa Pharmaceuticals International, plc | 0.00 | -100.00 | 0.00 | 0.0000 | |||||
| AGYS / Agilysys, Inc. | 0.00 | -100.00 | 0.00 | 0.0000 | |||||
| ZWS / Zurn Elkay Water Solutions Corporation | 0.00 | -100.00 | 0.00 | 0.0000 | |||||
| COLL / Collegium Pharmaceutical, Inc. | 0.00 | -100.00 | 0.00 | 0.0000 |