Estatísticas Básicas
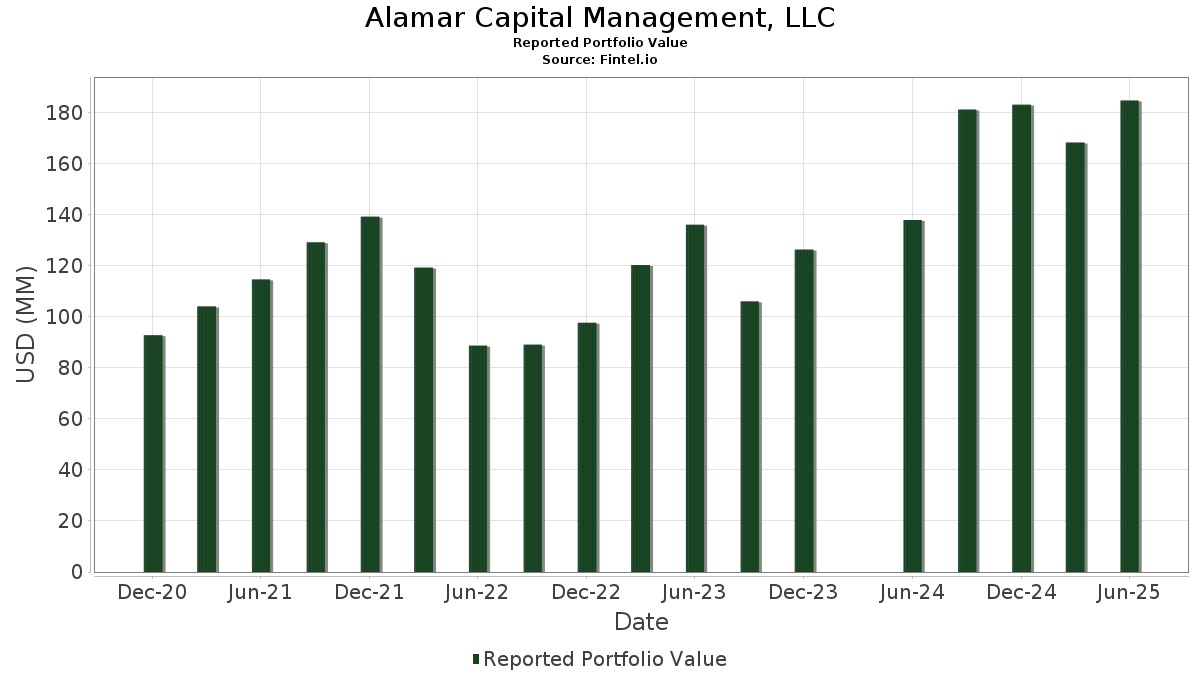
| Valor do Portfólio | $ 189,176,261 |
| Posições Atuais | 74 |
Últimas Participações, Desempenho, AUM (de 13F, 13D)
Alamar Capital Management, LLC divulgou 74 participações totais em seus últimos arquivamentos da SEC. O valor mais recente da carteira é calculado como $ 189,176,261 USD. O Ativo Total Sob Gestão (AUM) é esse valor mais o caixa (que não é divulgado). As principais posições de Alamar Capital Management, LLC são Vanguard Index Funds - Vanguard S&P 500 ETF (US:VOO) , iShares Trust - iShares MSCI EAFE ETF (US:EFA) , iShares Trust - iShares 1-3 Year Treasury Bond ETF (US:SHY) , Tradeweb Markets Inc. (US:TW) , and iShares Trust - iShares Core U.S. Aggregate Bond ETF (US:AGG) . As novas posições de Alamar Capital Management, LLC incluem Robinhood Markets, Inc. (US:HOOD) , Oracle Corporation (US:ORCL) , Bitmine Immersion Technologies, Inc. (US:BMNR) , Grupo Aeroportuario del Sureste, S. A. B. de C. V. - Depositary Receipt (Common Stock) (US:ASR) , and TaskUs, Inc. (US:TASK) .
Maiores Aumentos Este Trimestre
Usamos a mudança na alocação do portfólio porque esta é a métrica mais significativa. As mudanças podem ser devido a operações ou mudanças nos preços das ações.
| Ativo | Ações (MM) |
Valor (MM$) |
% do Portfólio | Δ% do Portfólio |
|---|---|---|---|---|
| 0.01 | 3.75 | 1.9839 | 1.9839 | |
| 0.02 | 3.11 | 1.6450 | 1.6450 | |
| 0.01 | 2.65 | 1.4012 | 1.4012 | |
| 0.04 | 6.90 | 3.6493 | 0.7807 | |
| 0.04 | 22.33 | 11.8059 | 0.7604 | |
| 0.04 | 3.63 | 1.9187 | 0.6552 | |
| 0.09 | 7.40 | 3.9124 | 0.5289 | |
| 0.04 | 4.73 | 2.5028 | 0.4498 | |
| 0.05 | 4.67 | 2.4666 | 0.4467 | |
| 0.02 | 5.01 | 2.6506 | 0.3675 |
Maiores Diminuições Este Trimestre
Usamos a mudança na alocação do portfólio porque esta é a métrica mais significativa. As mudanças podem ser devido a operações ou mudanças nos preços das ações.
| Ativo | Ações (MM) |
Valor (MM$) |
% do Portfólio | Δ% do Portfólio |
|---|---|---|---|---|
| 0.05 | 2.21 | 1.1684 | -1.0212 | |
| 0.02 | 1.03 | 0.5455 | -1.0089 | |
| 0.05 | 4.45 | 2.3532 | -0.7023 | |
| 0.02 | 2.23 | 1.1773 | -0.7020 | |
| 0.03 | 2.65 | 1.4013 | -0.6916 | |
| 0.00 | 0.00 | -0.6835 | ||
| 0.01 | 1.05 | 0.5565 | -0.6260 | |
| 0.02 | 4.09 | 2.1642 | -0.5008 | |
| 0.02 | 2.93 | 1.5504 | -0.4766 | |
| 0.02 | 5.79 | 3.0590 | -0.3579 |
Arquivamentos 13F e Fundo
Este formulário foi arquivado em 2025-11-13 para o período de relatório 2025-09-30. Clique no ícone de link para ver o histórico completo da transação.
Atualize para desbloquear dados premium e exportar para Excel ![]() .
.
| Ativo | Tipo | Preço Médio por Ação | Ações (MM) |
ΔAções (%) |
Valor ($MM) |
ΔAções (%) |
Portfólio (%) |
ΔPortfólio (%) |
|
|---|---|---|---|---|---|---|---|---|---|
| VOO / Vanguard Index Funds - Vanguard S&P 500 ETF | 0.04 | 1.63 | 22.33 | 9.55 | 11.8059 | 0.7604 | |||
| EFA / iShares Trust - iShares MSCI EAFE ETF | 0.09 | 5.67 | 8.57 | 10.38 | 4.5314 | 0.3235 | |||
| SHY / iShares Trust - iShares 1-3 Year Treasury Bond ETF | 0.09 | 18.37 | 7.40 | 18.51 | 3.9124 | 0.5289 | |||
| TW / Tradeweb Markets Inc. | 0.04 | -0.72 | 6.90 | 30.39 | 3.6493 | 0.7807 | |||
| AGG / iShares Trust - iShares Core U.S. Aggregate Bond ETF | 0.07 | 8.06 | 6.74 | 9.20 | 3.5644 | 0.2192 | |||
| PGR / The Progressive Corporation | 0.02 | -0.85 | 5.79 | -8.25 | 3.0590 | -0.3579 | |||
| APPF / AppFolio, Inc. | 0.02 | -0.60 | 5.01 | 18.98 | 2.6506 | 0.3675 | |||
| APH / Amphenol Corporation | 0.04 | -0.26 | 4.73 | 24.94 | 2.5028 | 0.4498 | |||
| WK / Workiva Inc. | 0.05 | -0.48 | 4.67 | 25.16 | 2.4666 | 0.4467 | |||
| VTV / Vanguard Index Funds - Vanguard Value ETF | 0.02 | 8.66 | 4.46 | 14.59 | 2.3580 | 0.2493 | |||
| FTNT / Fortinet, Inc. | 0.05 | -0.75 | 4.45 | -21.07 | 2.3532 | -0.7023 | |||
| NOW / ServiceNow, Inc. | 0.00 | -0.08 | 4.36 | -10.57 | 2.3029 | -0.3361 | |||
| NFLX / Netflix, Inc. | 0.00 | 0.17 | 4.30 | -10.33 | 2.2714 | -0.3245 | |||
| WDAY / Workday, Inc. | 0.02 | 17.73 | 4.27 | 18.09 | 2.2568 | 0.2981 | |||
| HCA / HCA Healthcare, Inc. | 0.01 | -0.71 | 4.15 | 10.44 | 2.1921 | 0.1581 | |||
| PANW / Palo Alto Networks, Inc. | 0.02 | -16.35 | 4.09 | -16.77 | 2.1642 | -0.5008 | |||
| MGM / MGM Resorts International | 0.11 | -0.43 | 3.81 | 0.37 | 2.0163 | -0.0430 | |||
| INTA / Intapp, Inc. | 0.09 | 13.89 | 3.78 | -9.77 | 1.9965 | -0.2710 | |||
| SPOT / Spotify Technology S.A. | 0.01 | 3.75 | 1.9839 | 1.9839 | |||||
| OKTA / Okta, Inc. | 0.04 | 0.15 | 3.75 | -8.12 | 1.9797 | -0.2290 | |||
| ABNB / Airbnb, Inc. | 0.03 | -0.31 | 3.67 | -8.54 | 1.9422 | -0.2342 | |||
| PCTY / Paylocity Holding Corporation | 0.02 | -0.44 | 3.63 | -12.49 | 1.9188 | -0.3283 | |||
| ESTC / Elastic N.V. | 0.04 | 55.34 | 3.63 | 55.62 | 1.9187 | 0.6552 | |||
| MDB / MongoDB, Inc. | 0.01 | -37.47 | 3.61 | -7.59 | 1.9062 | -0.2076 | |||
| XYZ / Block, Inc. | 0.05 | -0.96 | 3.36 | 5.36 | 1.7764 | 0.0485 | |||
| HOOD / Robinhood Markets, Inc. | 0.02 | 3.11 | 1.6450 | 1.6450 | |||||
| LRN / Stride, Inc. | 0.02 | -0.20 | 2.96 | 2.38 | 1.5663 | -0.0017 | |||
| MKTX / MarketAxess Holdings Inc. | 0.02 | 0.48 | 2.93 | -21.63 | 1.5504 | -0.4766 | |||
| MSCI / MSCI Inc. | 0.00 | -0.08 | 2.76 | -1.67 | 1.4607 | -0.0622 | |||
| WRB / W. R. Berkley Corporation | 0.03 | -34.20 | 2.65 | -31.40 | 1.4013 | -0.6916 | |||
| ORCL / Oracle Corporation | 0.01 | 2.65 | 1.4012 | 1.4012 | |||||
| IWN / iShares Trust - iShares Russell 2000 Value ETF | 0.01 | 11.18 | 2.64 | 24.66 | 1.3950 | 0.2476 | |||
| ASO / Academy Sports and Outdoors, Inc. | 0.05 | -0.34 | 2.59 | 11.21 | 1.3688 | 0.1074 | |||
| EOG / EOG Resources, Inc. | 0.02 | -31.51 | 2.23 | -35.78 | 1.1773 | -0.7020 | |||
| SKWD / Skyward Specialty Insurance Group, Inc. | 0.05 | -33.55 | 2.21 | -45.31 | 1.1684 | -1.0212 | |||
| ISRG / Intuitive Surgical, Inc. | 0.00 | -0.35 | 1.90 | -17.98 | 1.0057 | -0.2511 | |||
| IWD / iShares Trust - iShares Russell 1000 Value ETF | 0.01 | 0.00 | 1.65 | 4.76 | 0.8722 | 0.0194 | |||
| KHC / The Kraft Heinz Company | 0.06 | -0.17 | 1.58 | 0.70 | 0.8337 | -0.0150 | |||
| IWF / iShares Trust - iShares Russell 1000 Growth ETF | 0.00 | 3.64 | 1.58 | 14.30 | 0.8330 | 0.0863 | |||
| WSM / Williams-Sonoma, Inc. | 0.01 | -1.57 | 1.44 | 17.77 | 0.7602 | 0.0986 | |||
| AAPL / Apple Inc. | 0.01 | 0.02 | 1.42 | 24.17 | 0.7496 | 0.1307 | |||
| DELL / Dell Technologies Inc. | 0.01 | 0.28 | 1.41 | 15.90 | 0.7478 | 0.0869 | |||
| BRK.B / Berkshire Hathaway Inc. | 0.00 | 0.00 | 1.25 | 3.47 | 0.6615 | 0.0064 | |||
| SPY / SPDR S&P 500 ETF | 0.00 | 1.75 | 1.08 | 9.72 | 0.5734 | 0.0377 | |||
| FND / Floor & Decor Holdings, Inc. | 0.01 | -50.29 | 1.05 | -51.79 | 0.5565 | -0.6260 | |||
| AMZN / Amazon.com, Inc. | 0.00 | 6.73 | 1.05 | 6.85 | 0.5525 | 0.0224 | |||
| DXCM / DexCom, Inc. | 0.02 | -53.34 | 1.03 | -64.06 | 0.5455 | -1.0089 | |||
| VYM / Vanguard Whitehall Funds - Vanguard High Dividend Yield ETF | 0.01 | -4.67 | 0.94 | 0.86 | 0.4944 | -0.0083 | |||
| MSFT / Microsoft Corporation | 0.00 | 0.00 | 0.83 | 4.16 | 0.4368 | 0.0069 | |||
| BSV / Vanguard Bond Index Funds - Vanguard Short-Term Bond ETF | 0.01 | -0.31 | 0.63 | 0.00 | 0.3327 | -0.0084 | |||
| BIV / Vanguard Bond Index Funds - Vanguard Intermediate-Term Bond ETF | 0.01 | 4.02 | 0.61 | 5.03 | 0.3202 | 0.0077 | |||
| GOOGL / Alphabet Inc. | 0.00 | 0.00 | 0.59 | 37.91 | 0.3137 | 0.0806 | |||
| META / Meta Platforms, Inc. | 0.00 | 6.67 | 0.59 | 6.15 | 0.3106 | 0.0107 | |||
| AVGO / Broadcom Inc. | 0.00 | 0.00 | 0.55 | 19.65 | 0.2930 | 0.0421 | |||
| AMD / Advanced Micro Devices, Inc. | 0.00 | 0.00 | 0.55 | 14.11 | 0.2908 | 0.0294 | |||
| VWO / Vanguard International Equity Index Funds - Vanguard FTSE Emerging Markets ETF | 0.01 | 0.25 | 0.53 | 9.88 | 0.2824 | 0.0189 | |||
| SCHK / Schwab Strategic Trust - Schwab 1000 Index ETF | 0.02 | 0.17 | 0.51 | 7.76 | 0.2722 | 0.0137 | |||
| NVDD / Direxion Shares ETF Trust - Direxion Daily NVDA Bear 1X Shares | 0.00 | 0.00 | 0.38 | 18.24 | 0.1989 | 0.0263 | |||
| VITS.X / Vanguard Index Funds - Vanguard Total Stock Market ETF | 0.00 | -0.44 | 0.37 | 7.60 | 0.1948 | 0.0090 | |||
| IEFA / iShares Trust - iShares Core MSCI EAFE ETF | 0.00 | 0.00 | 0.36 | 4.64 | 0.1912 | 0.0038 | |||
| GOOG / Alphabet Inc. | 0.00 | 0.00 | 0.31 | 37.89 | 0.1655 | 0.0419 | |||
| PWB / Invesco Exchange-Traded Fund Trust - Invesco Large Cap Growth ETF | 0.00 | 0.00 | 0.28 | 6.82 | 0.1492 | 0.0060 | |||
| OBDC / Blue Owl Capital Corporation | 0.02 | 0.00 | 0.26 | -10.88 | 0.1389 | -0.0205 | |||
| JPM / JPMorgan Chase & Co. | 0.00 | 0.00 | 0.26 | 8.75 | 0.1384 | 0.0080 | |||
| BMNR / Bitmine Immersion Technologies, Inc. | 0.01 | 0.26 | 0.1373 | 0.1373 | |||||
| ASR / Grupo Aeroportuario del Sureste, S. A. B. de C. V. - Depositary Receipt (Common Stock) | 0.00 | 0.23 | 0.1227 | 0.1227 | |||||
| VEA / Vanguard Tax-Managed Funds - Vanguard FTSE Developed Markets ETF | 0.00 | -1.28 | 0.23 | 3.60 | 0.1219 | 0.0015 | |||
| LYFT / Lyft, Inc. | 0.01 | 0.00 | 0.22 | 40.13 | 0.1163 | 0.0310 | |||
| FSK / FS KKR Capital Corp. | 0.01 | 0.00 | 0.22 | -27.33 | 0.1157 | -0.0470 | |||
| OMAB / Grupo Aeroportuario del Centro Norte, S.A.B. de C.V. - Depositary Receipt (Common Stock) | 0.00 | 0.00 | 0.22 | -1.36 | 0.1153 | -0.0047 | |||
| SO / The Southern Company | 0.00 | 0.00 | 0.22 | 2.84 | 0.1151 | 0.0008 | |||
| PAC / Grupo Aeroportuario del Pacífico, S.A.B. de C.V. - Depositary Receipt (Common Stock) | 0.00 | 0.00 | 0.21 | 3.40 | 0.1128 | 0.0009 | |||
| SPSC / SPS Commerce, Inc. | 0.00 | 33.33 | 0.21 | 1.96 | 0.1101 | -0.0005 | |||
| TASK / TaskUs, Inc. | 0.01 | 0.20 | 0.1038 | 0.1038 | |||||
| VLO / Valero Energy Corporation | 0.00 | -100.00 | 0.00 | -100.00 | -0.6835 | ||||
| SIGI / Selective Insurance Group, Inc. | 0.00 | -100.00 | 0.00 | 0.0000 | |||||
| ACI / Albertsons Companies, Inc. | 0.00 | -100.00 | 0.00 | 0.0000 | |||||
| EG / Everest Group, Ltd. | 0.00 | -100.00 | 0.00 | 0.0000 | |||||
| BL / BlackLine, Inc. | 0.00 | -100.00 | 0.00 | 0.0000 |