Estatísticas Básicas
| Valor do Portfólio | $ 250,760,500 |
| Posições Atuais | 167 |
Últimas Participações, Desempenho, AUM (de 13F, 13D)
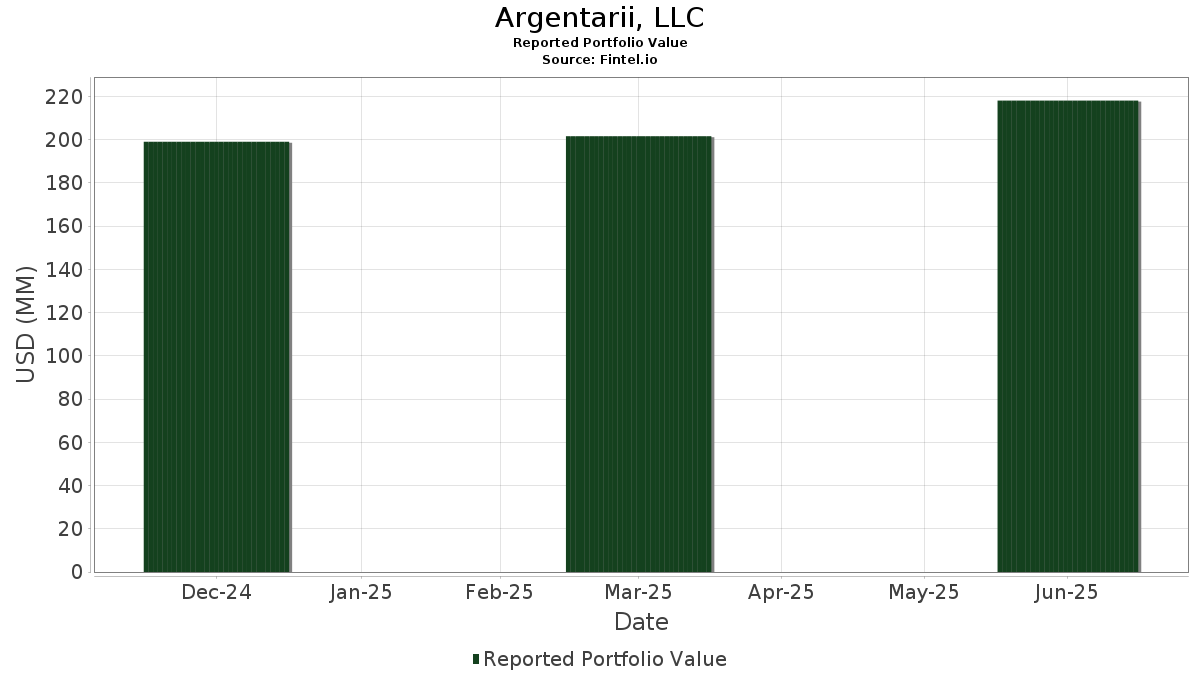
Argentarii, LLC divulgou 167 participações totais em seus últimos arquivamentos da SEC. O valor mais recente da carteira é calculado como $ 250,760,500 USD. O Ativo Total Sob Gestão (AUM) é esse valor mais o caixa (que não é divulgado). As principais posições de Argentarii, LLC são NVIDIA Corporation (US:NVDA) , Tesla, Inc. (US:TSLA) , Microsoft Corporation (US:MSFT) , Apple Inc. (US:AAPL) , and Alphabet Inc. (US:GOOGL) . As novas posições de Argentarii, LLC incluem Dow Inc. (US:DOW) , Valero Energy Corporation (US:VLO) , NextEra Energy, Inc. (US:NEE) , T Stamp Inc. (US:IDAI) , and Micron Technology, Inc. (US:MU) .
Maiores Aumentos Este Trimestre
Usamos a mudança na alocação do portfólio porque esta é a métrica mais significativa. As mudanças podem ser devido a operações ou mudanças nos preços das ações.
| Ativo | Ações (MM) |
Valor (MM$) |
% do Portfólio | Δ% do Portfólio |
|---|---|---|---|---|
| 0.00 | 16.84 | 6.7162 | 6.1611 | |
| 0.04 | 10.04 | 4.0056 | 0.6799 | |
| 0.06 | 15.32 | 6.1086 | 0.4218 | |
| 0.00 | 1.87 | 0.7453 | 0.3268 | |
| 0.11 | 20.00 | 7.9757 | 0.2389 | |
| 0.02 | 0.46 | 0.1852 | 0.1852 | |
| 0.03 | 4.10 | 1.6367 | 0.1343 | |
| 0.00 | 0.31 | 0.1236 | 0.1236 | |
| 0.02 | 7.95 | 3.1723 | 0.1215 | |
| 0.00 | 0.27 | 0.1085 | 0.1085 |
Maiores Diminuições Este Trimestre
Usamos a mudança na alocação do portfólio porque esta é a métrica mais significativa. As mudanças podem ser devido a operações ou mudanças nos preços das ações.
| Ativo | Ações (MM) |
Valor (MM$) |
% do Portfólio | Δ% do Portfólio |
|---|---|---|---|---|
| 0.03 | 16.34 | 6.5156 | -0.6788 | |
| 0.03 | 6.74 | 2.6898 | -0.6153 | |
| 0.01 | 4.68 | 1.8671 | -0.4187 | |
| 0.01 | 4.23 | 1.6850 | -0.3828 | |
| 0.02 | 2.56 | 1.0200 | -0.3379 | |
| 0.01 | 3.00 | 1.1953 | -0.3292 | |
| 0.03 | 2.81 | 1.1218 | -0.2975 | |
| 0.00 | 2.32 | 0.9261 | -0.2643 | |
| 0.01 | 1.74 | 0.6930 | -0.2565 | |
| 0.01 | 2.68 | 1.0683 | -0.2397 |
Arquivamentos 13F e Fundo
Este formulário foi arquivado em 2025-10-27 para o período de relatório 2025-09-30. Clique no ícone de link para ver o histórico completo da transação.
Atualize para desbloquear dados premium e exportar para Excel ![]() .
.
| Ativo | Tipo | Preço Médio por Ação | Ações (MM) |
ΔAções (%) |
Valor ($MM) |
ΔAções (%) |
Portfólio (%) |
ΔPortfólio (%) |
|
|---|---|---|---|---|---|---|---|---|---|
| NVDA / NVIDIA Corporation | 0.11 | 0.40 | 20.00 | 18.57 | 7.9757 | 0.2389 | |||
| TSLA / Tesla, Inc. | 0.00 | -0.60 | 16.84 | 1,291.82 | 6.7162 | 6.1611 | |||
| MSFT / Microsoft Corporation | 0.03 | 0.04 | 16.34 | 4.16 | 6.5156 | -0.6788 | |||
| AAPL / Apple Inc. | 0.06 | -0.45 | 15.32 | 23.54 | 6.1086 | 0.4218 | |||
| GOOGL / Alphabet Inc. | 0.04 | 0.43 | 10.04 | 38.54 | 4.0056 | 0.6799 | |||
| JPM / JPMorgan Chase & Co. | 0.03 | 0.01 | 8.19 | 8.83 | 3.2649 | -0.1861 | |||
| AVGO / Broadcom Inc. | 0.02 | -0.07 | 7.95 | 19.59 | 3.1723 | 0.1215 | |||
| AMZN / Amazon.com, Inc. | 0.03 | -6.47 | 6.74 | -6.40 | 2.6898 | -0.6153 | |||
| COST / Costco Wholesale Corporation | 0.01 | 0.48 | 4.68 | -6.06 | 1.8671 | -0.4187 | |||
| VFH / Vanguard World Fund - Vanguard Financials ETF | 0.03 | -0.51 | 4.53 | 2.56 | 1.8068 | -0.2194 | |||
| WMT / Walmart Inc. | 0.04 | 5.60 | 4.43 | 11.30 | 1.7682 | -0.0590 | |||
| V / Visa Inc. | 0.01 | -2.51 | 4.23 | -6.28 | 1.6850 | -0.3828 | |||
| PH / Parker-Hannifin Corporation | 0.01 | 0.00 | 4.19 | 8.54 | 1.6723 | -0.0997 | |||
| APH / Amphenol Corporation | 0.03 | -0.02 | 4.10 | 25.31 | 1.6367 | 0.1343 | |||
| WELL / Welltower Inc. | 0.02 | 0.00 | 3.76 | 15.88 | 1.4991 | 0.0111 | |||
| LLY / Eli Lilly and Company | 0.00 | 1.52 | 3.67 | -0.65 | 1.4655 | -0.2309 | |||
| META / Meta Platforms, Inc. | 0.00 | 3.22 | 3.53 | 2.71 | 1.4065 | -0.1690 | |||
| SPGI / S&P Global Inc. | 0.01 | -2.30 | 3.00 | -9.81 | 1.1953 | -0.3292 | |||
| HD / The Home Depot, Inc. | 0.01 | -6.06 | 2.91 | 3.82 | 1.1598 | -0.1253 | |||
| KMI / Kinder Morgan, Inc. | 0.10 | 1.76 | 2.85 | -2.03 | 1.1361 | -0.1974 | |||
| BSX / Boston Scientific Corporation | 0.03 | 0.02 | 2.81 | -9.08 | 1.1218 | -0.2975 | |||
| IBM / International Business Machines Corporation | 0.01 | -1.86 | 2.68 | -6.07 | 1.0683 | -0.2397 | |||
| WMB / The Williams Companies, Inc. | 0.04 | -0.04 | 2.62 | 0.81 | 1.0463 | -0.1473 | |||
| XOM / Exxon Mobil Corporation | 0.02 | -17.39 | 2.56 | -13.61 | 1.0200 | -0.3379 | |||
| NFLX / Netflix, Inc. | 0.00 | -0.05 | 2.32 | -10.52 | 0.9261 | -0.2643 | |||
| PGR / The Progressive Corporation | 0.01 | 0.03 | 2.28 | -7.43 | 0.9090 | -0.2204 | |||
| NOW / ServiceNow, Inc. | 0.00 | 0.15 | 1.90 | -10.33 | 0.7582 | -0.2146 | |||
| APP / AppLovin Corporation | 0.00 | -0.19 | 1.87 | 104.82 | 0.7453 | 0.3268 | |||
| GLD / SPDR Gold Shares | 0.01 | 0.00 | 1.78 | 16.60 | 0.7088 | 0.0097 | |||
| DLR / Digital Realty Trust, Inc. | 0.01 | -15.34 | 1.74 | -16.09 | 0.6930 | -0.2565 | |||
| HWM / Howmet Aerospace Inc. | 0.01 | -0.28 | 1.72 | 5.13 | 0.6872 | -0.0647 | |||
| HLT / Hilton Worldwide Holdings Inc. | 0.01 | 0.00 | 1.67 | -2.57 | 0.6660 | -0.1204 | |||
| CTAS / Cintas Corporation | 0.01 | 2.91 | 1.65 | -5.23 | 0.6576 | -0.1404 | |||
| AXP / American Express Company | 0.00 | 0.02 | 1.59 | 4.19 | 0.6349 | -0.0662 | |||
| PANW / Palo Alto Networks, Inc. | 0.01 | -0.08 | 1.55 | -0.58 | 0.6182 | -0.0970 | |||
| ETN / Eaton Corporation plc | 0.00 | 0.00 | 1.50 | 4.76 | 0.5969 | -0.0581 | |||
| RACE / Ferrari N.V. | 0.00 | -1.28 | 1.46 | -2.40 | 0.5832 | -0.1040 | |||
| IJH / iShares Trust - iShares Core S&P Mid-Cap ETF | 0.02 | 5.71 | 1.46 | 11.31 | 0.5811 | -0.0197 | |||
| EMR / Emerson Electric Co. | 0.01 | -16.85 | 1.41 | -18.15 | 0.5611 | -0.2277 | |||
| GJR / Strats Trust For Procter & Gambel Security - Preferred Security | 0.01 | -14.75 | 1.39 | -17.74 | 0.5547 | -0.2213 | |||
| TTWO / Take-Two Interactive Software, Inc. | 0.01 | 10.28 | 1.32 | 17.29 | 0.5250 | 0.0103 | |||
| SYF / Synchrony Financial | 0.02 | 0.01 | 1.31 | 6.52 | 0.5213 | -0.0419 | |||
| UNH / UnitedHealth Group Incorporated | 0.00 | 1.46 | 1.27 | 12.37 | 0.5073 | -0.0123 | |||
| PLTR / Palantir Technologies Inc. | 0.01 | 0.36 | 1.27 | 34.25 | 0.5052 | 0.0725 | |||
| QQQ_KZ / Invesco QQQ Trust, Series 1 | 0.00 | -3.40 | 1.24 | 5.07 | 0.4961 | -0.0467 | |||
| MA / Mastercard Incorporated | 0.00 | 3.15 | 1.23 | 4.41 | 0.4906 | -0.0499 | |||
| AEM / Agnico Eagle Mines Limited | 0.01 | 0.00 | 1.20 | 41.68 | 0.4787 | 0.0902 | |||
| TFC / Truist Financial Corporation | 0.03 | -17.11 | 1.15 | -11.84 | 0.4575 | -0.1394 | |||
| WWD / Woodward, Inc. | 0.00 | -1.41 | 1.11 | 1.65 | 0.4426 | -0.0582 | |||
| EW / Edwards Lifesciences Corporation | 0.01 | 28.50 | 1.09 | 27.78 | 0.4347 | 0.0434 | |||
| MNST / Monster Beverage Corporation | 0.02 | 9.41 | 1.08 | 17.52 | 0.4310 | 0.0093 | |||
| BRK.B / Berkshire Hathaway Inc. | 0.00 | -0.19 | 1.07 | 3.28 | 0.4268 | -0.0484 | |||
| HCA / HCA Healthcare, Inc. | 0.00 | 0.00 | 1.06 | 11.24 | 0.4223 | -0.0145 | |||
| PEP / PepsiCo, Inc. | 0.01 | -3.67 | 1.05 | 2.43 | 0.4200 | -0.0515 | |||
| PM / Philip Morris International Inc. | 0.01 | 13.33 | 1.05 | 0.87 | 0.4186 | -0.0585 | |||
| ORCL / Oracle Corporation | 0.00 | 0.05 | 1.04 | 28.71 | 0.4151 | 0.0441 | |||
| MCD / McDonald's Corporation | 0.00 | -14.71 | 0.99 | -11.34 | 0.3962 | -0.1175 | |||
| URI / United Rentals, Inc. | 0.00 | 0.10 | 0.98 | 26.61 | 0.3912 | 0.0361 | |||
| VUG / Vanguard Index Funds - Vanguard Growth ETF | 0.00 | 0.52 | 0.93 | 9.81 | 0.3708 | -0.0172 | |||
| SPY / SPDR S&P 500 ETF | 0.00 | -5.78 | 0.92 | 1.54 | 0.3679 | -0.0486 | |||
| IJR / iShares Trust - iShares Core S&P Small-Cap ETF | 0.01 | 0.00 | 0.92 | 8.77 | 0.3663 | -0.0212 | |||
| VZ / Verizon Communications Inc. | 0.02 | 0.90 | 0.91 | 2.48 | 0.3632 | -0.0444 | |||
| MPC / Marathon Petroleum Corporation | 0.00 | -4.31 | 0.86 | 10.93 | 0.3445 | -0.0124 | |||
| ALL / The Allstate Corporation | 0.00 | -15.17 | 0.85 | -9.55 | 0.3399 | -0.0923 | |||
| HON / Honeywell International Inc. | 0.00 | -0.35 | 0.83 | -9.89 | 0.3306 | -0.0917 | |||
| MRK / Merck & Co., Inc. | 0.01 | 1.01 | 0.82 | 7.09 | 0.3254 | -0.0241 | |||
| CMCSA / Comcast Corporation | 0.03 | 5.32 | 0.80 | -7.27 | 0.3208 | -0.0772 | |||
| ABBV / AbbVie Inc. | 0.00 | -2.62 | 0.78 | 21.58 | 0.3124 | 0.0166 | |||
| DIA / SPDR Dow Jones Industrial Average ETF Trust | 0.00 | -1.47 | 0.77 | 3.61 | 0.3090 | -0.0338 | |||
| IVV / iShares Trust - iShares Core S&P 500 ETF | 0.00 | 0.00 | 0.77 | 7.83 | 0.3075 | -0.0206 | |||
| DHI / D.R. Horton, Inc. | 0.00 | -18.40 | 0.74 | 7.27 | 0.2946 | -0.0213 | |||
| FLUT / Flutter Entertainment plc | 0.00 | 7.87 | 0.72 | -4.11 | 0.2887 | -0.0576 | |||
| MELI / MercadoLibre, Inc. | 0.00 | 8.48 | 0.72 | -2.98 | 0.2861 | -0.0532 | |||
| AMAT / Applied Materials, Inc. | 0.00 | 29.21 | 0.71 | 44.67 | 0.2817 | 0.0575 | |||
| SHW / The Sherwin-Williams Company | 0.00 | -3.40 | 0.69 | -2.55 | 0.2748 | -0.0496 | |||
| UNP / Union Pacific Corporation | 0.00 | -10.24 | 0.69 | -7.77 | 0.2744 | -0.0679 | |||
| HPE / Hewlett Packard Enterprise Company | 0.03 | 0.00 | 0.65 | 20.22 | 0.2608 | 0.0110 | |||
| PLD / Prologis, Inc. | 0.01 | -0.43 | 0.63 | 8.56 | 0.2528 | -0.0153 | |||
| COP / ConocoPhillips | 0.01 | -11.78 | 0.61 | -7.07 | 0.2416 | -0.0572 | |||
| C / Citigroup Inc. | 0.01 | -17.41 | 0.60 | -1.64 | 0.2401 | -0.0403 | |||
| VCR / Vanguard World Fund - Vanguard Consumer Discretionary ETF | 0.00 | -27.85 | 0.59 | -21.07 | 0.2362 | -0.1082 | |||
| SPG / Simon Property Group, Inc. | 0.00 | -17.35 | 0.59 | -3.45 | 0.2346 | -0.0451 | |||
| RF / Regions Financial Corporation | 0.02 | 1.05 | 0.58 | 13.16 | 0.2301 | -0.0035 | |||
| VTV / Vanguard Index Funds - Vanguard Value ETF | 0.00 | 21.62 | 0.57 | 28.19 | 0.2288 | 0.0237 | |||
| ADP / Automatic Data Processing, Inc. | 0.00 | -0.15 | 0.57 | -5.01 | 0.2271 | -0.0478 | |||
| CVX / Chevron Corporation | 0.00 | 14.18 | 0.56 | 23.73 | 0.2229 | 0.0159 | |||
| OWL / Blue Owl Capital Inc. | 0.03 | -15.87 | 0.53 | -25.87 | 0.2127 | -0.1173 | |||
| GD / General Dynamics Corporation | 0.00 | -15.12 | 0.53 | -0.75 | 0.2108 | -0.0335 | |||
| JNJ / Johnson & Johnson | 0.00 | -0.61 | 0.52 | 20.61 | 0.2054 | 0.0095 | |||
| ZTS / Zoetis Inc. | 0.00 | -42.95 | 0.47 | -46.46 | 0.1871 | -0.2149 | |||
| DOW / Dow Inc. | 0.02 | 0.46 | 0.1852 | 0.1852 | |||||
| WDAY / Workday, Inc. | 0.00 | 13.56 | 0.46 | 13.75 | 0.1817 | -0.0018 | |||
| TRMB / Trimble Inc. | 0.01 | 12.40 | 0.46 | 21.01 | 0.1815 | 0.0087 | |||
| TMO / Thermo Fisher Scientific Inc. | 0.00 | -9.18 | 0.45 | 8.67 | 0.1799 | -0.0106 | |||
| TJX / The TJX Companies, Inc. | 0.00 | -8.56 | 0.45 | 6.94 | 0.1785 | -0.0134 | |||
| EXE / Expand Energy Corporation | 0.00 | 30.38 | 0.45 | 18.30 | 0.1782 | 0.0051 | |||
| ORLY / O'Reilly Automotive, Inc. | 0.00 | 9.08 | 0.43 | 30.51 | 0.1725 | 0.0204 | |||
| VBR / Vanguard Index Funds - Vanguard Small-Cap Value ETF | 0.00 | 17.13 | 0.42 | 25.22 | 0.1685 | 0.0139 | |||
| BLK / BlackRock, Inc. | 0.00 | 0.00 | 0.42 | 11.17 | 0.1670 | -0.0059 | |||
| QUAL / iShares Trust - iShares MSCI USA Quality Factor ETF | 0.00 | 0.00 | 0.41 | 6.22 | 0.1639 | -0.0133 | |||
| EMO / ClearBridge Energy Midstream Opportunity Fund Inc | 0.01 | 0.01 | 0.41 | -6.22 | 0.1624 | -0.0371 | |||
| PFG / Principal Financial Group, Inc. | 0.00 | -30.73 | 0.40 | -27.74 | 0.1582 | -0.0934 | |||
| KYN / Kayne Anderson Energy Infrastructure Fund, Inc. | 0.03 | 0.00 | 0.39 | -2.74 | 0.1562 | -0.0285 | |||
| IYW / iShares Trust - iShares U.S. Technology ETF | 0.00 | 0.00 | 0.39 | 13.01 | 0.1562 | -0.0027 | |||
| VBK / Vanguard Index Funds - Vanguard Small-Cap Growth ETF | 0.00 | 18.05 | 0.39 | 27.06 | 0.1537 | 0.0143 | |||
| BAC / Bank of America Corporation | 0.01 | -1.12 | 0.38 | 8.02 | 0.1504 | -0.0101 | |||
| ROP / Roper Technologies, Inc. | 0.00 | -1.69 | 0.38 | -13.36 | 0.1499 | -0.0495 | |||
| GS / The Goldman Sachs Group, Inc. | 0.00 | 0.00 | 0.37 | 12.69 | 0.1490 | -0.0033 | |||
| ISRG / Intuitive Surgical, Inc. | 0.00 | -8.54 | 0.37 | -24.80 | 0.1489 | -0.0786 | |||
| GILD / Gilead Sciences, Inc. | 0.00 | 0.09 | 0.37 | 0.27 | 0.1480 | -0.0219 | |||
| AMGN / Amgen Inc. | 0.00 | 21.93 | 0.37 | 23.57 | 0.1464 | 0.0098 | |||
| SUPN / Supernus Pharmaceuticals, Inc. | 0.01 | 0.00 | 0.36 | 51.69 | 0.1429 | 0.0345 | |||
| VOT / Vanguard Index Funds - Vanguard Mid-Cap Growth ETF | 0.00 | 26.66 | 0.35 | 30.94 | 0.1386 | 0.0168 | |||
| EFA / iShares Trust - iShares MSCI EAFE ETF | 0.00 | 0.00 | 0.35 | 4.52 | 0.1386 | -0.0140 | |||
| IWO / iShares Trust - iShares Russell 2000 Growth ETF | 0.00 | 15.29 | 0.35 | 29.21 | 0.1376 | 0.0150 | |||
| AER / AerCap Holdings N.V. | 0.00 | 35.80 | 0.33 | 40.17 | 0.1311 | 0.0237 | |||
| IWS / iShares Trust - iShares Russell Mid-Cap Value ETF | 0.00 | 19.90 | 0.33 | 26.46 | 0.1299 | 0.0120 | |||
| TMUS / T-Mobile US, Inc. | 0.00 | -8.07 | 0.32 | -7.69 | 0.1295 | -0.0318 | |||
| CAT / Caterpillar Inc. | 0.00 | 0.15 | 0.32 | 23.28 | 0.1288 | 0.0085 | |||
| CSX / CSX Corporation | 0.01 | -2.47 | 0.32 | 6.35 | 0.1270 | -0.0106 | |||
| DIS / The Walt Disney Company | 0.00 | 33.11 | 0.32 | 22.87 | 0.1267 | 0.0081 | |||
| VLO / Valero Energy Corporation | 0.00 | 0.31 | 0.1236 | 0.1236 | |||||
| TXN / Texas Instruments Incorporated | 0.00 | -23.52 | 0.30 | -32.34 | 0.1177 | -0.0823 | |||
| ETR / Entergy Corporation | 0.00 | 0.03 | 0.29 | 12.20 | 0.1138 | -0.0029 | |||
| MBB / iShares Trust - iShares MBS ETF | 0.00 | 9.76 | 0.28 | 11.02 | 0.1127 | -0.0038 | |||
| LIN / Linde plc | 0.00 | -19.73 | 0.28 | -18.71 | 0.1109 | -0.0464 | |||
| KR / The Kroger Co. | 0.00 | 0.02 | 0.28 | -6.10 | 0.1106 | -0.0248 | |||
| PCG / PG&E Corporation | 0.02 | 31.21 | 0.28 | 42.27 | 0.1101 | 0.0209 | |||
| ICE / Intercontinental Exchange, Inc. | 0.00 | -2.85 | 0.28 | -10.71 | 0.1098 | -0.0318 | |||
| ACN / Accenture plc | 0.00 | -0.71 | 0.27 | -18.26 | 0.1093 | -0.0442 | |||
| NEE / NextEra Energy, Inc. | 0.00 | 0.27 | 0.1085 | 0.1085 | |||||
| HTD / John Hancock Tax-Advantaged Dividend Income Fund | 0.01 | 0.00 | 0.27 | 5.93 | 0.1070 | -0.0091 | |||
| IVW / iShares Trust - iShares S&P 500 Growth ETF | 0.00 | 0.00 | 0.27 | 9.47 | 0.1063 | -0.0052 | |||
| SYK / Stryker Corporation | 0.00 | 0.00 | 0.26 | -6.74 | 0.1051 | -0.0243 | |||
| DE / Deere & Company | 0.00 | -0.18 | 0.26 | -10.14 | 0.1027 | -0.0289 | |||
| PSX / Phillips 66 | 0.00 | -0.27 | 0.25 | 13.57 | 0.1004 | -0.0012 | |||
| GRMN / Garmin Ltd. | 0.00 | -8.01 | 0.25 | 8.66 | 0.1003 | -0.0060 | |||
| IYC / iShares Trust - iShares U.S. Consumer Discretionary ETF | 0.00 | 0.00 | 0.25 | 5.02 | 0.1003 | -0.0094 | |||
| APO / Apollo Global Management, Inc. | 0.00 | 0.25 | 0.0990 | 0.0990 | |||||
| IDAI / T Stamp Inc. | 0.07 | 0.25 | 0.0981 | 0.0981 | |||||
| AMD / Advanced Micro Devices, Inc. | 0.00 | 1.07 | 0.24 | 15.09 | 0.0977 | 0.0002 | |||
| VCIT / Vanguard Scottsdale Funds - Vanguard Intermediate-Term Corporate Bond ETF | 0.00 | 6.22 | 0.24 | 7.96 | 0.0974 | -0.0066 | |||
| MU / Micron Technology, Inc. | 0.00 | 0.24 | 0.0963 | 0.0963 | |||||
| HYG / iShares Trust - iShares iBoxx $ High Yield Corporate Bond ETF | 0.00 | 0.24 | 0.0939 | 0.0939 | |||||
| NWSA / News Corporation | 0.01 | 0.23 | 0.0932 | 0.0932 | |||||
| SMIG / ETF Series Solutions - Bahl & Gaynor Small/Mid Cap Income Growth ETF | 0.01 | 0.23 | 0.0931 | 0.0931 | |||||
| ABT / Abbott Laboratories | 0.00 | -2.19 | 0.23 | -3.72 | 0.0930 | -0.0181 | |||
| CMG / Chipotle Mexican Grill, Inc. | 0.01 | 1.93 | 0.23 | -28.84 | 0.0907 | -0.0559 | |||
| FITB / Fifth Third Bancorp | 0.01 | 0.22 | 0.0896 | 0.0896 | |||||
| RTX / RTX Corporation | 0.00 | 0.22 | 0.0892 | 0.0892 | |||||
| KGS / Kodiak Gas Services, Inc. | 0.01 | 0.22 | 0.0885 | 0.0885 | |||||
| GE / General Electric Company | 0.00 | 0.22 | 0.0878 | 0.0878 | |||||
| LNG / Cheniere Energy, Inc. | 0.00 | -9.85 | 0.22 | -12.96 | 0.0857 | -0.0276 | |||
| GOOG / Alphabet Inc. | 0.00 | 0.21 | 0.0848 | 0.0848 | |||||
| UBER / Uber Technologies, Inc. | 0.00 | -1.81 | 0.21 | 2.91 | 0.0848 | -0.0098 | |||
| VCLT / Vanguard Scottsdale Funds - Vanguard Long-Term Corporate Bond ETF | 0.00 | 1.45 | 0.21 | 3.92 | 0.0847 | -0.0092 | |||
| VICI / VICI Properties Inc. | 0.01 | 0.21 | 0.0847 | 0.0847 | |||||
| ODFL / Old Dominion Freight Line, Inc. | 0.00 | 0.21 | 0.0841 | 0.0841 | |||||
| CSCO / Cisco Systems, Inc. | 0.00 | -15.53 | 0.21 | -16.73 | 0.0834 | -0.0318 | |||
| DUK / Duke Energy Corporation | 0.00 | 0.21 | 0.0827 | 0.0827 | |||||
| MDT / Medtronic plc | 0.00 | -8.14 | 0.20 | 0.00 | 0.0801 | -0.0117 | |||
| AESI / Atlas Energy Solutions Inc. | 0.02 | 0.18 | 0.0708 | 0.0708 | |||||
| NPWR / NET Power Inc. | 0.05 | 91.77 | 0.15 | 133.33 | 0.0617 | 0.0313 | |||
| AIRJ / AirJoule Technologies Corporation | 0.03 | 0.14 | 0.0561 | 0.0561 | |||||
| WETH / Wetouch Technology Inc. | 0.11 | 15.90 | 0.14 | 52.81 | 0.0545 | 0.0134 | |||
| JPC / Nuveen Preferred & Income Opportunities Fund | 0.02 | 0.00 | 0.12 | 2.50 | 0.0493 | -0.0062 | |||
| PRTS / CarParts.com, Inc. | 0.05 | 0.04 | 0.0142 | 0.0142 | |||||
| MSCI / MSCI Inc. | 0.00 | -100.00 | 0.00 | 0.0000 | |||||
| MO / Altria Group, Inc. | 0.00 | -100.00 | 0.00 | -100.00 | -0.1117 | ||||
| PFF / iShares Trust - iShares Preferred and Income Securities ETF | 0.00 | -100.00 | 0.00 | 0.0000 | |||||
| TAP.A / Molson Coors Beverage Company | 0.00 | -100.00 | 0.00 | 0.0000 | |||||
| KVUE / Kenvue Inc. | 0.00 | -100.00 | 0.00 | 0.0000 | |||||
| DKNG / DraftKings Inc. | 0.00 | -100.00 | 0.00 | -100.00 | -0.1005 | ||||
| SOGP / Sound Group Inc. - Depositary Receipt (Common Stock) | 0.00 | -100.00 | 0.00 | 0.0000 |