Estatísticas Básicas
| Valor do Portfólio | $ 209,331,065 |
| Posições Atuais | 112 |
Últimas Participações, Desempenho, AUM (de 13F, 13D)
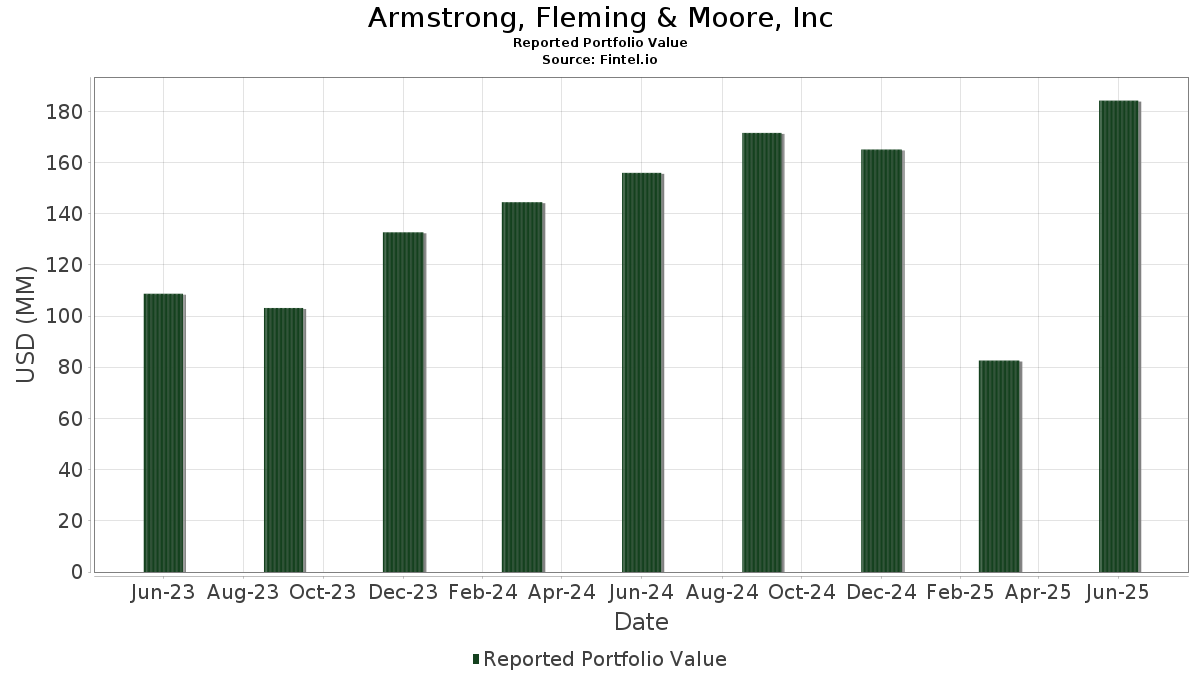
Armstrong, Fleming & Moore, Inc divulgou 112 participações totais em seus últimos arquivamentos da SEC. O valor mais recente da carteira é calculado como $ 209,331,065 USD. O Ativo Total Sob Gestão (AUM) é esse valor mais o caixa (que não é divulgado). As principais posições de Armstrong, Fleming & Moore, Inc são T. Rowe Price Exchange-Traded Funds, Inc. - T. Rowe Price Blue Chip Growth ETF (US:TCHP) , Apple Inc. (US:AAPL) , Capital Group International Focus Equity ETF (US:CGXU) , CAVA Group, Inc. (US:CAVA) , and American Century ETF Trust - Avantis Emerging Markets Equity ETF (US:AVEM) . As novas posições de Armstrong, Fleming & Moore, Inc incluem American Century ETF Trust - Avantis Emerging Markets Equity ETF (US:AVEM) , World Gold Trust - SPDR Gold MiniShares Trust (US:GLDM) , O'Reilly Automotive, Inc. (US:ORLY) , American Tower Corporation (US:AMT) , and Deere & Company (US:DE) .
Maiores Aumentos Este Trimestre
Usamos a mudança na alocação do portfólio porque esta é a métrica mais significativa. As mudanças podem ser devido a operações ou mudanças nos preços das ações.
| Ativo | Ações (MM) |
Valor (MM$) |
% do Portfólio | Δ% do Portfólio |
|---|---|---|---|---|
| AVEM / American Century ETF Trust - Avantis Emerging Markets Equity ETF | 0.20 | 15.14 | 7.2341 | 7.2341 |
| CGNG / Capital Group New Geography Equity ETF | 0.08 | 2.58 | 1.2327 | 0.9925 |
| AAPL / Apple Inc. | 0.09 | 22.83 | 10.9059 | 0.8778 |
| CGDV / Capital Group Dividend Value ETF | 0.21 | 8.62 | 4.1181 | 0.3325 |
| TCHP / T. Rowe Price Exchange-Traded Funds, Inc. - T. Rowe Price Blue Chip Growth ETF | 0.48 | 23.24 | 11.1038 | 0.3210 |
| MA / Mastercard Incorporated | 0.00 | 1.10 | 0.5245 | 0.2940 |
| PLTR / Palantir Technologies Inc. | 0.02 | 3.85 | 1.8409 | 0.2772 |
| TSLA / Tesla, Inc. | 0.01 | 2.52 | 1.2016 | 0.2215 |
| GOOGL / Alphabet Inc. | 0.01 | 1.74 | 0.8332 | 0.1467 |
| GLDM / World Gold Trust - SPDR Gold MiniShares Trust | 0.00 | 0.27 | 0.1300 | 0.1300 |
Maiores Diminuições Este Trimestre
Usamos a mudança na alocação do portfólio porque esta é a métrica mais significativa. As mudanças podem ser devido a operações ou mudanças nos preços das ações.
| Ativo | Ações (MM) |
Valor (MM$) |
% do Portfólio | Δ% do Portfólio |
|---|---|---|---|---|
| CAVA / CAVA Group, Inc. | 0.36 | 21.91 | 10.4672 | -5.9822 |
| SAIC / Science Applications International Corporation | 0.03 | 3.21 | 1.5350 | -0.7662 |
| COST / Costco Wholesale Corporation | 0.00 | 3.57 | 1.7070 | -0.4192 |
| MAR / Marriott International, Inc. | 0.01 | 3.37 | 1.6110 | -0.3145 |
| JPM / JPMorgan Chase & Co. | 0.01 | 2.80 | 1.3390 | -0.3009 |
| CHTR / Charter Communications, Inc. | 0.00 | 0.64 | 0.3054 | -0.2105 |
| GJR / Strats Trust For Procter & Gambel Security - Preferred Security | 0.01 | 1.81 | 0.8649 | -0.1636 |
| NFLX / Netflix, Inc. | 0.00 | 1.20 | 0.5756 | -0.1574 |
| MSFT / Microsoft Corporation | 0.00 | 2.20 | 1.0532 | -0.1406 |
| IBM / International Business Machines Corporation | 0.01 | 1.51 | 0.7222 | -0.1354 |
Arquivamentos 13F e Fundo
Este formulário foi arquivado em 2025-10-20 para o período de relatório 2025-09-30. Clique no ícone de link para ver o histórico completo da transação.
Atualize para desbloquear dados premium e exportar para Excel ![]() .
.
| Ativo | Tipo | Preço Médio por Ação | Ações (MM) |
ΔAções (%) |
Valor ($MM) |
ΔAções (%) |
Portfólio (%) |
ΔPortfólio (%) |
|
|---|---|---|---|---|---|---|---|---|---|
| TCHP / T. Rowe Price Exchange-Traded Funds, Inc. - T. Rowe Price Blue Chip Growth ETF | 0.48 | 8.60 | 23.24 | 17.05 | 11.1038 | 0.3210 | |||
| AAPL / Apple Inc. | 0.09 | -0.39 | 22.83 | 23.62 | 10.9059 | 0.8778 | |||
| CGXU / Capital Group International Focus Equity ETF | 0.76 | 5.04 | 22.48 | 14.68 | 10.7401 | 0.0950 | |||
| CAVA / CAVA Group, Inc. | 0.36 | 0.85 | 21.91 | -27.67 | 10.4672 | -5.9822 | |||
| AVEM / American Century ETF Trust - Avantis Emerging Markets Equity ETF | 0.20 | 15.14 | 7.2341 | 7.2341 | |||||
| CGDV / Capital Group Dividend Value ETF | 0.21 | 16.18 | 8.62 | 23.66 | 4.1181 | 0.3325 | |||
| NVDA / NVIDIA Corporation | 0.02 | 0.55 | 4.37 | 18.74 | 2.0857 | 0.0892 | |||
| PLTR / Palantir Technologies Inc. | 0.02 | 0.00 | 3.85 | 33.83 | 1.8409 | 0.2772 | |||
| COST / Costco Wholesale Corporation | 0.00 | -2.40 | 3.57 | -8.74 | 1.7070 | -0.4192 | |||
| MAR / Marriott International, Inc. | 0.01 | -0.24 | 3.37 | -4.88 | 1.6110 | -0.3145 | |||
| SAIC / Science Applications International Corporation | 0.03 | -14.08 | 3.21 | -24.17 | 1.5350 | -0.7662 | |||
| BRK.B / Berkshire Hathaway Inc. | 0.01 | 0.64 | 2.91 | 4.18 | 1.3923 | -0.1270 | |||
| JPM / JPMorgan Chase & Co. | 0.01 | -14.70 | 2.80 | -7.22 | 1.3390 | -0.3009 | |||
| CGNG / Capital Group New Geography Equity ETF | 0.08 | 443.87 | 2.58 | 483.71 | 1.2327 | 0.9925 | |||
| TSLA / Tesla, Inc. | 0.01 | -0.46 | 2.52 | 39.41 | 1.2016 | 0.2215 | |||
| XOM / Exxon Mobil Corporation | 0.02 | 0.06 | 2.39 | 4.68 | 1.1438 | -0.0985 | |||
| JNJ / Johnson & Johnson | 0.01 | -0.12 | 2.33 | 21.28 | 1.1137 | 0.0696 | |||
| MSFT / Microsoft Corporation | 0.00 | -3.69 | 2.20 | 0.27 | 1.0532 | -0.1406 | |||
| CGGR / Capital Group Growth ETF | 0.05 | -1.17 | 2.19 | 6.78 | 1.0453 | -0.0675 | |||
| CVX / Chevron Corporation | 0.01 | 0.00 | 1.98 | 8.48 | 0.9470 | -0.0456 | |||
| AMZN / Amazon.com, Inc. | 0.01 | 1.47 | 1.86 | 1.58 | 0.8882 | -0.1059 | |||
| GJR / Strats Trust For Procter & Gambel Security - Preferred Security | 0.01 | -0.88 | 1.81 | -4.44 | 0.8649 | -0.1636 | |||
| GOOGL / Alphabet Inc. | 0.01 | 0.01 | 1.74 | 37.97 | 0.8332 | 0.1467 | |||
| CGUS / Capital Group Core Equity ETF | 0.04 | -0.79 | 1.66 | 6.19 | 0.7954 | -0.0557 | |||
| IBM / International Business Machines Corporation | 0.01 | 0.00 | 1.51 | -4.31 | 0.7222 | -0.1354 | |||
| CGGO / Capital Group Global Growth Equity ETF | 0.04 | -2.52 | 1.45 | 4.23 | 0.6947 | -0.0632 | |||
| GE / General Electric Company | 0.00 | 1.66 | 1.44 | 18.81 | 0.6882 | 0.0298 | |||
| CGMU / Capital Group Fixed Income ETF Trust - Capital Group Municipal Income ETF | 0.05 | 6.06 | 1.40 | 8.47 | 0.6672 | -0.0321 | |||
| IWO / iShares Trust - iShares Russell 2000 Growth ETF | 0.00 | 0.05 | 1.38 | 12.05 | 0.6573 | -0.0098 | |||
| GPRK / GeoPark Limited | 0.22 | 3.93 | 1.37 | 1.48 | 0.6553 | -0.0783 | |||
| UNP / Union Pacific Corporation | 0.01 | 0.00 | 1.26 | 2.76 | 0.6039 | -0.0643 | |||
| NFLX / Netflix, Inc. | 0.00 | -0.30 | 1.20 | -10.75 | 0.5756 | -0.1574 | |||
| MA / Mastercard Incorporated | 0.00 | 155.63 | 1.10 | 158.73 | 0.5245 | 0.2940 | |||
| GOOG / Alphabet Inc. | 0.00 | 0.00 | 1.07 | 37.31 | 0.5119 | 0.0881 | |||
| EMR / Emerson Electric Co. | 0.01 | -1.79 | 1.05 | -3.41 | 0.5006 | -0.0883 | |||
| IWF / iShares Trust - iShares Russell 1000 Growth ETF | 0.00 | 2.02 | 1.02 | 12.65 | 0.4849 | -0.0048 | |||
| FMBH / First Mid Bancshares, Inc. | 0.02 | 0.00 | 0.94 | 1.07 | 0.4511 | -0.0564 | |||
| T / AT&T Inc. | 0.03 | -2.79 | 0.91 | -5.20 | 0.4357 | -0.0864 | |||
| HON / Honeywell International Inc. | 0.00 | 0.63 | 0.91 | -9.03 | 0.4336 | -0.1083 | |||
| VZ / Verizon Communications Inc. | 0.02 | -0.94 | 0.91 | 0.67 | 0.4334 | -0.0562 | |||
| O / Realty Income Corporation | 0.01 | -5.56 | 0.89 | -0.34 | 0.4264 | -0.0599 | |||
| DIS / The Walt Disney Company | 0.01 | 0.46 | 0.83 | -7.20 | 0.3943 | -0.0889 | |||
| GEV / GE Vernova Inc. | 0.00 | 0.08 | 0.78 | 16.20 | 0.3739 | 0.0083 | |||
| PEP / PepsiCo, Inc. | 0.01 | 0.00 | 0.76 | 6.28 | 0.3643 | -0.0250 | |||
| BRK.A / Berkshire Hathaway Inc. | 0.00 | 0.00 | 0.75 | 3.57 | 0.3603 | -0.0354 | |||
| ABBV / AbbVie Inc. | 0.00 | 0.00 | 0.69 | 24.73 | 0.3302 | 0.0293 | |||
| LLY / Eli Lilly and Company | 0.00 | 18.52 | 0.68 | 16.13 | 0.3268 | 0.0066 | |||
| CSCO / Cisco Systems, Inc. | 0.01 | 0.01 | 0.67 | -1.32 | 0.3206 | -0.0489 | |||
| IEFA / iShares Trust - iShares Core MSCI EAFE ETF | 0.01 | -3.34 | 0.67 | 1.06 | 0.3186 | -0.0396 | |||
| MRK / Merck & Co., Inc. | 0.01 | 0.00 | 0.67 | 6.05 | 0.3183 | -0.0229 | |||
| CGBL / Capital Group Core Balanced ETF | 0.02 | 18.36 | 0.65 | 22.93 | 0.3125 | 0.0234 | |||
| CHTR / Charter Communications, Inc. | 0.00 | 0.00 | 0.64 | -32.74 | 0.3054 | -0.2105 | |||
| JEPI / J.P. Morgan Exchange-Traded Fund Trust - JPMorgan Equity Premium Income ETF | 0.01 | 0.00 | 0.62 | 0.48 | 0.2978 | -0.0392 | |||
| PNC / The PNC Financial Services Group, Inc. | 0.00 | 0.00 | 0.59 | 7.80 | 0.2838 | -0.0155 | |||
| AOM / iShares Trust - iShares Core 40/60 Moderate Allocation ETF | 0.01 | 0.00 | 0.57 | 3.25 | 0.2737 | -0.0273 | |||
| CAT / Caterpillar Inc. | 0.00 | 0.00 | 0.57 | 23.09 | 0.2700 | 0.0204 | |||
| KO / The Coca-Cola Company | 0.01 | 0.00 | 0.56 | -6.19 | 0.2681 | -0.0570 | |||
| APD / Air Products and Chemicals, Inc. | 0.00 | 0.00 | 0.55 | -3.35 | 0.2621 | -0.0460 | |||
| CGIC / Capital Group International Core Equity ETF | 0.02 | 66.62 | 0.50 | 76.14 | 0.2402 | 0.0854 | |||
| WPC / W. P. Carey Inc. | 0.01 | -8.72 | 0.50 | -1.19 | 0.2391 | -0.0358 | |||
| IAU / iShares Gold Trust | 0.01 | 0.00 | 0.50 | 16.71 | 0.2371 | 0.0061 | |||
| RTX / RTX Corporation | 0.00 | 0.00 | 0.49 | 14.65 | 0.2358 | 0.0019 | |||
| LMT / Lockheed Martin Corporation | 0.00 | 102.88 | 0.49 | 118.67 | 0.2351 | 0.1129 | |||
| AMP / Ameriprise Financial, Inc. | 0.00 | 0.00 | 0.49 | -7.88 | 0.2347 | -0.0551 | |||
| BX / Blackstone Inc. | 0.00 | 2.00 | 0.49 | 16.47 | 0.2332 | 0.0056 | |||
| NEE / NextEra Energy, Inc. | 0.01 | 0.41 | 0.48 | 9.11 | 0.2291 | -0.0094 | |||
| COIN / Coinbase Global, Inc. | 0.00 | 36.46 | 0.43 | 31.71 | 0.2064 | 0.0280 | |||
| IVE / iShares Trust - iShares S&P 500 Value ETF | 0.00 | 0.00 | 0.42 | 5.50 | 0.2019 | -0.0153 | |||
| IQV / IQVIA Holdings Inc. | 0.00 | 0.00 | 0.41 | 20.41 | 0.1975 | 0.0112 | |||
| MMM / 3M Company | 0.00 | 0.00 | 0.41 | 1.74 | 0.1958 | -0.0225 | |||
| ASML / ASML Holding N.V. - Depositary Receipt (Common Stock) | 0.00 | 1.02 | 0.39 | 22.22 | 0.1841 | 0.0126 | |||
| SO / The Southern Company | 0.00 | 0.00 | 0.37 | 3.09 | 0.1756 | -0.0178 | |||
| BMY / Bristol-Myers Squibb Company | 0.01 | -0.40 | 0.36 | -2.95 | 0.1730 | -0.0296 | |||
| HD / The Home Depot, Inc. | 0.00 | 0.11 | 0.36 | 10.49 | 0.1713 | -0.0046 | |||
| BUFR / First Trust Exchange-Traded Fund VIII - FT Vest Laddered Buffer ETF | 0.01 | 0.00 | 0.35 | 5.06 | 0.1688 | -0.0138 | |||
| WMT / Walmart Inc. | 0.00 | 1.50 | 0.35 | 6.75 | 0.1667 | -0.0104 | |||
| IVW / iShares Trust - iShares S&P 500 Growth ETF | 0.00 | 0.00 | 0.34 | 9.62 | 0.1635 | -0.0060 | |||
| CSX / CSX Corporation | 0.01 | 0.00 | 0.34 | 8.60 | 0.1634 | -0.0073 | |||
| NVO / Novo Nordisk A/S - Depositary Receipt (Common Stock) | 0.01 | 15.19 | 0.34 | -7.38 | 0.1620 | -0.0368 | |||
| META / Meta Platforms, Inc. | 0.00 | 4.88 | 0.32 | 4.30 | 0.1509 | -0.0135 | |||
| GIS / General Mills, Inc. | 0.01 | 0.00 | 0.30 | -2.59 | 0.1441 | -0.0242 | |||
| MTB / M&T Bank Corporation | 0.00 | 0.00 | 0.29 | 1.74 | 0.1398 | -0.0162 | |||
| Z / Zillow Group, Inc. | 0.00 | 0.00 | 0.29 | 10.31 | 0.1382 | -0.0046 | |||
| SCZ / iShares Trust - iShares MSCI EAFE Small-Cap ETF | 0.00 | 0.00 | 0.29 | 5.49 | 0.1378 | -0.0106 | |||
| GLDM / World Gold Trust - SPDR Gold MiniShares Trust | 0.00 | 0.27 | 0.1300 | 0.1300 | |||||
| V / Visa Inc. | 0.00 | -3.66 | 0.26 | -7.47 | 0.1246 | -0.0283 | |||
| ORLY / O'Reilly Automotive, Inc. | 0.00 | 0.26 | 0.1232 | 0.1232 | |||||
| ACN / Accenture plc | 0.00 | 0.48 | 0.26 | -17.15 | 0.1225 | -0.0454 | |||
| MCD / McDonald's Corporation | 0.00 | 0.00 | 0.25 | 4.13 | 0.1205 | -0.0112 | |||
| AMT / American Tower Corporation | 0.00 | 0.25 | 0.1204 | 0.1204 | |||||
| PFE / Pfizer Inc. | 0.01 | 0.00 | 0.25 | 5.46 | 0.1200 | -0.0098 | |||
| ESGE / iShares, Inc. - iShares ESG Aware MSCI EM ETF | 0.01 | 0.00 | 0.25 | 10.67 | 0.1192 | -0.0030 | |||
| D / Dominion Energy, Inc. | 0.00 | 8.33 | 0.25 | 17.54 | 0.1185 | 0.0036 | |||
| DE / Deere & Company | 0.00 | 0.25 | 0.1181 | 0.1181 | |||||
| DUK / Duke Energy Corporation | 0.00 | 0.00 | 0.25 | 5.15 | 0.1171 | -0.0098 | |||
| CL / Colgate-Palmolive Company | 0.00 | 0.00 | 0.24 | -11.85 | 0.1137 | -0.0333 | |||
| GMAY / First Trust Exchange-Traded Fund VIII - FT Vest U.S. Equity Moderate Buffer ETF - May | 0.01 | 0.00 | 0.24 | 3.51 | 0.1129 | -0.0113 | |||
| CBRE / CBRE Group, Inc. | 0.00 | 0.00 | 0.23 | 12.62 | 0.1112 | -0.0012 | |||
| USB / U.S. Bancorp | 0.00 | 0.00 | 0.23 | 6.91 | 0.1111 | -0.0071 | |||
| ORCL / Oracle Corporation | 0.00 | 0.23 | 0.1105 | 0.1105 | |||||
| CGGE / Capital Group Global Equity ETF | 0.01 | 0.00 | 0.22 | 5.83 | 0.1043 | -0.0081 | |||
| WBD / Warner Bros. Discovery, Inc. | 0.01 | -29.57 | 0.22 | 20.44 | 0.1042 | 0.0055 | |||
| USXF / iShares Trust - iShares ESG Advanced MSCI USA ETF | 0.00 | 0.22 | 0.1035 | 0.1035 | |||||
| IWD / iShares Trust - iShares Russell 1000 Value ETF | 0.00 | 0.22 | 0.1028 | 0.1028 | |||||
| IJT / iShares Trust - iShares S&P Small-Cap 600 Growth ETF | 0.00 | 0.00 | 0.21 | 6.00 | 0.1017 | -0.0070 | |||
| AZN / AstraZeneca PLC - Depositary Receipt (Common Stock) | 0.00 | 0.21 | 0.1014 | 0.1014 | |||||
| ED / Consolidated Edison, Inc. | 0.00 | 0.00 | 0.21 | 0.00 | 0.1003 | -0.0135 | |||
| CRM / Salesforce, Inc. | 0.00 | -4.88 | 0.20 | -17.55 | 0.0970 | -0.0365 | |||
| CGCB / Capital Group Fixed Income ETF Trust - Capital Group Core Bond ETF | 0.01 | 0.20 | 0.0964 | 0.0964 | |||||
| GLW / Corning Incorporated | 0.00 | 0.20 | 0.0960 | 0.0960 | |||||
| ESGD / iShares Trust - iShares ESG Aware MSCI EAFE ETF | 0.00 | 0.20 | 0.0955 | 0.0955 | |||||
| LUMN / Lumen Technologies, Inc. | 0.01 | 0.07 | 0.0322 | 0.0322 | |||||
| PPG / PPG Industries, Inc. | 0.00 | -100.00 | 0.00 | -100.00 | -0.1138 | ||||
| EFG / iShares Trust - iShares MSCI EAFE Growth ETF | 0.00 | -100.00 | 0.00 | 0.0000 | |||||
| CARR / Carrier Global Corporation | 0.00 | -100.00 | 0.00 | 0.0000 | |||||
| IEMG / iShares, Inc. - iShares Core MSCI Emerging Markets ETF | 0.00 | -100.00 | 0.00 | 0.0000 | |||||
| DRI / Darden Restaurants, Inc. | 0.00 | -100.00 | 0.00 | 0.0000 | |||||
| CTVA / Corteva, Inc. | 0.00 | -100.00 | 0.00 | 0.0000 | |||||
| FRT / Federal Realty Investment Trust | 0.00 | -100.00 | 0.00 | 0.0000 |