Estatísticas Básicas
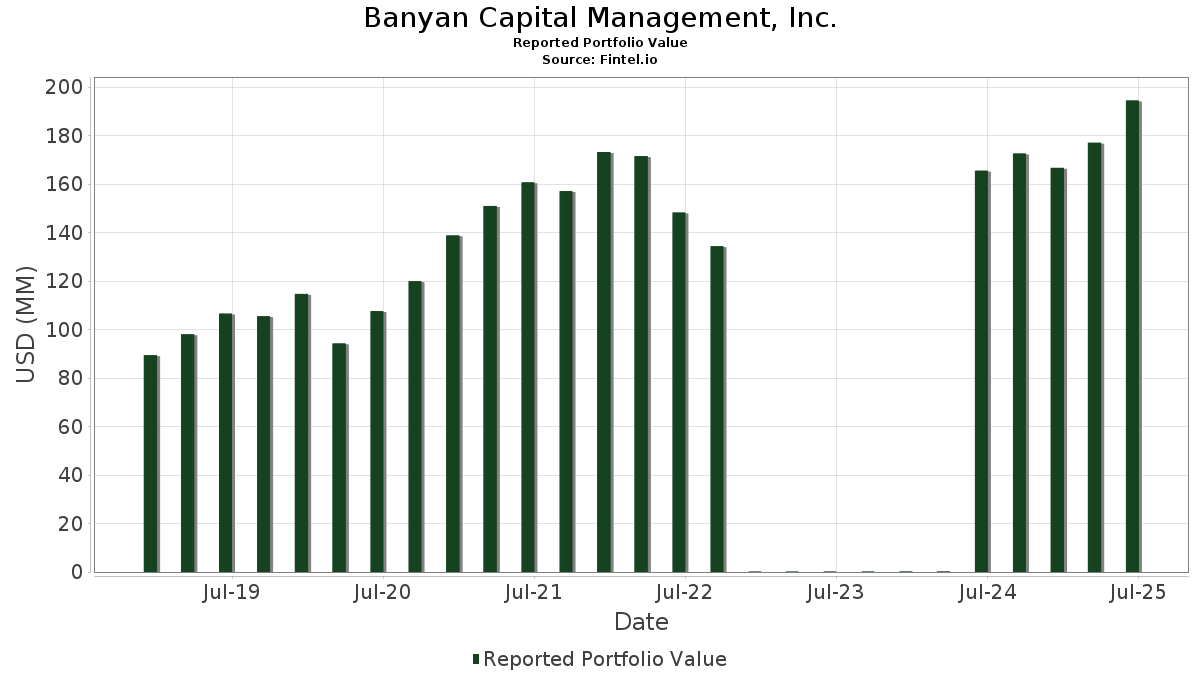
| Valor do Portfólio | $ 220,183,683 |
| Posições Atuais | 56 |
Últimas Participações, Desempenho, AUM (de 13F, 13D)
Banyan Capital Management, Inc. divulgou 56 participações totais em seus últimos arquivamentos da SEC. O valor mais recente da carteira é calculado como $ 220,183,683 USD. O Ativo Total Sob Gestão (AUM) é esse valor mais o caixa (que não é divulgado). As principais posições de Banyan Capital Management, Inc. são Berkshire Hathaway Inc. (US:BRK.B) , Markel Group Inc. (US:MKL) , Vontier Corporation (US:VNT) , The Cigna Group (US:CI) , and Parker-Hannifin Corporation (US:PH) . As novas posições de Banyan Capital Management, Inc. incluem McDonald's Corporation (US:MCD) , AbbVie Inc. (US:ABBV) , NVIDIA Corporation (US:NVDA) , Chevron Corporation (US:CVX) , and W.W. Grainger, Inc. (US:GWW) .
Maiores Aumentos Este Trimestre
Usamos a mudança na alocação do portfólio porque esta é a métrica mais significativa. As mudanças podem ser devido a operações ou mudanças nos preços das ações.
| Ativo | Ações (MM) |
Valor (MM$) |
% do Portfólio | Δ% do Portfólio |
|---|---|---|---|---|
| PHIN / PHINIA Inc. | 0.26 | 15.00 | 6.8140 | 1.0293 |
| AAPL / Apple Inc. | 0.04 | 11.34 | 5.1516 | 0.7380 |
| IBM / International Business Machines Corporation | 0.00 | 1.21 | 0.5480 | 0.5480 |
| MCD / McDonald's Corporation | 0.00 | 0.77 | 0.3518 | 0.3518 |
| WMT / Walmart Inc. | 0.01 | 1.04 | 0.4744 | 0.3318 |
| ABBV / AbbVie Inc. | 0.00 | 0.72 | 0.3280 | 0.3280 |
| JNJ / Johnson & Johnson | 0.00 | 0.71 | 0.3245 | 0.3245 |
| NVDA / NVIDIA Corporation | 0.00 | 0.70 | 0.3181 | 0.3181 |
| CVX / Chevron Corporation | 0.00 | 0.67 | 0.3031 | 0.3031 |
| GWW / W.W. Grainger, Inc. | 0.00 | 0.66 | 0.3008 | 0.3008 |
Maiores Diminuições Este Trimestre
Usamos a mudança na alocação do portfólio porque esta é a métrica mais significativa. As mudanças podem ser devido a operações ou mudanças nos preços das ações.
| Ativo | Ações (MM) |
Valor (MM$) |
% do Portfólio | Δ% do Portfólio |
|---|---|---|---|---|
| 0HW4 / Charter Communications, Inc. | 0.04 | 10.64 | 4.8334 | -2.3427 |
| CI / The Cigna Group | 0.06 | 17.33 | 7.8697 | -1.5655 |
| KMX / CarMax, Inc. | 0.18 | 7.98 | 3.6247 | -1.2423 |
| MKL / Markel Group Inc. | 0.01 | 21.71 | 9.8587 | -1.2254 |
| BRK.B / Berkshire Hathaway Inc. | 0.04 | 22.02 | 10.0003 | -0.8179 |
| DG / Dollar General Corporation | 0.12 | 12.25 | 5.5617 | -0.7956 |
| HSIC / Henry Schein, Inc. | 0.14 | 9.23 | 4.1941 | -0.6107 |
| HEIO / Heineken Holding N.V. | 0.14 | 9.45 | 4.2936 | -0.5742 |
| PH / Parker-Hannifin Corporation | 0.02 | 15.63 | 7.0990 | -0.4593 |
| AXP / American Express Company | 0.01 | 4.10 | 1.8602 | -0.3426 |
Arquivamentos 13F e Fundo
Este formulário foi arquivado em 2025-11-03 para o período de relatório 2025-09-30. Clique no ícone de link para ver o histórico completo da transação.
Atualize para desbloquear dados premium e exportar para Excel ![]() .
.
| Ativo | Tipo | Preço Médio por Ação | Ações (MM) |
ΔAções (%) |
Valor ($MM) |
ΔAções (%) |
Portfólio (%) |
ΔPortfólio (%) |
|
|---|---|---|---|---|---|---|---|---|---|
| BRK.B / Berkshire Hathaway Inc. | 0.04 | 1.13 | 22.02 | 4.66 | 10.0003 | -0.8179 | |||
| MKL / Markel Group Inc. | 0.01 | 5.24 | 21.71 | 0.71 | 9.8587 | -1.2254 | |||
| VNT / Vontier Corporation | 0.43 | 2.63 | 18.09 | 16.73 | 8.2165 | 0.2467 | |||
| CI / The Cigna Group | 0.06 | 8.36 | 17.33 | -5.56 | 7.8697 | -1.5655 | |||
| PH / Parker-Hannifin Corporation | 0.02 | -2.03 | 15.63 | 6.34 | 7.0990 | -0.4593 | |||
| PHIN / PHINIA Inc. | 0.26 | 3.23 | 15.00 | 33.37 | 6.8140 | 1.0293 | |||
| DG / Dollar General Corporation | 0.12 | 9.62 | 12.25 | -0.95 | 5.5617 | -0.7956 | |||
| LH / Labcorp Holdings Inc. | 0.04 | 3.17 | 11.59 | 12.82 | 5.2650 | -0.0188 | |||
| AAPL / Apple Inc. | 0.04 | 6.48 | 11.34 | 32.16 | 5.1516 | 0.7380 | |||
| 0HW4 / Charter Communications, Inc. | 0.04 | 13.32 | 10.64 | -23.74 | 4.8334 | -2.3427 | |||
| HEIO / Heineken Holding N.V. | 0.14 | 8.76 | 9.45 | -0.14 | 4.2936 | -0.5742 | |||
| HSIC / Henry Schein, Inc. | 0.14 | 8.78 | 9.23 | -1.17 | 4.1941 | -0.6107 | |||
| KMX / CarMax, Inc. | 0.18 | 26.30 | 7.98 | -15.67 | 3.6247 | -1.2423 | |||
| BFB / Brown-Forman Corp. - Class B | 0.19 | 16.06 | 5.19 | 16.78 | 2.3553 | 0.0721 | |||
| ABNB / Airbnb, Inc. | 0.04 | 7.10 | 4.72 | -1.79 | 2.1446 | -0.3278 | |||
| DHR / Danaher Corporation | 0.02 | -0.21 | 4.54 | 0.15 | 2.0631 | -0.2692 | |||
| AXP / American Express Company | 0.01 | -8.18 | 4.10 | -4.39 | 1.8602 | -0.3426 | |||
| IBM / International Business Machines Corporation | 0.00 | 1.21 | 0.5480 | 0.5480 | |||||
| WMT / Walmart Inc. | 0.01 | 257.50 | 1.04 | 276.90 | 0.4744 | 0.3318 | |||
| MCD / McDonald's Corporation | 0.00 | 0.77 | 0.3518 | 0.3518 | |||||
| ABBV / AbbVie Inc. | 0.00 | 0.72 | 0.3280 | 0.3280 | |||||
| JNJ / Johnson & Johnson | 0.00 | 0.71 | 0.3245 | 0.3245 | |||||
| NVDA / NVIDIA Corporation | 0.00 | 0.70 | 0.3181 | 0.3181 | |||||
| CVX / Chevron Corporation | 0.00 | 0.67 | 0.3031 | 0.3031 | |||||
| GWW / W.W. Grainger, Inc. | 0.00 | 0.66 | 0.3008 | 0.3008 | |||||
| JPM / JPMorgan Chase & Co. | 0.00 | 0.61 | 0.2751 | 0.2751 | |||||
| NEM / Newmont Corporation | 0.01 | 0.59 | 0.2700 | 0.2700 | |||||
| XOM / Exxon Mobil Corporation | 0.01 | 0.59 | 0.2675 | 0.2675 | |||||
| PRGD / The Procter & Gamble Company | 0.00 | 0.58 | 0.2618 | 0.2618 | |||||
| LLY / Eli Lilly and Company | 0.00 | 0.57 | 0.2599 | 0.2599 | |||||
| GOLD / Gold.com, Inc. | 0.02 | 0.57 | 0.2575 | 0.2575 | |||||
| EMR / Emerson Electric Co. | 0.00 | 0.55 | 0.2475 | 0.2475 | |||||
| MRK / Merck & Co., Inc. | 0.01 | 0.54 | 0.2435 | 0.2435 | |||||
| ALL / The Allstate Corporation | 0.00 | 0.53 | 0.2392 | 0.2392 | |||||
| KO / The Coca-Cola Company | 0.01 | 0.52 | 0.2352 | 0.2352 | |||||
| WPM / Wheaton Precious Metals Corp. | 0.00 | 0.48 | 0.2197 | 0.2197 | |||||
| TXN / Texas Instruments Incorporated | 0.00 | 0.46 | 0.2103 | 0.2103 | |||||
| GLD / SPDR Gold Shares | 0.00 | 0.44 | 0.2018 | 0.2018 | |||||
| CAT / Caterpillar Inc. | 0.00 | 0.43 | 0.1940 | 0.1940 | |||||
| SO / The Southern Company | 0.00 | 0.41 | 0.1862 | 0.1862 | |||||
| DFAC / Dimensional ETF Trust - Dimensional U.S. Core Equity 2 ETF | 0.01 | 0.39 | 0.1774 | 0.1774 | |||||
| MET / MetLife, Inc. | 0.00 | 0.39 | 0.1768 | 0.1768 | |||||
| MSFT / Microsoft Corporation | 0.00 | 0.38 | 0.1729 | 0.1729 | |||||
| SHEL / Shell plc - Depositary Receipt (Common Stock) | 0.01 | 0.36 | 0.1657 | 0.1657 | |||||
| RTX / RTX Corporation | 0.00 | 0.36 | 0.1645 | 0.1645 | |||||
| MMM / 3M Company | 0.00 | 0.36 | 0.1619 | 0.1619 | |||||
| PSX / Phillips 66 | 0.00 | 0.35 | 0.1603 | 0.1603 | |||||
| DD / DuPont de Nemours, Inc. | 0.00 | 0.33 | 0.1480 | 0.1480 | |||||
| DUK / Duke Energy Corporation | 0.00 | 0.32 | 0.1471 | 0.1471 | |||||
| VLTO / Veralto Corporation | 0.00 | 0.00 | 0.30 | 5.65 | 0.1362 | -0.0098 | |||
| BAC / Bank of America Corporation | 0.01 | 0.29 | 0.1318 | 0.1318 | |||||
| CSCO / Cisco Systems, Inc. | 0.00 | 0.26 | 0.1175 | 0.1175 | |||||
| OKE / ONEOK, Inc. | 0.00 | 0.26 | 0.1160 | 0.1160 | |||||
| KMI / Kinder Morgan, Inc. | 0.01 | 0.24 | 0.1092 | 0.1092 | |||||
| LEU / Centrus Energy Corp. | 0.00 | 0.22 | 0.0986 | 0.0986 | |||||
| ITOT / iShares Trust - iShares Core S&P Total U.S. Stock Market ETF | 0.00 | 0.20 | 0.0929 | 0.0929 |