Estatísticas Básicas
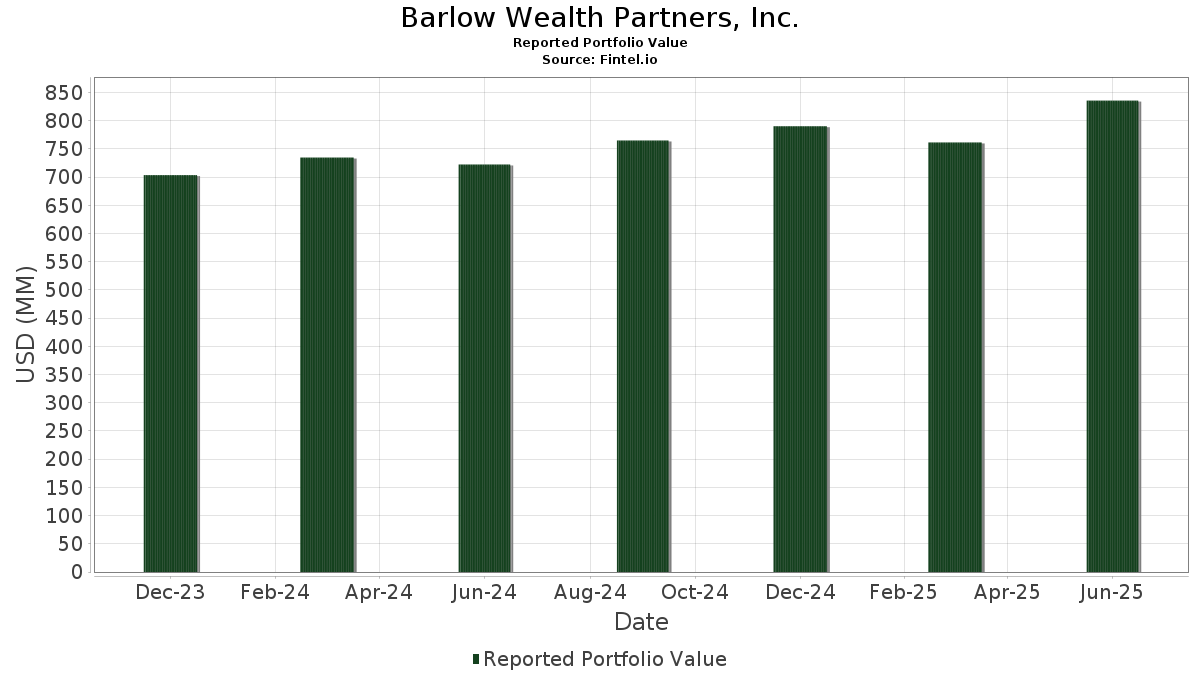
| Valor do Portfólio | $ 926,520,128 |
| Posições Atuais | 135 |
Últimas Participações, Desempenho, AUM (de 13F, 13D)
Barlow Wealth Partners, Inc. divulgou 135 participações totais em seus últimos arquivamentos da SEC. O valor mais recente da carteira é calculado como $ 926,520,128 USD. O Ativo Total Sob Gestão (AUM) é esse valor mais o caixa (que não é divulgado). As principais posições de Barlow Wealth Partners, Inc. são Alphabet Inc. (US:GOOG) , Microsoft Corporation (US:MSFT) , NVIDIA Corporation (US:NVDA) , Houlihan Lokey, Inc. (US:HLI) , and Visa Inc. (US:V) . As novas posições de Barlow Wealth Partners, Inc. incluem Arthur J. Gallagher & Co. (US:AJG) , The Charles Schwab Corporation (US:SCHW) , Martin Marietta Materials, Inc. (US:MLM) , .
Maiores Aumentos Este Trimestre
Usamos a mudança na alocação do portfólio porque esta é a métrica mais significativa. As mudanças podem ser devido a operações ou mudanças nos preços das ações.
| Ativo | Ações (MM) |
Valor (MM$) |
% do Portfólio | Δ% do Portfólio |
|---|---|---|---|---|
| AJG / Arthur J. Gallagher & Co. | 0.09 | 23.44 | 2.5296 | 2.5296 |
| GOOG / Alphabet Inc. | 0.24 | 77.60 | 8.3750 | 1.3754 |
| RGLD / Royal Gold, Inc. | 0.11 | 27.69 | 2.9886 | 0.6268 |
| FTI / TechnipFMC plc | 0.49 | 24.29 | 2.6212 | 0.6186 |
| AMZN / Amazon.com, Inc. | 0.09 | 22.04 | 2.3789 | 0.5152 |
| TSM / Taiwan Semiconductor Manufacturing Company Limited - Depositary Receipt (Common Stock) | 0.08 | 27.31 | 2.9478 | 0.2686 |
| TJX / The TJX Companies, Inc. | 0.21 | 32.38 | 3.4952 | 0.2095 |
| JPM / JPMorgan Chase & Co. | 0.08 | 27.95 | 3.0170 | 0.2093 |
| GOOGL / Alphabet Inc. | 0.02 | 5.61 | 0.6055 | 0.1209 |
| TKO / TKO Group Holdings, Inc. | 0.13 | 26.20 | 2.8275 | 0.1186 |
Maiores Diminuições Este Trimestre
Usamos a mudança na alocação do portfólio porque esta é a métrica mais significativa. As mudanças podem ser devido a operações ou mudanças nos preços das ações.
| Ativo | Ações (MM) |
Valor (MM$) |
% do Portfólio | Δ% do Portfólio |
|---|---|---|---|---|
| SFM / Sprouts Farmers Market, Inc. | 0.00 | 0.00 | -1.8610 | |
| VEEV / Veeva Systems Inc. | 0.04 | 8.91 | 0.9612 | -0.7810 |
| CEG / Constellation Energy Corporation | 0.05 | 18.01 | 1.9441 | -0.7396 |
| MELI / MercadoLibre, Inc. | 0.01 | 19.04 | 2.0554 | -0.6270 |
| MSFT / Microsoft Corporation | 0.10 | 47.59 | 5.1369 | -0.5546 |
| HLI / Houlihan Lokey, Inc. | 0.20 | 37.15 | 4.0098 | -0.3778 |
| META / Meta Platforms, Inc. | 0.03 | 22.58 | 2.4375 | -0.3670 |
| GRMN / Garmin Ltd. | 0.08 | 16.02 | 1.7295 | -0.3247 |
| WRB / W. R. Berkley Corporation | 0.27 | 18.46 | 1.9919 | -0.2263 |
| FTNT / Fortinet, Inc. | 0.18 | 14.45 | 1.5591 | -0.1740 |
Arquivamentos 13F e Fundo
Este formulário foi arquivado em 2026-01-15 para o período de relatório 2025-12-31. Clique no ícone de link para ver o histórico completo da transação.
Atualize para desbloquear dados premium e exportar para Excel ![]() .
.
| Ativo | Tipo | Preço Médio por Ação | Ações (MM) |
ΔAções (%) |
Valor ($MM) |
ΔValor (%) |
Portfólio (%) |
ΔPortfólio (%) |
|
|---|---|---|---|---|---|---|---|---|---|
| GOOG / Alphabet Inc. | 0.24 | -5.35 | 77.60 | 23.36 | 8.3750 | 1.3754 | |||
| MSFT / Microsoft Corporation | 0.10 | 1.07 | 47.59 | -6.94 | 5.1369 | -0.5546 | |||
| NVDA / NVIDIA Corporation | 0.22 | 0.10 | 41.11 | 2.64 | 4.4372 | -0.0200 | |||
| HLI / Houlihan Lokey, Inc. | 0.20 | 0.62 | 37.15 | -5.78 | 4.0098 | -0.3778 | |||
| V / Visa Inc. | 0.11 | 1.87 | 36.90 | 3.17 | 3.9830 | 0.0026 | |||
| TJX / The TJX Companies, Inc. | 0.21 | -0.57 | 32.38 | 9.68 | 3.4952 | 0.2095 | |||
| COST / Costco Wholesale Corporation | 0.03 | 1.09 | 32.21 | -1.03 | 3.4765 | -0.1452 | |||
| AAPL / Apple Inc. | 0.12 | 0.85 | 31.68 | 1.21 | 3.4194 | -0.0638 | |||
| MLI / Mueller Industries, Inc. | 0.25 | -14.78 | 31.51 | 1.08 | 3.4013 | -0.0681 | |||
| ASML / ASML Holding N.V. - Depositary Receipt (Common Stock) | 0.02 | -21.72 | 30.28 | -1.42 | 3.2685 | -0.1498 | |||
| JPM / JPMorgan Chase & Co. | 0.08 | -1.02 | 27.95 | 10.78 | 3.0170 | 0.2093 | |||
| RGLD / Royal Gold, Inc. | 0.11 | -2.32 | 27.69 | 30.47 | 2.9886 | 0.6268 | |||
| TSM / Taiwan Semiconductor Manufacturing Company Limited - Depositary Receipt (Common Stock) | 0.08 | 1.26 | 27.31 | 13.44 | 2.9478 | 0.2686 | |||
| TKO / TKO Group Holdings, Inc. | 0.13 | 0.79 | 26.20 | 7.62 | 2.8275 | 0.1186 | |||
| EME / EMCOR Group, Inc. | 0.04 | 1.15 | 25.54 | -1.39 | 2.7565 | -0.1255 | |||
| FTI / TechnipFMC plc | 0.49 | 1.10 | 24.29 | 34.95 | 2.6212 | 0.6186 | |||
| AJG / Arthur J. Gallagher & Co. | 0.09 | 23.44 | 2.5296 | 2.5296 | |||||
| META / Meta Platforms, Inc. | 0.03 | 0.64 | 22.58 | -10.39 | 2.4375 | -0.3670 | |||
| AMZN / Amazon.com, Inc. | 0.09 | 15.95 | 22.04 | 31.60 | 2.3789 | 0.5152 | |||
| GWW / W.W. Grainger, Inc. | 0.02 | 0.50 | 21.31 | 6.91 | 2.3002 | 0.0820 | |||
| BRK.A / Berkshire Hathaway Inc. | 0.04 | 1.92 | 20.01 | 3.44 | 2.1598 | 0.0070 | |||
| MELI / MercadoLibre, Inc. | 0.01 | -24.02 | 19.04 | -21.00 | 2.0554 | -0.6270 | |||
| WRB / W. R. Berkley Corporation | 0.27 | 1.49 | 18.46 | -7.41 | 1.9919 | -0.2263 | |||
| CEG / Constellation Energy Corporation | 0.05 | -23.67 | 18.01 | -25.31 | 1.9441 | -0.7396 | |||
| GRMN / Garmin Ltd. | 0.08 | 1.24 | 16.02 | -13.19 | 1.7295 | -0.3247 | |||
| INTU / Intuit Inc. | 0.02 | 1.13 | 15.10 | -2.47 | 1.6300 | -0.0931 | |||
| FTNT / Fortinet, Inc. | 0.18 | -0.88 | 14.45 | -7.25 | 1.5591 | -0.1740 | |||
| MCK / McKesson Corporation | 0.02 | 7.78 | 13.97 | 10.55 | 1.5081 | 0.1015 | |||
| VRTX / Vertex Pharmaceuticals Incorporated | 0.03 | 0.69 | 13.96 | 9.53 | 1.5063 | 0.0884 | |||
| FICO / Fair Isaac Corporation | 0.01 | 0.69 | 13.18 | 6.54 | 1.4223 | 0.0460 | |||
| MORN / Morningstar, Inc. | 0.06 | -3.38 | 12.04 | -4.76 | 1.2996 | -0.1073 | |||
| ADBE / Adobe Inc. | 0.04 | -1.79 | 11.89 | -7.37 | 1.2828 | -0.1451 | |||
| VEEV / Veeva Systems Inc. | 0.04 | -31.31 | 8.91 | -43.12 | 0.9612 | -0.7810 | |||
| GOOGL / Alphabet Inc. | 0.02 | -1.32 | 5.61 | 28.82 | 0.6055 | 0.1209 | |||
| JNJ / Johnson & Johnson | 0.02 | -2.72 | 4.93 | 3.05 | 0.5325 | -0.0003 | |||
| SYBT / Stock Yards Bancorp, Inc. | 0.06 | 0.00 | 4.10 | -1.61 | 0.4429 | -0.0213 | |||
| BRK.A / Berkshire Hathaway Inc. | 0.00 | 0.00 | 3.74 | 1.55 | 0.4037 | -0.0062 | |||
| TXRH / Texas Roadhouse, Inc. | 0.01 | 0.00 | 2.65 | 2.43 | 0.2862 | -0.0018 | |||
| XOM / Exxon Mobil Corporation | 0.02 | -0.77 | 2.45 | 7.79 | 0.2642 | 0.0115 | |||
| PNC / The PNC Financial Services Group, Inc. | 0.01 | -0.34 | 2.26 | 19.66 | 0.2438 | 0.0337 | |||
| TT / Trane Technologies plc | 0.01 | -11.67 | 2.15 | -17.45 | 0.2323 | -0.0579 | |||
| AMGN / Amgen Inc. | 0.01 | -16.13 | 1.87 | -7.60 | 0.2020 | -0.0234 | |||
| CHDN / Churchill Downs Incorporated | 0.02 | 1.43 | 1.76 | 14.13 | 0.1901 | 0.0183 | |||
| MCD / McDonald's Corporation | 0.01 | 0.00 | 1.70 | -0.93 | 0.1836 | -0.0074 | |||
| ACN / Accenture plc | 0.01 | -4.29 | 1.56 | 7.79 | 0.1688 | 0.0074 | |||
| LLY / Eli Lilly and Company | 0.00 | 7.09 | 1.53 | 40.26 | 0.1647 | 0.0436 | |||
| FSLR / First Solar, Inc. | 0.01 | 0.00 | 1.44 | 6.81 | 0.1558 | 0.0055 | |||
| AMAT / Applied Materials, Inc. | 0.00 | 0.25 | 1.42 | 36.93 | 0.1534 | 0.0379 | |||
| ALL / The Allstate Corporation | 0.01 | 0.00 | 1.25 | 8.96 | 0.1352 | 0.0072 | |||
| ADP / Automatic Data Processing, Inc. | 0.00 | -0.82 | 1.22 | -7.11 | 0.1312 | -0.0144 | |||
| ITW / Illinois Tool Works Inc. | 0.00 | -3.17 | 1.14 | -2.40 | 0.1228 | -0.0068 | |||
| SPGI / S&P Global Inc. | 0.00 | -9.36 | 1.13 | 2.36 | 0.1217 | -0.0009 | |||
| SPY / State Street SPDR S&P 500 ETF Trust | 0.00 | -0.62 | 1.11 | 3.25 | 0.1201 | 0.0002 | |||
| KR / The Kroger Co. | 0.02 | 0.00 | 1.11 | -13.26 | 0.1201 | -0.0226 | |||
| GJR / Strats Trust For Procter & Gambel Security - Preferred Security | 0.01 | -4.83 | 1.10 | -11.27 | 0.1190 | -0.0193 | |||
| KO / The Coca-Cola Company | 0.02 | 0.00 | 1.10 | -0.36 | 0.1183 | -0.0042 | |||
| TRMK / Trustmark Corporation | 0.03 | 0.00 | 1.08 | 5.49 | 0.1162 | 0.0027 | |||
| BFB / Brown-Forman Corp. - Class B | 0.04 | -18.80 | 1.04 | -24.98 | 0.1126 | -0.0421 | |||
| IVV / iShares Trust - iShares Core S&P 500 ETF | 0.00 | -20.65 | 1.03 | -17.63 | 0.1110 | -0.0279 | |||
| VT / Vanguard International Equity Index Funds - Vanguard Total World Stock ETF | 0.01 | 0.00 | 0.94 | 4.43 | 0.1018 | 0.0013 | |||
| SYK / Stryker Corporation | 0.00 | 0.00 | 0.94 | -5.34 | 0.1014 | -0.0091 | |||
| MS / Morgan Stanley | 0.00 | 0.00 | 0.92 | 17.86 | 0.0998 | 0.0125 | |||
| UNH / UnitedHealth Group Incorporated | 0.00 | -0.59 | 0.87 | -5.43 | 0.0940 | -0.0085 | |||
| CVX / Chevron Corporation | 0.01 | 1.13 | 0.87 | 5.46 | 0.0938 | 0.0020 | |||
| MRK / Merck & Co., Inc. | 0.01 | -1.11 | 0.83 | 24.70 | 0.0899 | 0.0156 | |||
| ELV / Elevance Health, Inc. | 0.00 | -0.18 | 0.82 | 7.87 | 0.0887 | 0.0039 | |||
| ABBV / AbbVie Inc. | 0.00 | 1.87 | 0.80 | -1.96 | 0.0865 | -0.0045 | |||
| DIS / The Walt Disney Company | 0.01 | -2.71 | 0.77 | -0.39 | 0.0832 | -0.0028 | |||
| VTI / Vanguard Index Funds - Vanguard Total Stock Market ETF | 0.00 | 0.00 | 0.75 | 4.02 | 0.0812 | 0.0008 | |||
| SHOP / Shopify Inc. | 0.00 | 0.00 | 0.73 | 1.54 | 0.0786 | -0.0012 | |||
| HON / Honeywell International Inc. | 0.00 | 0.78 | 0.67 | 1.06 | 0.0724 | -0.0014 | |||
| ORLY / O'Reilly Automotive, Inc. | 0.01 | 0.00 | 0.66 | -7.36 | 0.0708 | -0.0080 | |||
| GLD / SPDR Gold Shares | 0.00 | 0.00 | 0.65 | 9.92 | 0.0706 | 0.0043 | |||
| GD / General Dynamics Corporation | 0.00 | 0.00 | 0.64 | 4.61 | 0.0686 | 0.0010 | |||
| QQQ / Invesco QQQ Trust, Series 1 | 0.00 | -3.17 | 0.63 | 0.32 | 0.0681 | -0.0020 | |||
| HUM / Humana Inc. | 0.00 | -16.24 | 0.63 | -19.46 | 0.0680 | -0.0190 | |||
| NEE / NextEra Energy, Inc. | 0.01 | 3.25 | 0.61 | -0.49 | 0.0658 | -0.0023 | |||
| MA / Mastercard Incorporated | 0.00 | 0.42 | 0.56 | 1.09 | 0.0600 | -0.0012 | |||
| CL / Colgate-Palmolive Company | 0.01 | 0.00 | 0.55 | 2.06 | 0.0589 | -0.0006 | |||
| SCHW / The Charles Schwab Corporation | 0.01 | 0.52 | 0.0558 | 0.0558 | |||||
| CAT / Caterpillar Inc. | 0.00 | 0.00 | 0.52 | 20.28 | 0.0557 | 0.0079 | |||
| SCHG / Schwab Strategic Trust - Schwab U.S. Large-Cap Growth ETF | 0.02 | 0.00 | 0.51 | 2.41 | 0.0551 | -0.0003 | |||
| VTV / Vanguard Index Funds - Vanguard Value ETF | 0.00 | 0.00 | 0.50 | 5.46 | 0.0542 | 0.0012 | |||
| AVGO / Broadcom Inc. | 0.00 | 25.37 | 0.50 | 26.97 | 0.0539 | 0.0102 | |||
| COF / Capital One Financial Corporation | 0.00 | 0.00 | 0.49 | 13.10 | 0.0531 | 0.0047 | |||
| PM / Philip Morris International Inc. | 0.00 | 0.00 | 0.49 | 3.62 | 0.0527 | 0.0003 | |||
| AZO / AutoZone, Inc. | 0.00 | 0.00 | 0.49 | -14.46 | 0.0524 | -0.0107 | |||
| CINF / Cincinnati Financial Corporation | 0.00 | 0.00 | 0.48 | 5.00 | 0.0522 | 0.0009 | |||
| DOV / Dover Corporation | 0.00 | 0.00 | 0.46 | 20.53 | 0.0495 | 0.0071 | |||
| NFLX / Netflix, Inc. | 0.01 | 880.62 | 0.45 | -21.53 | 0.0489 | -0.0152 | |||
| LMT / Lockheed Martin Corporation | 0.00 | 0.00 | 0.44 | 11.59 | 0.0479 | 0.0036 | |||
| COR / Cencora, Inc. | 0.00 | 0.00 | 0.43 | 1.43 | 0.0459 | -0.0007 | |||
| APP / AppLovin Corporation | 0.00 | 10.26 | 0.42 | 26.36 | 0.0451 | 0.0083 | |||
| AVGE / American Century ETF Trust - Avantis All Equity Markets ETF | 0.00 | 0.00 | 0.40 | 6.45 | 0.0428 | 0.0013 | |||
| VV / Vanguard Index Funds - Vanguard Large-Cap ETF | 0.00 | 0.00 | 0.39 | 3.72 | 0.0421 | 0.0003 | |||
| WMT / Walmart Inc. | 0.00 | 5.72 | 0.38 | 12.76 | 0.0411 | 0.0036 | |||
| USB / U.S. Bancorp | 0.01 | 0.00 | 0.37 | 16.67 | 0.0401 | 0.0047 | |||
| BLK / BlackRock, Inc. | 0.00 | 0.00 | 0.37 | -3.93 | 0.0397 | -0.0029 | |||
| FIX / Comfort Systems USA, Inc. | 0.00 | 37.88 | 0.37 | 76.44 | 0.0397 | 0.0165 | |||
| AXP / American Express Company | 0.00 | 0.00 | 0.34 | 6.67 | 0.0363 | 0.0012 | |||
| GPC / Genuine Parts Company | 0.00 | 0.00 | 0.33 | -3.47 | 0.0361 | -0.0024 | |||
| FTEC / Fidelity Covington Trust - Fidelity MSCI Information Technology Index ETF | 0.00 | 0.89 | 0.33 | 2.45 | 0.0361 | -0.0003 | |||
| VVISX / Financial Investors Trust - Vulcan Value Partners Small Cap Fund Institutional Class | 0.00 | 0.00 | 0.33 | 7.17 | 0.0355 | 0.0013 | |||
| DE / Deere & Company | 0.00 | 0.00 | 0.32 | 5.56 | 0.0349 | 0.0008 | |||
| FNB / F.N.B. Corporation | 0.02 | 0.69 | 0.32 | 15.33 | 0.0342 | 0.0037 | |||
| PEP / PepsiCo, Inc. | 0.00 | -2.26 | 0.30 | -10.62 | 0.0327 | -0.0050 | |||
| VEU / Vanguard International Equity Index Funds - Vanguard FTSE All-World ex-US ETF | 0.00 | 0.00 | 0.30 | 4.88 | 0.0326 | 0.0006 | |||
| ONB / Old National Bancorp | 0.01 | 0.00 | 0.29 | 11.72 | 0.0309 | 0.0024 | |||
| ORCL / Oracle Corporation | 0.00 | 5.91 | 0.28 | -22.83 | 0.0307 | -0.0103 | |||
| APD / Air Products and Chemicals, Inc. | 0.00 | 0.00 | 0.28 | 4.41 | 0.0307 | 0.0003 | |||
| BFA / Brown-Forman Corp. - Class A | 0.01 | -32.22 | 0.28 | -35.99 | 0.0304 | -0.0186 | |||
| HD / The Home Depot, Inc. | 0.00 | 7.16 | 0.28 | 3.32 | 0.0302 | 0.0000 | |||
| WPC / W. P. Carey Inc. | 0.00 | 0.00 | 0.28 | -1.76 | 0.0302 | -0.0015 | |||
| TXN / Texas Instruments Incorporated | 0.00 | 0.21 | 0.28 | 11.34 | 0.0298 | 0.0023 | |||
| MDT / Medtronic plc | 0.00 | 0.00 | 0.28 | 1.48 | 0.0298 | -0.0004 | |||
| UPS / United Parcel Service, Inc. | 0.00 | 1.00 | 0.27 | 25.23 | 0.0295 | 0.0052 | |||
| FCAP / First Capital, Inc. | 0.01 | 0.40 | 0.27 | 22.97 | 0.0295 | 0.0047 | |||
| MO / Altria Group, Inc. | 0.00 | 0.00 | 0.27 | -10.82 | 0.0294 | -0.0046 | |||
| GSCE / GS Connect S&P GSCI Enhanced Commodity Total Return ETN | 0.00 | 0.00 | 0.27 | 26.42 | 0.0290 | 0.0053 | |||
| IBM / International Business Machines Corporation | 0.00 | 0.00 | 0.26 | 5.81 | 0.0275 | 0.0007 | |||
| CRWD / CrowdStrike Holdings, Inc. | 0.00 | 0.00 | 0.25 | -5.95 | 0.0273 | -0.0026 | |||
| MEDP / Medpace Holdings, Inc. | 0.00 | 0.00 | 0.25 | 8.62 | 0.0273 | 0.0014 | |||
| MDLZ / Mondelez International, Inc. | 0.00 | 0.00 | 0.25 | -11.27 | 0.0273 | -0.0044 | |||
| HWC / Hancock Whitney Corporation | 0.00 | 0.23 | 0.0253 | 0.0253 | |||||
| ONTO / Onto Innovation Inc. | 0.00 | 0.23 | 0.0252 | 0.0252 | |||||
| ABT / Abbott Laboratories | 0.00 | 3.64 | 0.23 | 1.78 | 0.0248 | -0.0003 | |||
| VO / Vanguard Index Funds - Vanguard Mid-Cap ETF | 0.00 | 0.00 | 0.23 | 2.70 | 0.0247 | -0.0002 | |||
| SO / The Southern Company | 0.00 | 0.00 | 0.23 | -10.98 | 0.0246 | -0.0038 | |||
| CBRE / CBRE Group, Inc. | 0.00 | 0.00 | 0.22 | 0.91 | 0.0239 | -0.0005 | |||
| RBCAA / Republic Bancorp, Inc. | 0.00 | 0.00 | 0.21 | -0.47 | 0.0230 | -0.0007 | |||
| TSLA / Tesla, Inc. | 0.00 | 0.21 | 0.0227 | 0.0227 | |||||
| CB / Chubb Limited | 0.00 | 0.21 | 0.0223 | 0.0223 | |||||
| TSCO / Tractor Supply Company | 0.00 | 0.00 | 0.20 | -6.10 | 0.0217 | -0.0021 | |||
| MLM / Martin Marietta Materials, Inc. | 0.00 | 0.20 | 0.0216 | 0.0216 | |||||
| SYPR / Sypris Solutions, Inc. | 0.03 | 0.00 | 0.06 | 23.53 | 0.0069 | 0.0012 | |||
| SFM / Sprouts Farmers Market, Inc. | 0.00 | -100.00 | 0.00 | -100.00 | -1.8610 | ||||
| PLTR / Palantir Technologies Inc. | 0.00 | -100.00 | 0.00 | -100.00 | -0.0250 | ||||
| KMB / Kimberly-Clark Corporation | 0.00 | -100.00 | 0.00 | 0.0000 |