Estatísticas Básicas
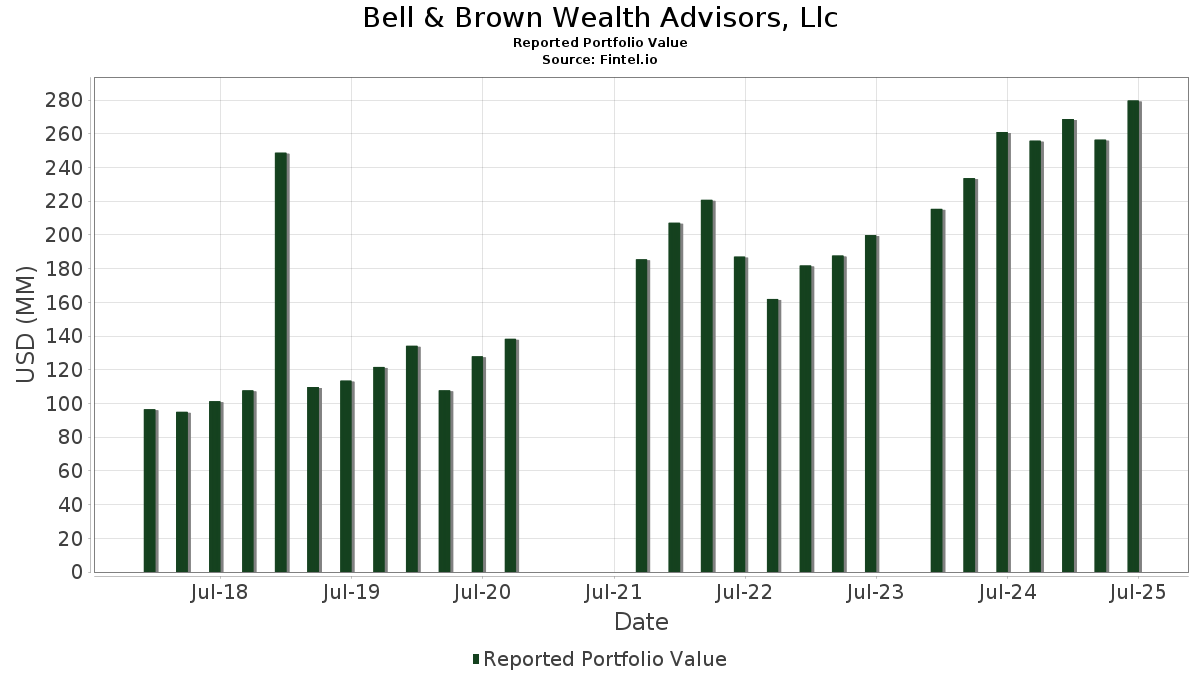
| Valor do Portfólio | $ 305,419,985 |
| Posições Atuais | 72 |
Últimas Participações, Desempenho, AUM (de 13F, 13D)
Bell & Brown Wealth Advisors, Llc divulgou 72 participações totais em seus últimos arquivamentos da SEC. O valor mais recente da carteira é calculado como $ 305,419,985 USD. O Ativo Total Sob Gestão (AUM) é esse valor mais o caixa (que não é divulgado). As principais posições de Bell & Brown Wealth Advisors, Llc são Broadcom Inc. (US:AVGO) , Apple Inc. (US:AAPL) , Alphabet Inc. (US:GOOGL) , Meta Platforms, Inc. (US:META) , and GS Connect S&P GSCI Enhanced Commodity Total Return ETN (US:GSCE) . As novas posições de Bell & Brown Wealth Advisors, Llc incluem Advanced Micro Devices, Inc. (US:AMD) , Shopify Inc. (US:SHOP) , Strategy Inc (US:MSTR) , Cloudflare, Inc. (US:NET) , and .
Maiores Aumentos Este Trimestre
Usamos a mudança na alocação do portfólio porque esta é a métrica mais significativa. As mudanças podem ser devido a operações ou mudanças nos preços das ações.
| Ativo | Ações (MM) |
Valor (MM$) |
% do Portfólio | Δ% do Portfólio |
|---|---|---|---|---|
| 0.06 | 13.87 | 4.5397 | 0.8831 | |
| 0.04 | 6.97 | 2.2825 | 0.7004 | |
| 0.06 | 15.94 | 5.2199 | 0.6472 | |
| 0.01 | 6.06 | 1.9842 | 0.4921 | |
| 0.03 | 8.44 | 2.7627 | 0.3825 | |
| 0.04 | 7.32 | 2.3962 | 0.3472 | |
| 0.06 | 20.30 | 6.6468 | 0.3053 | |
| 0.03 | 6.03 | 1.9733 | 0.1625 | |
| 0.01 | 7.76 | 2.5417 | 0.1249 | |
| 0.02 | 5.35 | 1.7528 | 0.1107 |
Maiores Diminuições Este Trimestre
Usamos a mudança na alocação do portfólio porque esta é a métrica mais significativa. As mudanças podem ser devido a operações ou mudanças nos preços das ações.
| Ativo | Ações (MM) |
Valor (MM$) |
% do Portfólio | Δ% do Portfólio |
|---|---|---|---|---|
| 0.02 | 12.33 | 4.0381 | -0.4637 | |
| 0.05 | 6.17 | 2.0199 | -0.3602 | |
| 0.07 | 5.03 | 1.6459 | -0.3150 | |
| 0.01 | 5.81 | 1.9037 | -0.3122 | |
| 0.01 | 9.87 | 3.2326 | -0.2754 | |
| 0.04 | 8.36 | 2.7378 | -0.2370 | |
| 0.05 | 4.15 | 1.3594 | -0.2321 | |
| 0.04 | 7.80 | 2.5535 | -0.1844 | |
| 0.01 | 1.15 | 0.3749 | -0.1840 | |
| 0.04 | 2.98 | 0.9762 | -0.1694 |
Arquivamentos 13F e Fundo
Este formulário foi arquivado em 2025-11-07 para o período de relatório 2025-09-30. Clique no ícone de link para ver o histórico completo da transação.
Atualize para desbloquear dados premium e exportar para Excel ![]() .
.
| Ativo | Tipo | Preço Médio por Ação | Ações (MM) |
ΔAções (%) |
Valor ($MM) |
ΔAções (%) |
Portfólio (%) |
ΔPortfólio (%) |
|
|---|---|---|---|---|---|---|---|---|---|
| AVGO / Broadcom Inc. | 0.06 | -4.36 | 20.30 | 14.47 | 6.6468 | 0.3053 | |||
| AAPL / Apple Inc. | 0.06 | 0.43 | 15.94 | 24.66 | 5.2199 | 0.6472 | |||
| GOOGL / Alphabet Inc. | 0.06 | -1.71 | 13.87 | 35.59 | 4.5397 | 0.8831 | |||
| META / Meta Platforms, Inc. | 0.02 | -1.45 | 12.33 | -2.03 | 4.0381 | -0.4637 | |||
| GSCE / GS Connect S&P GSCI Enhanced Commodity Total Return ETN | 0.01 | -3.13 | 11.03 | 8.97 | 3.6104 | -0.0078 | |||
| JPM / JPMorgan Chase & Co. | 0.03 | -1.31 | 10.58 | 7.37 | 3.4637 | -0.0593 | |||
| LLY / Eli Lilly and Company | 0.01 | 2.89 | 9.87 | 0.64 | 3.2326 | -0.2754 | |||
| XOM / Exxon Mobil Corporation | 0.08 | 1.33 | 8.49 | 6.02 | 2.7798 | -0.0837 | |||
| ORCL / Oracle Corporation | 0.03 | -1.46 | 8.44 | 26.76 | 2.7627 | 0.3825 | |||
| AMZN / Amazon.com, Inc. | 0.04 | 0.29 | 8.36 | 0.50 | 2.7378 | -0.2370 | |||
| MSFT / Microsoft Corporation | 0.02 | -0.52 | 8.34 | 3.68 | 2.7316 | -0.1457 | |||
| BA / The Boeing Company | 0.04 | -1.19 | 7.80 | 1.84 | 2.5535 | -0.1844 | |||
| ULTA / Ulta Beauty, Inc. | 0.01 | -1.96 | 7.76 | 14.86 | 2.5417 | 0.1249 | |||
| WFC / Wells Fargo & Company | 0.09 | -0.33 | 7.62 | 4.28 | 2.4951 | -0.1180 | |||
| QCOM / QUALCOMM Incorporated | 0.05 | 0.44 | 7.60 | 5.22 | 2.4892 | -0.0945 | |||
| VLO / Valero Energy Corporation | 0.04 | 0.81 | 7.32 | 27.71 | 2.3962 | 0.3472 | |||
| BABA / Alibaba Group Holding Limited - Depositary Receipt (Common Stock) | 0.04 | -0.02 | 6.97 | 57.57 | 2.2825 | 0.7004 | |||
| DIS / The Walt Disney Company | 0.05 | 0.38 | 6.17 | -7.32 | 2.0199 | -0.3602 | |||
| TSLA / Tesla, Inc. | 0.01 | 3.74 | 6.06 | 45.25 | 1.9842 | 0.4921 | |||
| WSM / Williams-Sonoma, Inc. | 0.03 | -0.55 | 6.03 | 19.00 | 1.9733 | 0.1625 | |||
| WMT / Walmart Inc. | 0.06 | 0.53 | 5.98 | 5.96 | 1.9569 | -0.0600 | |||
| COST / Costco Wholesale Corporation | 0.01 | 0.46 | 5.81 | -6.18 | 1.9037 | -0.3122 | |||
| GLD / SPDR Gold Shares | 0.02 | -0.03 | 5.35 | 16.57 | 1.7528 | 0.1107 | |||
| PYPL / PayPal Holdings, Inc. | 0.07 | 1.45 | 5.03 | -8.33 | 1.6459 | -0.3150 | |||
| FDX / FedEx Corporation | 0.02 | 1.54 | 4.90 | 4.92 | 1.6049 | -0.0654 | |||
| AXP / American Express Company | 0.01 | 0.61 | 4.90 | 4.77 | 1.6043 | -0.0680 | |||
| CVX / Chevron Corporation | 0.03 | 0.53 | 4.59 | 9.02 | 1.5034 | -0.0026 | |||
| RTX / RTX Corporation | 0.03 | -2.01 | 4.40 | 12.46 | 1.4399 | 0.0417 | |||
| OXY / Occidental Petroleum Corporation | 0.09 | 3.00 | 4.23 | 16.04 | 1.3859 | 0.0816 | |||
| SBUX / Starbucks Corporation | 0.05 | 1.04 | 4.15 | -6.72 | 1.3594 | -0.2321 | |||
| HD / The Home Depot, Inc. | 0.01 | -0.55 | 3.87 | 9.88 | 1.2680 | 0.0079 | |||
| COF / Capital One Financial Corporation | 0.02 | -0.23 | 3.71 | -0.30 | 1.2155 | -0.1161 | |||
| MRK / Merck & Co., Inc. | 0.04 | 0.27 | 3.66 | 6.30 | 1.1996 | -0.0328 | |||
| WMB / The Williams Companies, Inc. | 0.05 | 1.12 | 3.45 | 7.74 | 1.1311 | -0.0155 | |||
| MCD / McDonald's Corporation | 0.01 | 0.78 | 3.28 | 4.82 | 1.0752 | -0.0450 | |||
| AMGN / Amgen Inc. | 0.01 | 1.20 | 3.18 | 1.92 | 1.0412 | -0.0743 | |||
| C / Citigroup Inc. | 0.03 | -0.97 | 3.11 | 18.06 | 1.0192 | 0.0766 | |||
| KO / The Coca-Cola Company | 0.04 | -0.72 | 2.98 | -6.93 | 0.9762 | -0.1694 | |||
| UBER / Uber Technologies, Inc. | 0.03 | -0.39 | 2.93 | 4.60 | 0.9602 | -0.0423 | |||
| DD / DuPont de Nemours, Inc. | 0.04 | 0.43 | 2.87 | 14.06 | 0.9404 | 0.0400 | |||
| PEP / PepsiCo, Inc. | 0.02 | 1.43 | 2.84 | 7.86 | 0.9304 | -0.0115 | |||
| GJR / Strats Trust For Procter & Gambel Security - Preferred Security | 0.02 | 0.91 | 2.80 | -2.68 | 0.9172 | -0.1121 | |||
| NKE / NIKE, Inc. | 0.03 | 1.64 | 2.40 | -0.25 | 0.7853 | -0.0744 | |||
| KMB / Kimberly-Clark Corporation | 0.02 | -0.11 | 2.15 | -3.68 | 0.7032 | -0.0940 | |||
| BMY / Bristol-Myers Squibb Company | 0.04 | 0.53 | 1.93 | -2.04 | 0.6304 | -0.0725 | |||
| TGT / Target Corporation | 0.02 | 5.25 | 1.87 | -4.06 | 0.6116 | -0.0843 | |||
| CTVA / Corteva, Inc. | 0.03 | -0.51 | 1.73 | -9.73 | 0.5680 | -0.1191 | |||
| TK / Teekay Corporation Ltd. | 0.20 | 0.95 | 1.66 | 0.06 | 0.5425 | -0.0494 | |||
| NFLX / Netflix, Inc. | 0.00 | -0.30 | 1.61 | -9.53 | 0.5256 | -0.1089 | |||
| LOW / Lowe's Companies, Inc. | 0.01 | 0.92 | 1.38 | 14.23 | 0.4524 | 0.0201 | |||
| NVDD / Direxion Shares ETF Trust - Direxion Daily NVDA Bear 1X Shares | 0.01 | -5.21 | 1.25 | 11.92 | 0.4091 | 0.0099 | |||
| CE / Celanese Corporation | 0.03 | 4.03 | 1.19 | -20.89 | 0.3894 | -0.1481 | |||
| GE / General Electric Company | 0.00 | -1.62 | 1.17 | 15.23 | 0.3816 | 0.0199 | |||
| LULU / lululemon athletica inc. | 0.01 | -2.19 | 1.15 | -26.74 | 0.3749 | -0.1840 | |||
| GOOG / Alphabet Inc. | 0.00 | -2.25 | 1.04 | 35.83 | 0.3389 | 0.0663 | |||
| BRK.B / Berkshire Hathaway Inc. | 0.00 | 0.00 | 0.73 | 3.12 | 0.2387 | -0.0141 | |||
| MS / Morgan Stanley | 0.00 | 0.49 | 0.72 | 13.50 | 0.2368 | 0.0088 | |||
| CRWD / CrowdStrike Holdings, Inc. | 0.00 | -4.81 | 0.53 | -8.25 | 0.1748 | -0.0335 | |||
| GEV / GE Vernova Inc. | 0.00 | -1.22 | 0.50 | 14.81 | 0.1625 | 0.0079 | |||
| IOSP / Innospec Inc. | 0.00 | 0.02 | 0.38 | -8.15 | 0.1255 | -0.0238 | |||
| DOW / Dow Inc. | 0.01 | -14.57 | 0.33 | -26.07 | 0.1080 | -0.0514 | |||
| V / Visa Inc. | 0.00 | 0.00 | 0.32 | -3.86 | 0.1061 | -0.0144 | |||
| JNJ / Johnson & Johnson | 0.00 | 14.25 | 0.30 | 38.81 | 0.0998 | 0.0212 | |||
| NOC / Northrop Grumman Corporation | 0.00 | 0.21 | 0.30 | 21.90 | 0.0967 | 0.0101 | |||
| QQQ / Invesco QQQ Trust, Series 1 | 0.00 | -1.24 | 0.29 | 7.12 | 0.0939 | -0.0017 | |||
| AMD / Advanced Micro Devices, Inc. | 0.00 | 0.26 | 0.0849 | 0.0849 | |||||
| SHOP / Shopify Inc. | 0.00 | 0.25 | 0.0810 | 0.0810 | |||||
| MSTR / Strategy Inc | 0.00 | 0.23 | 0.0769 | 0.0769 | |||||
| NET / Cloudflare, Inc. | 0.00 | 0.21 | 0.0703 | 0.0703 | |||||
| BAC / Bank of America Corporation | 0.00 | -2.42 | 0.21 | 5.97 | 0.0700 | -0.0019 | |||
| IBRX / ImmunityBio, Inc. | 0.08 | 6.43 | 0.20 | -0.98 | 0.0667 | -0.0067 | |||
| RIVN / Rivian Automotive, Inc. | 0.01 | 0.00 | 0.20 | 7.07 | 0.0646 | -0.0014 | |||
| EIX / Edison International | 0.00 | -100.00 | 0.00 | 0.0000 | |||||
| TGT / Target Corporation | Put | 0.00 | -100.00 | 0.00 | -100.00 | -0.0176 |