Estatísticas Básicas
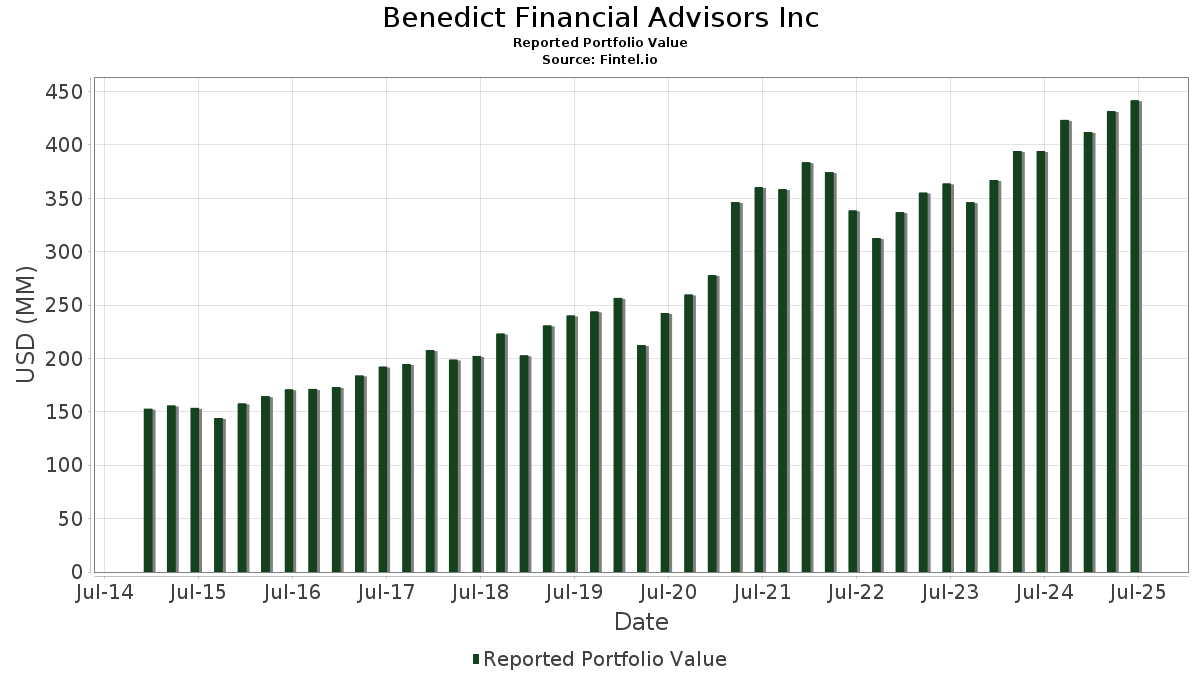
| Valor do Portfólio | $ 461,257,316 |
| Posições Atuais | 129 |
Últimas Participações, Desempenho, AUM (de 13F, 13D)
Benedict Financial Advisors Inc divulgou 129 participações totais em seus últimos arquivamentos da SEC. O valor mais recente da carteira é calculado como $ 461,257,316 USD. O Ativo Total Sob Gestão (AUM) é esse valor mais o caixa (que não é divulgado). As principais posições de Benedict Financial Advisors Inc são Apple Inc. (US:AAPL) , Microsoft Corporation (US:MSFT) , Altria Group, Inc. (US:MO) , SPDR Series Trust - State Street SPDR Bloomberg 1-3 Month T-Bill ETF (US:BIL) , and Cisco Systems, Inc. (US:CSCO) . As novas posições de Benedict Financial Advisors Inc incluem Lamar Advertising Company (US:LAMR) , Global Payments Inc. (US:GPN) , The 2023 ETF Series Trust II - GMO U.S. Quality ETF (US:QLTY) , .
Maiores Aumentos Este Trimestre
Usamos a mudança na alocação do portfólio porque esta é a métrica mais significativa. As mudanças podem ser devido a operações ou mudanças nos preços das ações.
| Ativo | Ações (MM) |
Valor (MM$) |
% do Portfólio | Δ% do Portfólio |
|---|---|---|---|---|
| 0.02 | 6.52 | 1.4128 | 1.4128 | |
| 0.09 | 22.95 | 4.9757 | 0.6633 | |
| 0.10 | 8.38 | 1.8177 | 0.5637 | |
| 0.01 | 2.12 | 0.4594 | 0.4594 | |
| 0.02 | 1.88 | 0.4077 | 0.4077 | |
| 0.05 | 10.88 | 2.3592 | 0.4022 | |
| 0.06 | 11.61 | 2.5171 | 0.3596 | |
| 0.01 | 1.09 | 0.2374 | 0.2374 | |
| 0.22 | 14.55 | 3.1536 | 0.2030 | |
| 0.07 | 12.00 | 2.6024 | 0.1714 |
Maiores Diminuições Este Trimestre
Usamos a mudança na alocação do portfólio porque esta é a métrica mais significativa. As mudanças podem ser devido a operações ou mudanças nos preços das ações.
| Ativo | Ações (MM) |
Valor (MM$) |
% do Portfólio | Δ% do Portfólio |
|---|---|---|---|---|
| 0.01 | 2.48 | 0.5381 | -1.5014 | |
| 0.06 | 4.74 | 1.0287 | -0.4720 | |
| 0.07 | 11.43 | 2.4787 | -0.4633 | |
| 0.02 | 0.99 | 0.2152 | -0.2301 | |
| 0.03 | 5.63 | 1.2198 | -0.1938 | |
| 0.04 | 18.24 | 3.9550 | -0.1607 | |
| 0.07 | 4.95 | 1.0733 | -0.1551 | |
| 0.18 | 12.60 | 2.7307 | -0.1492 | |
| 0.02 | 7.36 | 1.5967 | -0.1432 | |
| 0.04 | 1.98 | 0.4302 | -0.1344 |
Arquivamentos 13F e Fundo
Este formulário foi arquivado em 2025-11-03 para o período de relatório 2025-09-30. Clique no ícone de link para ver o histórico completo da transação.
Atualize para desbloquear dados premium e exportar para Excel ![]() .
.
| Ativo | Tipo | Preço Médio por Ação | Ações (MM) |
ΔAções (%) |
Valor ($MM) |
ΔAções (%) |
Portfólio (%) |
ΔPortfólio (%) |
|
|---|---|---|---|---|---|---|---|---|---|
| AAPL / Apple Inc. | 0.09 | -2.86 | 22.95 | 20.56 | 4.9757 | 0.6633 | |||
| MSFT / Microsoft Corporation | 0.04 | -3.57 | 18.24 | 0.41 | 3.9550 | -0.1607 | |||
| MO / Altria Group, Inc. | 0.22 | -0.88 | 14.55 | 11.69 | 3.1536 | 0.2030 | |||
| BIL / SPDR Series Trust - State Street SPDR Bloomberg 1-3 Month T-Bill ETF | 0.15 | 0.38 | 14.13 | 0.40 | 3.0644 | -0.1249 | |||
| CSCO / Cisco Systems, Inc. | 0.18 | 0.47 | 12.60 | -0.92 | 2.7307 | -0.1492 | |||
| RTX / RTX Corporation | 0.07 | -2.39 | 12.00 | 11.85 | 2.6024 | 0.1714 | |||
| JNJ / Johnson & Johnson | 0.06 | 0.43 | 11.61 | 21.90 | 2.5171 | 0.3596 | |||
| PM / Philip Morris International Inc. | 0.07 | -1.15 | 11.43 | -11.97 | 2.4787 | -0.4633 | |||
| ABBV / AbbVie Inc. | 0.05 | 0.98 | 10.88 | 25.97 | 2.3592 | 0.4022 | |||
| TRV / The Travelers Companies, Inc. | 0.04 | -0.29 | 9.91 | 4.06 | 2.1487 | -0.0088 | |||
| AMGN / Amgen Inc. | 0.03 | 0.82 | 9.49 | 1.90 | 2.0579 | -0.0523 | |||
| GLW / Corning Incorporated | 0.10 | -2.90 | 8.38 | 51.47 | 1.8177 | 0.5637 | |||
| CME / CME Group Inc. | 0.03 | 0.94 | 8.15 | -1.06 | 1.7674 | -0.0990 | |||
| VZ / Verizon Communications Inc. | 0.17 | 1.87 | 7.69 | 3.47 | 1.6672 | -0.0164 | |||
| BRK.B / Berkshire Hathaway Inc. | 0.02 | -3.96 | 7.62 | -0.59 | 1.6510 | -0.0845 | |||
| V / Visa Inc. | 0.02 | -0.27 | 7.36 | -4.11 | 1.5967 | -0.1432 | |||
| MDT / Medtronic plc | 0.08 | 0.65 | 7.21 | 9.96 | 1.5625 | 0.0778 | |||
| QCOM / QUALCOMM Incorporated | 0.04 | 1.12 | 7.03 | 5.62 | 1.5243 | 0.0164 | |||
| MCD / McDonald's Corporation | 0.02 | -0.90 | 6.67 | 3.08 | 1.4452 | -0.0199 | |||
| CB / Chubb Limited | 0.02 | 6.52 | 1.4128 | 1.4128 | |||||
| DUK / Duke Energy Corporation | 0.05 | 0.59 | 6.02 | 5.48 | 1.3052 | 0.0124 | |||
| LMT / Lockheed Martin Corporation | 0.01 | 0.68 | 5.73 | 8.54 | 1.2423 | 0.0462 | |||
| HSY / The Hershey Company | 0.03 | 1.46 | 5.63 | 14.35 | 1.2213 | 0.1054 | |||
| HON / Honeywell International Inc. | 0.03 | -0.25 | 5.63 | -9.83 | 1.2198 | -0.1938 | |||
| GJR / Strats Trust For Procter & Gambel Security - Preferred Security | 0.03 | 0.56 | 5.30 | -3.02 | 1.1482 | -0.0890 | |||
| ADP / Automatic Data Processing, Inc. | 0.02 | -1.27 | 5.28 | -6.03 | 1.1451 | -0.1284 | |||
| COR / Cencora, Inc. | 0.02 | -0.11 | 5.23 | 4.10 | 1.1332 | -0.0041 | |||
| KO / The Coca-Cola Company | 0.07 | -2.60 | 4.95 | -8.71 | 1.0733 | -0.1551 | |||
| AXP / American Express Company | 0.01 | 0.56 | 4.93 | 4.71 | 1.0691 | 0.0023 | |||
| WMT / Walmart Inc. | 0.05 | -2.62 | 4.90 | 2.64 | 1.0617 | -0.0191 | |||
| GIS / General Mills, Inc. | 0.10 | 2.78 | 4.80 | 0.02 | 1.0405 | -0.0465 | |||
| SYY / Sysco Corporation | 0.06 | -8.81 | 4.74 | -28.38 | 1.0287 | -0.4720 | |||
| EMR / Emerson Electric Co. | 0.04 | -2.00 | 4.67 | -3.58 | 1.0114 | -0.0846 | |||
| CVX / Chevron Corporation | 0.03 | 0.71 | 4.51 | 9.23 | 0.9778 | 0.0424 | |||
| KMI / Kinder Morgan, Inc. | 0.16 | 3.07 | 4.48 | -0.73 | 0.9704 | -0.0512 | |||
| ABT / Abbott Laboratories | 0.03 | -1.63 | 4.35 | -3.12 | 0.9425 | -0.0741 | |||
| JPM / JPMorgan Chase & Co. | 0.01 | -2.34 | 4.12 | 6.27 | 0.8934 | 0.0149 | |||
| AMZN / Amazon.com, Inc. | 0.02 | 1.50 | 4.08 | 1.59 | 0.8853 | -0.0254 | |||
| SBUX / Starbucks Corporation | 0.05 | 1.85 | 4.03 | -5.97 | 0.8745 | -0.0972 | |||
| XLV / The Select Sector SPDR Trust - State Street Health Care Select Sector SPDR ETF | 0.03 | -3.35 | 3.74 | -0.21 | 0.8104 | -0.0382 | |||
| VIG / Vanguard Specialized Funds - Vanguard Dividend Appreciation ETF | 0.02 | -0.81 | 3.66 | 4.58 | 0.7925 | 0.0007 | |||
| BDX / Becton, Dickinson and Company | 0.02 | 3.06 | 3.43 | 11.99 | 0.7430 | 0.0497 | |||
| FANG / Diamondback Energy, Inc. | 0.02 | 1.60 | 3.38 | 5.82 | 0.7338 | 0.0092 | |||
| KMB / Kimberly-Clark Corporation | 0.03 | 2.11 | 3.34 | -1.50 | 0.7238 | -0.0441 | |||
| KR / The Kroger Co. | 0.05 | 1.51 | 3.25 | -4.59 | 0.7035 | -0.0671 | |||
| RNR / RenaissanceRe Holdings Ltd. | 0.01 | 1.60 | 3.24 | 6.22 | 0.7034 | 0.0114 | |||
| ICE / Intercontinental Exchange, Inc. | 0.02 | 1.83 | 3.24 | -6.50 | 0.7022 | -0.0824 | |||
| QQQ / Invesco QQQ Trust, Series 1 | 0.01 | 3.96 | 3.23 | 13.14 | 0.7000 | 0.0536 | |||
| DOV / Dover Corporation | 0.02 | -0.17 | 3.22 | -9.11 | 0.6986 | -0.1045 | |||
| COST / Costco Wholesale Corporation | 0.00 | -0.55 | 3.18 | -7.02 | 0.6889 | -0.0852 | |||
| CRWD / CrowdStrike Holdings, Inc. | 0.01 | 0.74 | 3.06 | -2.98 | 0.6630 | -0.0512 | |||
| DLR / Digital Realty Trust, Inc. | 0.02 | 0.17 | 3.02 | -0.66 | 0.6552 | -0.0340 | |||
| ROL / Rollins, Inc. | 0.05 | -0.04 | 2.95 | 4.10 | 0.6389 | -0.0026 | |||
| NVDD / Direxion Shares ETF Trust - Direxion Daily NVDA Bear 1X Shares | 0.02 | -0.61 | 2.92 | 17.38 | 0.6341 | 0.0696 | |||
| BMY / Bristol-Myers Squibb Company | 0.06 | -2.67 | 2.92 | -5.16 | 0.6336 | -0.0646 | |||
| UL / Unilever PLC - Depositary Receipt (Common Stock) | 0.05 | -0.77 | 2.92 | -3.86 | 0.6321 | -0.0547 | |||
| RPM / RPM International Inc. | 0.02 | 0.22 | 2.87 | 7.57 | 0.6225 | 0.0177 | |||
| ELV / Elevance Health, Inc. | 0.01 | 4.59 | 2.83 | -13.13 | 0.6129 | -0.1242 | |||
| LOW / Lowe's Companies, Inc. | 0.01 | -1.83 | 2.82 | 11.21 | 0.6110 | 0.0369 | |||
| TRP / TC Energy Corporation | 0.05 | 1.56 | 2.65 | 13.27 | 0.5755 | 0.0445 | |||
| HD / The Home Depot, Inc. | 0.01 | -0.53 | 2.58 | 9.94 | 0.5585 | 0.0276 | |||
| ADM / Archer-Daniels-Midland Company | 0.04 | 1.64 | 2.58 | 15.06 | 0.5584 | 0.0512 | |||
| AXS / AXIS Capital Holdings Limited | 0.03 | 0.56 | 2.56 | -7.22 | 0.5543 | -0.0699 | |||
| TXN / Texas Instruments Incorporated | 0.01 | 0.36 | 2.53 | -11.18 | 0.5479 | -0.0967 | |||
| DEO / Diageo plc - Depositary Receipt (Common Stock) | 0.03 | -2.42 | 2.51 | -7.66 | 0.5434 | -0.0714 | |||
| CVS / CVS Health Corporation | 0.03 | 1.11 | 2.50 | 10.51 | 0.5427 | 0.0295 | |||
| CBOE / Cboe Global Markets, Inc. | 0.01 | -69.35 | 2.48 | -72.44 | 0.5381 | -1.5014 | |||
| ROK / Rockwell Automation, Inc. | 0.01 | -1.54 | 2.42 | 3.60 | 0.5249 | -0.0045 | |||
| CAT / Caterpillar Inc. | 0.01 | -2.98 | 2.39 | 19.23 | 0.5189 | 0.0641 | |||
| WTRG / Essential Utilities, Inc. | 0.06 | -10.29 | 2.36 | -3.63 | 0.5123 | -0.0432 | |||
| GD / General Dynamics Corporation | 0.01 | 2.53 | 2.28 | 19.84 | 0.4938 | 0.0634 | |||
| NVS / Novartis AG - Depositary Receipt (Common Stock) | 0.02 | -0.39 | 2.25 | 5.55 | 0.4871 | 0.0049 | |||
| TGT / Target Corporation | 0.02 | 0.68 | 2.20 | -8.48 | 0.4778 | -0.0675 | |||
| NSRGY / Nestlé S.A. - Depositary Receipt (Common Stock) | 0.02 | 2.60 | 2.14 | -5.22 | 0.4647 | -0.0475 | |||
| BA / The Boeing Company | 0.01 | -1.10 | 2.14 | 1.86 | 0.4637 | -0.0119 | |||
| SYK / Stryker Corporation | 0.01 | 2.12 | 0.4594 | 0.4594 | |||||
| EXPD / Expeditors International of Washington, Inc. | 0.02 | -0.24 | 2.11 | 7.04 | 0.4582 | 0.0109 | |||
| PEP / PepsiCo, Inc. | 0.01 | -1.86 | 2.09 | 4.39 | 0.4540 | -0.0005 | |||
| NVO / Novo Nordisk A/S - Depositary Receipt (Common Stock) | 0.04 | -0.97 | 1.98 | -20.39 | 0.4302 | -0.1344 | |||
| C / Citigroup Inc. | 0.02 | -2.50 | 1.98 | 16.22 | 0.4290 | 0.0435 | |||
| SO / The Southern Company | 0.02 | 0.63 | 1.97 | 3.89 | 0.4280 | -0.0026 | |||
| RLI / RLI Corp. | 0.03 | -2.01 | 1.95 | -11.52 | 0.4231 | -0.0765 | |||
| LAMR / Lamar Advertising Company | 0.02 | 1.88 | 0.4077 | 0.4077 | |||||
| IWD / iShares Trust - iShares Russell 1000 Value ETF | 0.01 | -2.88 | 1.84 | 1.77 | 0.3984 | -0.0105 | |||
| CHRW / C.H. Robinson Worldwide, Inc. | 0.01 | -0.80 | 1.74 | 36.89 | 0.3783 | 0.0895 | |||
| CTRA / Coterra Energy Inc. | 0.07 | 18.68 | 1.74 | 10.57 | 0.3765 | 0.0208 | |||
| DIS / The Walt Disney Company | 0.01 | 6.76 | 1.67 | -1.48 | 0.3620 | -0.0218 | |||
| UBER / Uber Technologies, Inc. | 0.02 | -1.88 | 1.66 | 3.03 | 0.3608 | -0.0051 | |||
| GOOGL / Alphabet Inc. | 0.01 | 0.00 | 1.65 | 38.01 | 0.3582 | 0.0869 | |||
| NEE / NextEra Energy, Inc. | 0.02 | 4.45 | 1.48 | 13.56 | 0.3215 | 0.0257 | |||
| O / Realty Income Corporation | 0.02 | 5.21 | 1.44 | 10.95 | 0.3122 | 0.0183 | |||
| GILD / Gilead Sciences, Inc. | 0.01 | 0.35 | 1.38 | 0.44 | 0.2987 | -0.0120 | |||
| SHV / iShares Trust - iShares 0-1 Year Treasury Bond ETF | 0.01 | 17.21 | 1.36 | 17.30 | 0.2955 | 0.0322 | |||
| GPC / Genuine Parts Company | 0.01 | 0.21 | 1.34 | 14.54 | 0.2903 | 0.0254 | |||
| SHY / iShares Trust - iShares 1-3 Year Treasury Bond ETF | 0.02 | 29.92 | 1.27 | 30.05 | 0.2751 | 0.0541 | |||
| STZ / Constellation Brands, Inc. | 0.01 | 9.99 | 1.22 | -8.96 | 0.2645 | -0.0390 | |||
| IBM / International Business Machines Corporation | 0.00 | 4.45 | 1.11 | -0.09 | 0.2399 | -0.0109 | |||
| GPN / Global Payments Inc. | 0.01 | 1.09 | 0.2374 | 0.2374 | |||||
| OKE / ONEOK, Inc. | 0.01 | 12.55 | 1.08 | 0.65 | 0.2338 | -0.0090 | |||
| LYB / LyondellBasell Industries N.V. | 0.02 | -40.43 | 0.99 | -49.52 | 0.2152 | -0.2301 | |||
| IWF / iShares Trust - iShares Russell 1000 Growth ETF | 0.00 | -0.33 | 0.85 | 9.95 | 0.1846 | 0.0092 | |||
| BAC / Bank of America Corporation | 0.02 | 0.33 | 0.82 | 9.32 | 0.1782 | 0.0080 | |||
| CARR / Carrier Global Corporation | 0.01 | 0.16 | 0.75 | -18.31 | 0.1616 | -0.0451 | |||
| DLN / WisdomTree Trust - WisdomTree U.S. LargeCap Dividend Fund | 0.01 | 0.02 | 0.70 | 6.05 | 0.1521 | 0.0021 | |||
| SHOP / Shopify Inc. | 0.00 | 0.00 | 0.55 | 28.84 | 0.1202 | 0.0227 | |||
| META / Meta Platforms, Inc. | 0.00 | 0.00 | 0.54 | -0.55 | 0.1172 | -0.0059 | |||
| DE / Deere & Company | 0.00 | -1.72 | 0.52 | -11.66 | 0.1136 | -0.0206 | |||
| XOM / Exxon Mobil Corporation | 0.00 | -46.07 | 0.50 | -43.57 | 0.1084 | -0.0925 | |||
| SWK / Stanley Black & Decker, Inc. | 0.01 | 2.44 | 0.45 | 12.25 | 0.0975 | 0.0069 | |||
| ABBNY / ABB Ltd - Depositary Receipt (Common Stock) | 0.01 | 0.00 | 0.43 | 20.62 | 0.0927 | 0.0124 | |||
| BHP / BHP Group Limited - Depositary Receipt (Common Stock) | 0.01 | 1.04 | 0.40 | 17.25 | 0.0870 | 0.0094 | |||
| PKG / Packaging Corporation of America | 0.00 | 0.33 | 0.40 | 16.18 | 0.0857 | 0.0085 | |||
| SII / Wheaton Precious Metals Corp. | 0.00 | -1.06 | 0.38 | 23.08 | 0.0834 | 0.0127 | |||
| UNH / UnitedHealth Group Incorporated | 0.00 | -2.55 | 0.37 | 7.89 | 0.0801 | 0.0025 | |||
| RGLD / Royal Gold, Inc. | 0.00 | -0.23 | 0.34 | 12.87 | 0.0741 | 0.0053 | |||
| DVY / iShares Trust - iShares Select Dividend ETF | 0.00 | -10.77 | 0.34 | -4.52 | 0.0733 | -0.0069 | |||
| MKTX / MarketAxess Holdings Inc. | 0.00 | 16.79 | 0.33 | -8.68 | 0.0707 | -0.0103 | |||
| PYLD / PIMCO ETF Trust - PIMCO Multisector Bond Active Exchange-Traded Fund | 0.01 | 0.00 | 0.32 | 0.95 | 0.0695 | -0.0023 | |||
| SII / Sprott Inc. | 0.00 | 0.37 | 0.32 | 20.83 | 0.0692 | 0.0094 | |||
| XLF / The Select Sector SPDR Trust - State Street Financial Select Sector SPDR ETF | 0.01 | 4.08 | 0.31 | 7.37 | 0.0664 | 0.0016 | |||
| YUM / Yum! Brands, Inc. | 0.00 | 0.26 | 0.29 | 2.85 | 0.0627 | -0.0010 | |||
| NOW / ServiceNow, Inc. | 0.00 | 0.00 | 0.28 | -10.54 | 0.0609 | -0.0102 | |||
| T / AT&T Inc. | 0.01 | 0.27 | 0.0590 | 0.0590 | |||||
| DG / Dollar General Corporation | 0.00 | -9.95 | 0.24 | -18.58 | 0.0523 | -0.0149 | |||
| HUBS / HubSpot, Inc. | 0.00 | 0.00 | 0.24 | -16.08 | 0.0522 | -0.0127 | |||
| SIEGY / Siemens Aktiengesellschaft - Depositary Receipt (Common Stock) | 0.00 | 0.00 | 0.24 | 4.85 | 0.0517 | 0.0001 | |||
| QLTY / The 2023 ETF Series Trust II - GMO U.S. Quality ETF | 0.01 | 0.23 | 0.0500 | 0.0500 | |||||
| GANX / Gain Therapeutics, Inc. | 0.04 | 55.56 | 0.06 | 52.50 | 0.0134 | 0.0043 | |||
| RIG / Transocean Ltd. | 0.01 | 0.03 | 0.0068 | 0.0068 | |||||
| UPS / United Parcel Service, Inc. | 0.00 | -100.00 | 0.00 | 0.0000 | |||||
| KVUE / Kenvue Inc. | 0.00 | -100.00 | 0.00 | -100.00 | -0.0469 | ||||
| CCI / Crown Castle Inc. | 0.00 | -100.00 | 0.00 | 0.0000 |