Estatísticas Básicas
| Valor do Portfólio | $ 391,618 |
| Posições Atuais | 57 |
Últimas Participações, Desempenho, AUM (de 13F, 13D)
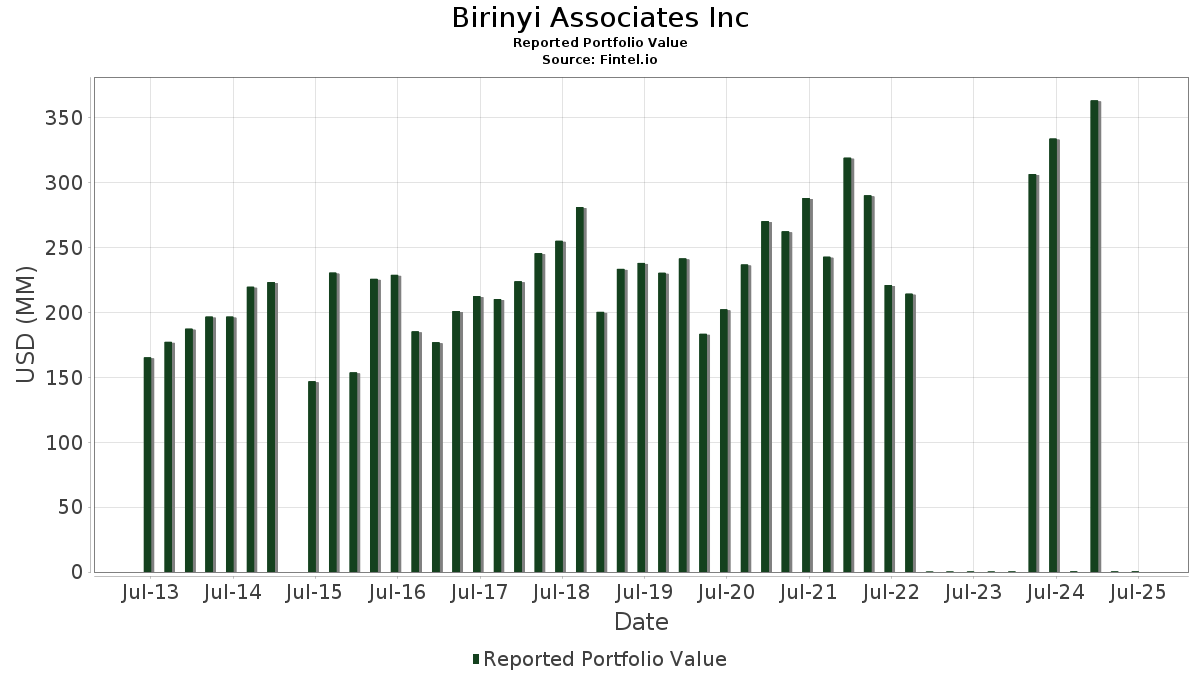
Birinyi Associates Inc divulgou 57 participações totais em seus últimos arquivamentos da SEC. O valor mais recente da carteira é calculado como $ 391,618 USD. O Ativo Total Sob Gestão (AUM) é esse valor mais o caixa (que não é divulgado). As principais posições de Birinyi Associates Inc são Apple Inc. (US:AAPL) , SPDR S&P 500 ETF (US:SPY) , Alphabet Inc. (US:GOOGL) , Amazon.com, Inc. (US:AMZN) , and Mastercard Incorporated (US:MA) . As novas posições de Birinyi Associates Inc incluem Dell Technologies Inc. (US:DELL) , .
Maiores Aumentos Este Trimestre
Usamos a mudança na alocação do portfólio porque esta é a métrica mais significativa. As mudanças podem ser devido a operações ou mudanças nos preços das ações.
| Ativo | Ações (MM) |
Valor (MM$) |
% do Portfólio | Δ% do Portfólio |
|---|---|---|---|---|
| 0.33 | 0.08 | 21.5353 | 1.5566 | |
| 0.14 | 0.04 | 8.9503 | 1.5142 | |
| 0.00 | 0.00 | 1.2134 | 1.2134 | |
| 0.00 | 0.00 | 0.7242 | 0.7242 | |
| 0.03 | 0.01 | 2.1659 | 0.7207 | |
| 0.01 | 0.00 | 0.9405 | 0.6728 | |
| 0.01 | 0.00 | 0.7643 | 0.6250 | |
| 0.02 | 0.00 | 0.5865 | 0.5865 | |
| 0.03 | 0.01 | 1.7379 | 0.2874 | |
| 0.01 | 0.00 | 0.2393 | 0.2393 |
Maiores Diminuições Este Trimestre
Usamos a mudança na alocação do portfólio porque esta é a métrica mais significativa. As mudanças podem ser devido a operações ou mudanças nos preços das ações.
| Ativo | Ações (MM) |
Valor (MM$) |
% do Portfólio | Δ% do Portfólio |
|---|---|---|---|---|
| 0.05 | 0.00 | 0.5127 | -1.1399 | |
| 0.15 | 0.03 | 8.1544 | -1.1379 | |
| 0.05 | 0.03 | 6.6072 | -0.8552 | |
| 0.05 | 0.04 | 9.0052 | -0.5635 | |
| 0.00 | 0.00 | 0.1810 | -0.5253 | |
| 0.03 | 0.02 | 4.4702 | -0.4087 | |
| 0.01 | 0.01 | 1.7435 | -0.2826 | |
| 0.02 | 0.01 | 2.1245 | -0.2707 | |
| 0.00 | 0.01 | 3.1035 | -0.2578 | |
| 0.00 | 0.00 | 0.7423 | -0.1785 |
Arquivamentos 13F e Fundo
Este formulário foi arquivado em 2025-10-29 para o período de relatório 2025-09-30. Clique no ícone de link para ver o histórico completo da transação.
Atualize para desbloquear dados premium e exportar para Excel ![]() .
.
| Ativo | Tipo | Preço Médio por Ação | Ações (MM) |
ΔAções (%) |
Valor ($MM) |
ΔAções (%) |
Portfólio (%) |
ΔPortfólio (%) |
|
|---|---|---|---|---|---|---|---|---|---|
| AAPL / Apple Inc. | 0.33 | -0.51 | 0.08 | 23.53 | 21.5353 | 1.5566 | |||
| SPY / SPDR S&P 500 ETF | 0.05 | -0.01 | 0.04 | 9.38 | 9.0052 | -0.5635 | |||
| GOOGL / Alphabet Inc. | 0.14 | -0.07 | 0.04 | 40.00 | 8.9503 | 1.5142 | |||
| AMZN / Amazon.com, Inc. | 0.15 | 0.44 | 0.03 | 0.00 | 8.1544 | -1.1379 | |||
| MA / Mastercard Incorporated | 0.05 | 0.19 | 0.03 | 0.00 | 6.6072 | -0.8552 | |||
| NVDD / Direxion Shares ETF Trust - Direxion Daily NVDA Bear 1X Shares | 0.11 | 0.40 | 0.02 | 17.65 | 5.2176 | 0.1770 | |||
| MSFT / Microsoft Corporation | 0.03 | 0.79 | 0.02 | 6.25 | 4.4702 | -0.4087 | |||
| BKNG / Booking Holdings Inc. | 0.00 | 13.40 | 0.01 | 9.09 | 3.1035 | -0.2578 | |||
| C / Citigroup Inc. | 0.10 | 1.74 | 0.01 | 25.00 | 2.7203 | 0.1518 | |||
| AVGO / Broadcom Inc. | 0.03 | 43.44 | 0.01 | 100.00 | 2.1659 | 0.7207 | |||
| BRK.A / Berkshire Hathaway Inc. | 0.02 | -1.83 | 0.01 | 0.00 | 2.1245 | -0.2707 | |||
| GSCE / GS Connect S&P GSCI Enhanced Commodity Total Return ETN | 0.01 | 4.53 | 0.01 | 16.67 | 1.9928 | 0.0520 | |||
| VOO / Vanguard Index Funds - Vanguard S&P 500 ETF | 0.01 | 19.27 | 0.01 | 40.00 | 1.9164 | 0.2094 | |||
| NFLX / Netflix, Inc. | 0.01 | 10.09 | 0.01 | 0.00 | 1.7435 | -0.2826 | |||
| GOOGL / Alphabet Inc. | 0.03 | -0.04 | 0.01 | 50.00 | 1.7379 | 0.2874 | |||
| IBM / International Business Machines Corporation | 0.02 | 27.68 | 0.01 | 20.00 | 1.6715 | 0.1049 | |||
| DIA / SPDR Dow Jones Industrial Average ETF Trust | 0.01 | -0.20 | 0.01 | 0.00 | 1.4254 | -0.1292 | |||
| BLK / BlackRock, Inc. | 0.00 | 0.00 | 1.2134 | 1.2134 | |||||
| BRK.A / Berkshire Hathaway Inc. | 0.00 | 0.00 | 0.00 | 0.00 | 1.1555 | -0.1236 | |||
| MCD / McDonald's Corporation | 0.01 | 0.42 | 0.00 | 0.00 | 1.1187 | -0.1080 | |||
| META / Meta Platforms, Inc. | 0.01 | 304.44 | 0.00 | 0.9405 | 0.6728 | ||||
| UBER / Uber Technologies, Inc. | 0.03 | 4.61 | 0.00 | 0.00 | 0.8715 | -0.0373 | |||
| JPM / JPMorgan Chase & Co. | 0.01 | 0.02 | 0.00 | 0.00 | 0.8631 | -0.0454 | |||
| WMT / Walmart Inc. | 0.03 | 0.00 | 0.00 | 50.00 | 0.7712 | -0.0668 | |||
| TSLA / Tesla, Inc. | 0.01 | 348.67 | 0.00 | 0.7643 | 0.6250 | ||||
| COST / Costco Wholesale Corporation | 0.00 | -1.26 | 0.00 | -33.33 | 0.7423 | -0.1785 | |||
| AZO / AutoZone, Inc. | 0.00 | 0.00 | 0.7242 | 0.7242 | |||||
| AXP / American Express Company | 0.01 | -0.62 | 0.00 | 0.00 | 0.6149 | -0.0658 | |||
| DELL / Dell Technologies Inc. | 0.02 | 0.00 | 0.5865 | 0.5865 | |||||
| CMG / Chipotle Mexican Grill, Inc. | 0.05 | -49.07 | 0.00 | -60.00 | 0.5127 | -1.1399 | |||
| CAT / Caterpillar Inc. | 0.00 | 0.00 | 0.00 | 0.00 | 0.3654 | 0.0246 | |||
| HD / The Home Depot, Inc. | 0.00 | 0.00 | 0.00 | 0.00 | 0.3105 | -0.0112 | |||
| XLV / The Select Sector SPDR Trust - State Street Health Care Select Sector SPDR ETF | 0.01 | -10.86 | 0.00 | 0.00 | 0.2919 | -0.0714 | |||
| PG / The Procter & Gamble Company | 0.01 | -10.16 | 0.00 | 0.00 | 0.2771 | -0.0891 | |||
| AMGN / Amgen Inc. | 0.00 | 0.00 | 0.00 | 0.00 | 0.2758 | -0.0369 | |||
| LRCX / Lam Research Corporation | 0.01 | 0.00 | 0.2393 | 0.2393 | |||||
| CRM / Salesforce, Inc. | 0.00 | 0.00 | 0.00 | -100.00 | 0.2334 | -0.0743 | |||
| LMT / Lockheed Martin Corporation | 0.00 | 0.00 | 0.00 | 0.2296 | -0.0144 | ||||
| V / Visa Inc. | 0.00 | 12.50 | 0.00 | 0.2158 | -0.0127 | ||||
| BX / Blackstone Inc. | 0.00 | 0.17 | 0.00 | 0.2071 | 0.0000 | ||||
| LLY / Eli Lilly and Company | 0.00 | 0.00 | 0.00 | 0.2056 | -0.0349 | ||||
| DE / Deere & Company | 0.00 | -67.37 | 0.00 | -100.00 | 0.1810 | -0.5253 | |||
| MU / Micron Technology, Inc. | 0.00 | 0.00 | 0.00 | 0.1698 | 0.0265 | ||||
| MSCI / MSCI Inc. | 0.00 | 0.00 | 0.00 | 0.1448 | -0.0240 | ||||
| CVX / Chevron Corporation | 0.00 | 0.00 | 0.00 | 0.1407 | -0.0079 | ||||
| AIQ / Global X Funds - Global X Artificial Intelligence & Technology ETF | 0.01 | 0.00 | 0.00 | 0.1394 | -0.0019 | ||||
| NVR / NVR, Inc. | 0.00 | 28.30 | 0.00 | 0.1394 | 0.0248 | ||||
| SBUX / Starbucks Corporation | 0.01 | 0.00 | 0.00 | 0.1351 | -0.0325 | ||||
| UNH / UnitedHealth Group Incorporated | 0.00 | 0.00 | 0.00 | 0.1190 | -0.0041 | ||||
| AB / AllianceBernstein Holding L.P. - Limited Partnership | 0.01 | -5.82 | 0.00 | 0.0942 | -0.0283 | ||||
| ORCL / Oracle Corporation | 0.00 | 0.00 | 0.00 | 0.0935 | 0.0104 | ||||
| QCOM / QUALCOMM Incorporated | 0.00 | 0.00 | 0.00 | 0.0850 | -0.0083 | ||||
| PM / Philip Morris International Inc. | 0.00 | 0.00 | 0.00 | 0.0621 | -0.0178 | ||||
| AIG / American International Group, Inc. | 0.00 | 0.00 | 0.00 | 0.0608 | -0.0150 | ||||
| CSCO / Cisco Systems, Inc. | 0.00 | 0.00 | 0.00 | 0.0580 | -0.0096 | ||||
| MO / Altria Group, Inc. | 0.00 | 0.00 | 0.0539 | 0.0539 | |||||
| AMD / Advanced Micro Devices, Inc. | 0.00 | 0.00 | 0.0516 | 0.0516 | |||||
| C.WSA / Citigroup, Inc. | 0.00 | -100.00 | 0.00 | 0.0000 | |||||
| TXRH / Texas Roadhouse, Inc. | 0.00 | -100.00 | 0.00 | 0.0000 | |||||
| PEP / PepsiCo, Inc. | 0.00 | -100.00 | 0.00 | 0.0000 | |||||
| LRCX / Lam Research Corporation | 0.00 | -100.00 | 0.00 | 0.0000 |