Estatísticas Básicas
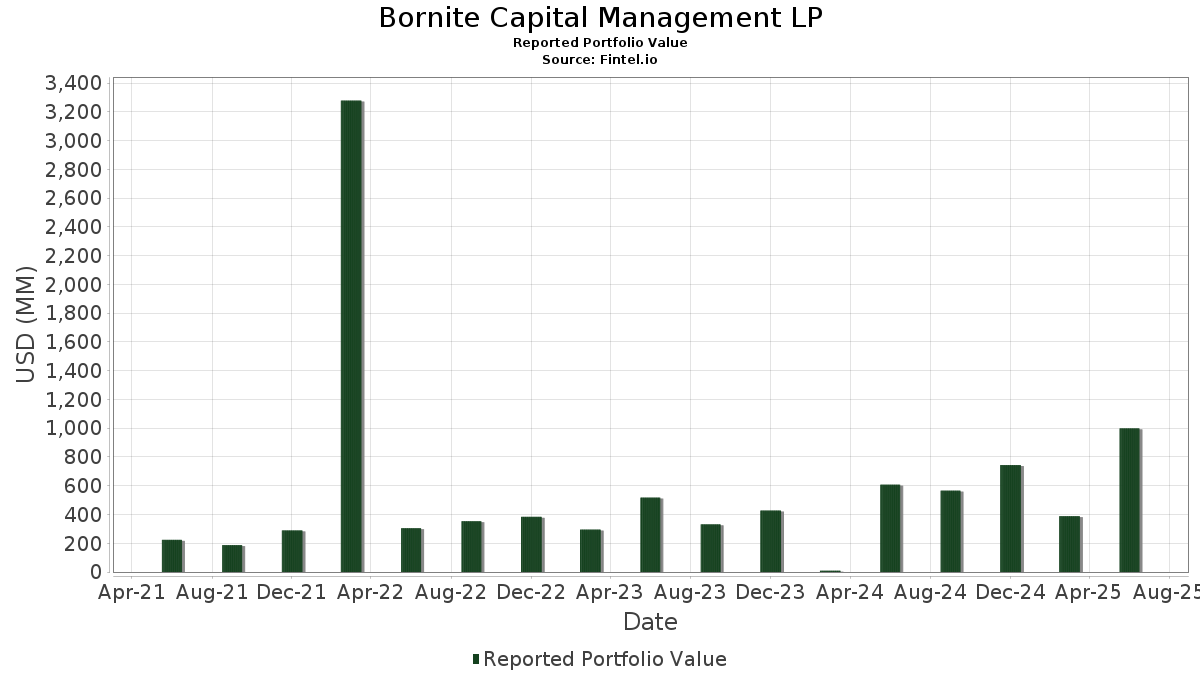
| Valor do Portfólio | $ 1,076,927,510 |
| Posições Atuais | 35 |
Últimas Participações, Desempenho, AUM (de 13F, 13D)
Bornite Capital Management LP divulgou 35 participações totais em seus últimos arquivamentos da SEC. O valor mais recente da carteira é calculado como $ 1,076,927,510 USD. O Ativo Total Sob Gestão (AUM) é esse valor mais o caixa (que não é divulgado). As principais posições de Bornite Capital Management LP são Ecolab Inc. (US:ECL) , Corning Incorporated (US:GLW) , Talen Energy Corporation (US:TLN) , Quanta Services, Inc. (US:PWR) , and Carpenter Technology Corporation (US:CRS) . As novas posições de Bornite Capital Management LP incluem Dycom Industries, Inc. (US:DY) , Viper Energy, Inc. (US:VNOM) , Barrick Mining Corporation (US:B) , Carrier Global Corporation (US:CARR) , and Taiwan Semiconductor Manufacturing Company Limited - Depositary Receipt (Common Stock) (US:TSM) .
Maiores Aumentos Este Trimestre
Usamos a mudança na alocação do portfólio porque esta é a métrica mais significativa. As mudanças podem ser devido a operações ou mudanças nos preços das ações.
| Ativo | Ações (MM) |
Valor (MM$) |
% do Portfólio | Δ% do Portfólio |
|---|---|---|---|---|
| 0.25 | 68.47 | 6.3574 | 6.3574 | |
| 0.83 | 68.08 | 6.3221 | 6.3221 | |
| 1.00 | 53.83 | 4.9985 | 4.9985 | |
| 0.50 | 47.15 | 4.3782 | 4.3782 | |
| 0.15 | 43.76 | 4.0638 | 4.0638 | |
| 1.00 | 38.22 | 3.5490 | 3.5490 | |
| 1.00 | 32.77 | 3.0429 | 3.0429 | |
| 0.03 | 29.97 | 2.7832 | 2.7832 | |
| 0.50 | 29.85 | 2.7718 | 2.7718 | |
| 0.10 | 27.93 | 2.5934 | 2.5934 |
Maiores Diminuições Este Trimestre
Usamos a mudança na alocação do portfólio porque esta é a métrica mais significativa. As mudanças podem ser devido a operações ou mudanças nos preços das ações.
| Ativo | Ações (MM) |
Valor (MM$) |
% do Portfólio | Δ% do Portfólio |
|---|---|---|---|---|
| 0.00 | 0.00 | -3.6263 | ||
| 0.00 | 0.00 | -3.6101 | ||
| 0.50 | 11.63 | 1.0799 | -3.3425 | |
| 0.00 | 0.00 | -3.3242 | ||
| 0.00 | 0.00 | -3.1635 | ||
| 0.00 | 0.00 | -2.3320 | ||
| 0.00 | 0.00 | -1.7643 | ||
| 0.00 | 0.00 | -1.6630 | ||
| 0.10 | 16.34 | 1.5173 | -1.5118 | |
| 0.03 | 14.22 | 1.3204 | -1.4925 |
Arquivamentos 13F e Fundo
Este formulário foi arquivado em 2025-11-07 para o período de relatório 2025-09-30. Clique no ícone de link para ver o histórico completo da transação.
Atualize para desbloquear dados premium e exportar para Excel ![]() .
.
| Ativo | Tipo | Preço Médio por Ação | Ações (MM) |
ΔAções (%) |
Valor ($MM) |
ΔAções (%) |
Portfólio (%) |
ΔPortfólio (%) |
|
|---|---|---|---|---|---|---|---|---|---|
| ECL / Ecolab Inc. | 0.25 | 68.47 | 6.3574 | 6.3574 | |||||
| GLW / Corning Incorporated | 0.83 | 68.08 | 6.3221 | 6.3221 | |||||
| TLN / Talen Energy Corporation | 0.16 | 1.36 | 66.36 | 48.29 | 6.1619 | 1.6818 | |||
| PWR / Quanta Services, Inc. | 0.16 | 51.31 | 64.53 | 65.86 | 5.9916 | 2.0967 | |||
| CRS / Carpenter Technology Corporation | 0.26 | 72.60 | 63.57 | 53.34 | 5.9029 | 1.7524 | |||
| CRH / CRH plc | 0.47 | 30.10 | 56.33 | 69.93 | 5.2305 | 1.9118 | |||
| CNM / Core & Main, Inc. | 1.00 | 53.83 | 4.9985 | 4.9985 | |||||
| CNI / Canadian National Railway Company | 0.50 | 47.15 | 4.3782 | 4.3782 | |||||
| DY / Dycom Industries, Inc. | 0.15 | 43.76 | 4.0638 | 4.0638 | |||||
| VNOM / Viper Energy, Inc. | 1.00 | 38.22 | 3.5490 | 3.5490 | |||||
| ETN / Eaton Corporation plc | 0.10 | -3.01 | 37.42 | 1.68 | 3.4752 | -0.2097 | |||
| GFL / GFL Environmental Inc. | 0.74 | 3.04 | 35.17 | -3.25 | 3.2662 | -0.3736 | |||
| B / Barrick Mining Corporation | 1.00 | 32.77 | 3.0429 | 3.0429 | |||||
| NFLX / Netflix, Inc. | 0.03 | 29.97 | 2.7832 | 2.7832 | |||||
| CARR / Carrier Global Corporation | 0.50 | 29.85 | 2.7718 | 2.7718 | |||||
| META / Meta Platforms, Inc. | 0.04 | -20.00 | 29.38 | -20.40 | 2.7277 | -0.9670 | |||
| IAG / IAMGOLD Corporation | 2.24 | -51.70 | 28.96 | -15.04 | 2.6894 | -0.7235 | |||
| TSM / Taiwan Semiconductor Manufacturing Company Limited - Depositary Receipt (Common Stock) | 0.10 | 27.93 | 2.5934 | 2.5934 | |||||
| HLT / Hilton Worldwide Holdings Inc. | 0.10 | 25.94 | 2.4091 | 2.4091 | |||||
| LNG / Cheniere Energy, Inc. | 0.11 | -15.71 | 25.59 | -18.67 | 2.3761 | -0.7738 | |||
| FSLR / First Solar, Inc. | 0.10 | 22.05 | 2.0478 | 2.0478 | |||||
| AMZN / Amazon.com, Inc. | 0.10 | -33.33 | 21.96 | -33.28 | 2.0389 | -1.2558 | |||
| COF / Capital One Financial Corporation | 0.10 | 21.26 | 1.9739 | 1.9739 | |||||
| CVNA / Carvana Co. | 0.05 | 18.86 | 1.7515 | 1.7515 | |||||
| SPOT / Spotify Technology S.A. | 0.03 | 17.45 | 1.6204 | 1.6204 | |||||
| LYV / Live Nation Entertainment, Inc. | 0.10 | -50.00 | 16.34 | -45.99 | 1.5173 | -1.5118 | |||
| SHOP / Shopify Inc. | 0.10 | 14.86 | 1.3799 | 1.3799 | |||||
| MA / Mastercard Incorporated | 0.03 | -50.00 | 14.22 | -49.39 | 1.3204 | -1.4925 | |||
| NOW / ServiceNow, Inc. | 0.01 | 13.80 | 1.2818 | 1.2818 | |||||
| SNPS / Synopsys, Inc. | 0.03 | 12.33 | 1.1454 | 1.1454 | |||||
| MIR / Mirion Technologies, Inc. | 0.50 | -75.63 | 11.63 | -73.67 | 1.0799 | -3.3425 | |||
| SOBO / South Bow Corporation | 0.40 | 0.00 | 11.32 | 9.19 | 1.0508 | 0.0132 | |||
| DAR / Darling Ingredients Inc. | 0.10 | 3.09 | 0.2866 | 0.2866 | |||||
| TT / Trane Technologies plc | 0.01 | 2.36 | 0.2194 | 0.2194 | |||||
| TMQ / Trilogy Metals Inc. | 1.00 | 0.00 | 2.10 | 55.56 | 0.1950 | 0.0598 | |||
| GEV / GE Vernova Inc. | 0.00 | -100.00 | 0.00 | 0.0000 | |||||
| GOOGL / Alphabet Inc. | 0.00 | -100.00 | 0.00 | -100.00 | -1.7643 | ||||
| GE / General Electric Company | 0.00 | -100.00 | 0.00 | -100.00 | -3.3242 | ||||
| STLD / Steel Dynamics, Inc. | 0.00 | -100.00 | 0.00 | -100.00 | -1.2816 | ||||
| MPC / Marathon Petroleum Corporation | 0.00 | -100.00 | 0.00 | -100.00 | -1.6630 | ||||
| NUE / Nucor Corporation | 0.00 | -100.00 | 0.00 | 0.0000 | |||||
| CDNS / Cadence Design Systems, Inc. | 0.00 | -100.00 | 0.00 | 0.0000 | |||||
| SHW / The Sherwin-Williams Company | 0.00 | -100.00 | 0.00 | 0.0000 | |||||
| TTEK / Tetra Tech, Inc. | 0.00 | -100.00 | 0.00 | 0.0000 | |||||
| HD / The Home Depot, Inc. | 0.00 | -100.00 | 0.00 | 0.0000 | |||||
| BKR / Baker Hughes Company | 0.00 | -100.00 | 0.00 | 0.0000 | |||||
| FCX / Freeport-McMoRan Inc. | 0.00 | -100.00 | 0.00 | 0.0000 | |||||
| NG / NovaGold Resources Inc. | 0.00 | -100.00 | 0.00 | 0.0000 | |||||
| CSX / CSX Corporation | 0.00 | -100.00 | 0.00 | 0.0000 | |||||
| EQT / EQT Corporation | 0.00 | -100.00 | 0.00 | -100.00 | -3.6101 | ||||
| BE / Bloom Energy Corporation | 0.00 | -100.00 | 0.00 | 0.0000 | |||||
| ETR / Entergy Corporation | 0.00 | -100.00 | 0.00 | 0.0000 | |||||
| CYBR / CyberArk Software Ltd. | 0.00 | -100.00 | 0.00 | 0.0000 | |||||
| CAT / Caterpillar Inc. | 0.00 | -100.00 | 0.00 | -100.00 | -2.3320 | ||||
| LIN / Linde plc | 0.00 | -100.00 | 0.00 | -100.00 | -3.6263 | ||||
| NVDA / NVIDIA Corporation | 0.00 | -100.00 | 0.00 | -100.00 | -3.1635 |