Estatísticas Básicas
| Valor do Portfólio | $ 197,273,427 |
| Posições Atuais | 104 |
Últimas Participações, Desempenho, AUM (de 13F, 13D)
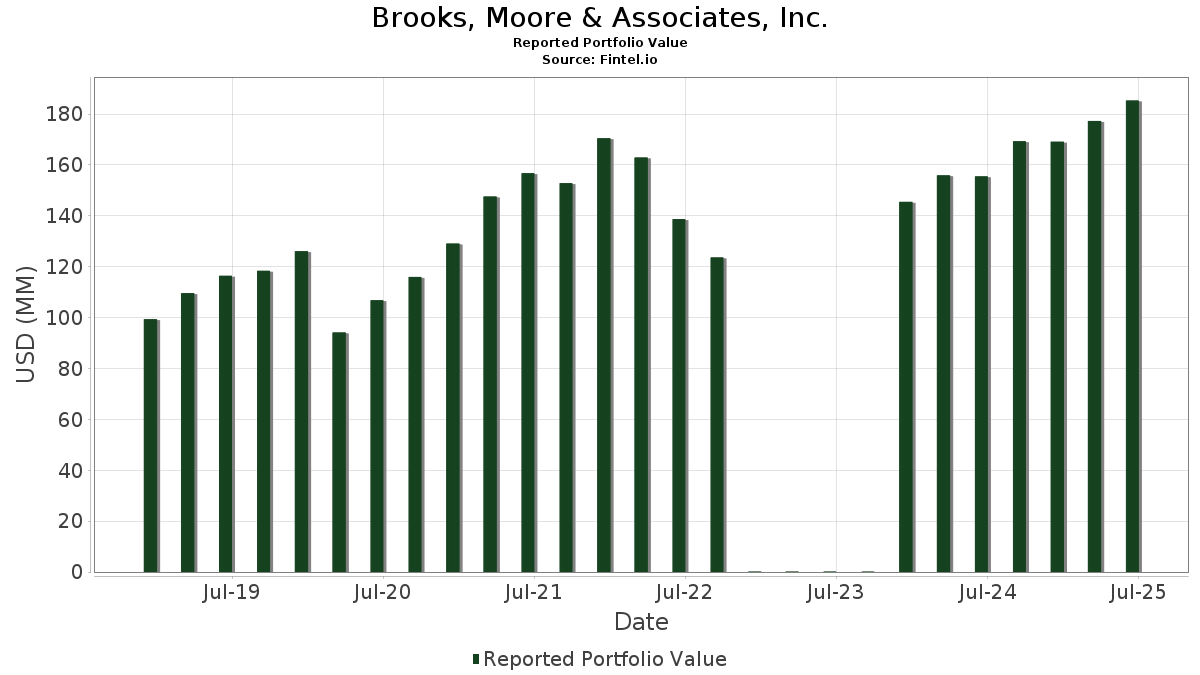
Brooks, Moore & Associates, Inc. divulgou 104 participações totais em seus últimos arquivamentos da SEC. O valor mais recente da carteira é calculado como $ 197,273,427 USD. O Ativo Total Sob Gestão (AUM) é esse valor mais o caixa (que não é divulgado). As principais posições de Brooks, Moore & Associates, Inc. são Microsoft Corporation (US:MSFT) , JPMorgan Chase & Co. (US:JPM) , Vanguard Whitehall Funds - Vanguard International High Dividend Yield ETF (US:VYMI) , AbbVie Inc. (US:ABBV) , and Johnson & Johnson (US:JNJ) . As novas posições de Brooks, Moore & Associates, Inc. incluem InterDigital, Inc. (US:IDCC) , Caterpillar Inc. (US:CAT) , .
Maiores Aumentos Este Trimestre
Usamos a mudança na alocação do portfólio porque esta é a métrica mais significativa. As mudanças podem ser devido a operações ou mudanças nos preços das ações.
| Ativo | Ações (MM) |
Valor (MM$) |
% do Portfólio | Δ% do Portfólio |
|---|---|---|---|---|
| 0.01 | 7.44 | 3.7707 | 3.4025 | |
| 0.04 | 3.29 | 1.6667 | 1.5160 | |
| 0.04 | 3.46 | 1.7523 | 1.3715 | |
| 0.04 | 1.79 | 0.9081 | 0.9081 | |
| 0.03 | 6.29 | 3.1904 | 0.6284 | |
| 0.03 | 6.55 | 3.3207 | 0.4142 | |
| 0.00 | 1.31 | 0.6652 | 0.3390 | |
| 0.02 | 5.17 | 2.6205 | 0.3262 | |
| 0.02 | 0.82 | 0.4140 | 0.2052 | |
| 0.01 | 0.74 | 0.3742 | 0.1612 |
Maiores Diminuições Este Trimestre
Usamos a mudança na alocação do portfólio porque esta é a métrica mais significativa. As mudanças podem ser devido a operações ou mudanças nos preços das ações.
| Ativo | Ações (MM) |
Valor (MM$) |
% do Portfólio | Δ% do Portfólio |
|---|---|---|---|---|
| 0.02 | 1.76 | 0.8938 | -2.9493 | |
| 0.01 | 0.72 | 0.3670 | -1.2323 | |
| 0.03 | 2.70 | 1.3699 | -0.6181 | |
| 0.01 | 0.79 | 0.4024 | -0.5521 | |
| 0.02 | 9.89 | 5.0156 | -0.5488 | |
| 0.00 | 0.30 | 0.1498 | -0.5205 | |
| 0.09 | 6.28 | 3.1823 | -0.2902 | |
| 0.03 | 8.90 | 4.5119 | -0.2895 | |
| 0.02 | 1.66 | 0.8392 | -0.2741 | |
| 0.02 | 4.12 | 2.0871 | -0.1897 |
Arquivamentos 13F e Fundo
Este formulário foi arquivado em 2025-11-17 para o período de relatório 2025-09-30. Clique no ícone de link para ver o histórico completo da transação.
Atualize para desbloquear dados premium e exportar para Excel ![]() .
.
| Ativo | Tipo | Preço Médio por Ação | Ações (MM) |
ΔAções (%) |
Valor ($MM) |
ΔAções (%) |
Portfólio (%) |
ΔPortfólio (%) |
|
|---|---|---|---|---|---|---|---|---|---|
| MSFT / Microsoft Corporation | 0.02 | -1.16 | 9.89 | -4.04 | 5.0156 | -0.5488 | |||
| JPM / JPMorgan Chase & Co. | 0.03 | -6.05 | 8.90 | 0.03 | 4.5119 | -0.2895 | |||
| VYMI / Vanguard Whitehall Funds - Vanguard International High Dividend Yield ETF | 0.01 | 42.40 | 7.44 | 990.62 | 3.7707 | 3.4025 | |||
| ABBV / AbbVie Inc. | 0.03 | -0.70 | 6.55 | 21.61 | 3.3207 | 0.4142 | |||
| JNJ / Johnson & Johnson | 0.04 | -1.34 | 6.53 | 11.07 | 3.3122 | 0.1369 | |||
| GOOGL / Alphabet Inc. | 0.03 | 4.65 | 6.29 | 32.57 | 3.1904 | 0.6284 | |||
| KO / The Coca-Cola Company | 0.09 | -0.13 | 6.28 | -2.44 | 3.1823 | -0.2902 | |||
| ABT / Abbott Laboratories | 0.04 | -0.85 | 5.19 | 5.23 | 2.6294 | -0.0306 | |||
| APC / Apple Inc. | 0.02 | -0.88 | 5.17 | 21.59 | 2.6205 | 0.3262 | |||
| WMT / Walmart Inc. | 0.05 | -1.33 | 5.16 | 3.78 | 2.6138 | -0.0673 | |||
| XOM / Exxon Mobil Corporation | 0.04 | 5.38 | 5.02 | 6.42 | 2.5471 | -0.0006 | |||
| CVX / Chevron Corporation | 0.03 | -0.25 | 4.99 | 2.15 | 2.5313 | -0.1067 | |||
| HD / The Home Depot, Inc. | 0.01 | -2.12 | 4.31 | 7.91 | 2.1862 | 0.0293 | |||
| HON / Honeywell International Inc. | 0.02 | 3.08 | 4.12 | -2.42 | 2.0871 | -0.1897 | |||
| ORCL / Oracle Corporation | 0.01 | -6.73 | 4.07 | 3.38 | 2.0632 | -0.0618 | |||
| JPST / J.P. Morgan Exchange-Traded Fund Trust - JPMorgan Ultra-Short Income ETF | 0.08 | 1.76 | 3.81 | 1.93 | 1.9308 | -0.0855 | |||
| CSCO / Cisco Systems, Inc. | 0.06 | -1.31 | 3.77 | -0.81 | 1.9131 | -0.1404 | |||
| PEP / PepsiCo, Inc. | 0.03 | -1.23 | 3.55 | 0.60 | 1.7981 | -0.1051 | |||
| VXUS / Vanguard STAR Funds - Vanguard Total International Stock ETF | 0.04 | 277.05 | 3.46 | 390.21 | 1.7523 | 1.3715 | |||
| VYM / Vanguard Whitehall Funds - Vanguard High Dividend Yield ETF | 0.04 | 1,778.42 | 3.29 | 1,078.14 | 1.6667 | 1.5160 | |||
| DGRW / WisdomTree Trust - WisdomTree U.S. Quality Dividend Growth Fund | 0.04 | 0.00 | 3.27 | 0.00 | 1.6588 | -0.1071 | |||
| IBM / International Business Machines Corporation | 0.01 | 1.31 | 3.17 | 12.91 | 1.6094 | 0.0920 | |||
| QCOM / QUALCOMM Incorporated | 0.02 | -1.12 | 2.95 | 12.06 | 1.4933 | 0.0750 | |||
| MRK / Merck & Co., Inc. | 0.03 | -31.72 | 2.70 | -26.64 | 1.3699 | -0.6181 | |||
| LOW / Lowe's Companies, Inc. | 0.01 | -4.00 | 2.65 | 7.89 | 1.3458 | 0.0181 | |||
| LLY / Eli Lilly and Company | 0.00 | 1.11 | 2.42 | 4.21 | 1.2292 | -0.0261 | |||
| LMT / Lockheed Martin Corporation | 0.00 | -0.43 | 2.32 | 18.08 | 1.1760 | 0.1157 | |||
| GBIL / Goldman Sachs ETF Trust - Goldman Sachs Access Treasury 0-1 Year ETF | 0.02 | -3.36 | 2.30 | -3.27 | 1.1681 | -0.1174 | |||
| PG / The Procter & Gamble Company | 0.01 | -1.11 | 2.28 | 0.93 | 1.1552 | -0.0628 | |||
| CB / Chubb Limited | 0.01 | -0.85 | 2.27 | 5.18 | 1.1529 | -0.0139 | |||
| PNFP / Pinnacle Financial Partners, Inc. | 0.02 | 0.10 | 2.27 | 6.82 | 1.1511 | 0.0039 | |||
| BINC / BlackRock ETF Trust II - iShares Flexible Income Active ETF | 0.04 | 20.35 | 2.24 | 21.50 | 1.1347 | 0.1404 | |||
| BAC / Bank of America Corporation | 0.04 | -1.94 | 2.02 | 7.00 | 1.0238 | 0.0054 | |||
| RTX / RTX Corporation | 0.01 | 7.15 | 1.94 | 13.77 | 0.9841 | 0.0634 | |||
| NSC / Norfolk Southern Corporation | 0.01 | 8.45 | 1.90 | 17.18 | 0.9615 | 0.0881 | |||
| SO / The Southern Company | 0.02 | 1.09 | 1.83 | 1.44 | 0.9287 | -0.0463 | |||
| PYPL / PayPal Holdings, Inc. | 0.03 | 3.22 | 1.79 | 0.67 | 0.9090 | -0.0523 | |||
| VZ / Verizon Communications Inc. | 0.04 | 1.79 | 0.9081 | 0.9081 | |||||
| VOO / Vanguard Index Funds - Vanguard S&P 500 ETF | 0.02 | 79.98 | 1.76 | -75.24 | 0.8938 | -2.9493 | |||
| SHEL / Shell plc - Depositary Receipt (Common Stock) | 0.02 | -18.99 | 1.66 | -19.74 | 0.8392 | -0.2741 | |||
| COF / Capital One Financial Corporation | 0.01 | -0.53 | 1.61 | -1.65 | 0.8154 | -0.0672 | |||
| DUK / Duke Energy Corporation | 0.01 | -0.60 | 1.54 | 1.12 | 0.7799 | -0.0411 | |||
| BRK.A / Berkshire Hathaway Inc. | 0.00 | 0.00 | 1.51 | 4.79 | 0.7646 | -0.0123 | |||
| MDLZ / Mondelez International, Inc. | 0.02 | -1.46 | 1.44 | -4.83 | 0.7285 | -0.0865 | |||
| TJX / The TJX Companies, Inc. | 0.01 | 0.00 | 1.43 | 16.03 | 0.7232 | 0.0599 | |||
| AXP / American Express Company | 0.00 | 5.10 | 1.37 | 16.61 | 0.6943 | 0.0606 | |||
| NEE / NextEra Energy, Inc. | 0.02 | -1.65 | 1.35 | 4.49 | 0.6848 | -0.0129 | |||
| TFC / Truist Financial Corporation | 0.03 | -1.01 | 1.35 | 3.54 | 0.6820 | -0.0192 | |||
| FNDF / Schwab Strategic Trust - Schwab Fundamental International Equity ETF | 0.03 | -3.25 | 1.34 | 3.87 | 0.6805 | -0.0169 | |||
| GE / General Electric Company | 0.00 | -5.94 | 1.32 | 4.35 | 0.6694 | -0.0134 | |||
| SCHD / Schwab Strategic Trust - Schwab U.S. Dividend Equity ETF | 0.00 | -91.39 | 1.31 | 117.22 | 0.6652 | 0.3390 | |||
| AGG / iShares Trust - iShares Core U.S. Aggregate Bond ETF | 0.01 | 0.00 | 1.26 | 1.69 | 0.6403 | -0.0303 | |||
| WFC / Wells Fargo & Company | 0.01 | 1.51 | 1.13 | 5.51 | 0.5730 | -0.0051 | |||
| AVGO / Broadcom Inc. | 0.00 | 0.00 | 1.08 | 12.33 | 0.5452 | 0.0285 | |||
| IVV / iShares Trust - iShares Core S&P 500 ETF | 0.00 | 0.00 | 1.02 | 5.37 | 0.5174 | -0.0051 | |||
| PM / Philip Morris International Inc. | 0.01 | -7.36 | 0.97 | -8.36 | 0.4892 | -0.0794 | |||
| IXN / iShares Trust - iShares Global Tech ETF | 0.01 | 0.00 | 0.93 | 7.66 | 0.4709 | 0.0052 | |||
| MO / Altria Group, Inc. | 0.01 | 0.00 | 0.92 | 6.64 | 0.4640 | 0.0008 | |||
| CSX / CSX Corporation | 0.02 | 0.00 | 0.84 | -0.12 | 0.4273 | -0.0280 | |||
| NEAR / iShares U.S. ETF Trust - iShares Short Duration Bond Active ETF | 0.02 | 110.23 | 0.82 | 111.40 | 0.4140 | 0.2052 | |||
| DD / DuPont de Nemours, Inc. | 0.01 | -1.65 | 0.81 | 6.58 | 0.4110 | 0.0004 | |||
| VCSH / Vanguard Scottsdale Funds - Vanguard Short-Term Corporate Bond ETF | 0.01 | -51.56 | 0.79 | -55.15 | 0.4024 | -0.5521 | |||
| DG / Dollar General Corporation | 0.01 | 1.34 | 0.78 | -0.13 | 0.3976 | -0.0264 | |||
| EMR / Emerson Electric Co. | 0.01 | -7.79 | 0.78 | -16.83 | 0.3935 | -0.1104 | |||
| BRK.B / Berkshire Hathaway Inc. | 0.00 | 0.00 | 0.75 | 6.57 | 0.3784 | 0.0003 | |||
| VTI / Vanguard Index Funds - Vanguard Total Stock Market ETF | 0.01 | 1,063.99 | 0.74 | 87.31 | 0.3742 | 0.1612 | |||
| VCIT / Vanguard Scottsdale Funds - Vanguard Intermediate-Term Corporate Bond ETF | 0.01 | -76.15 | 0.72 | -75.57 | 0.3670 | -1.2323 | |||
| DGRS / WisdomTree Trust - WisdomTree U.S. SmallCap Quality Dividend Growth Fund | 0.02 | 0.00 | 0.72 | 0.00 | 0.3653 | -0.0236 | |||
| UNP / Union Pacific Corporation | 0.00 | -0.85 | 0.69 | 5.66 | 0.3503 | -0.0029 | |||
| GIS / General Mills, Inc. | 0.01 | -0.80 | 0.63 | 2.28 | 0.3189 | -0.0135 | |||
| AMZN / Amazon.com, Inc. | 0.00 | -4.38 | 0.62 | -10.36 | 0.3161 | -0.0591 | |||
| GEV / GE Vernova Inc. | 0.00 | 0.00 | 0.58 | -6.86 | 0.2964 | -0.0424 | |||
| KLAC / KLA Corporation | 0.00 | -16.00 | 0.57 | 3.10 | 0.2870 | -0.0094 | |||
| HDV / iShares Trust - iShares Core High Dividend ETF | 0.00 | 0.00 | 0.51 | 3.43 | 0.2603 | -0.0074 | |||
| EHC / Encompass Health Corporation | 0.00 | -14.72 | 0.45 | -1.53 | 0.2283 | -0.0188 | |||
| SLB / SLB N.V. | 0.01 | -12.06 | 0.44 | -10.69 | 0.2250 | -0.0428 | |||
| IAU / iShares Gold Trust | 0.01 | 0.13 | 0.43 | 17.66 | 0.2195 | 0.0206 | |||
| AZO / AutoZone, Inc. | 0.00 | 0.00 | 0.43 | 14.10 | 0.2175 | 0.0141 | |||
| SMBK / SmartFinancial, Inc. | 0.01 | 0.00 | 0.41 | 4.38 | 0.2056 | -0.0043 | |||
| RF / Regions Financial Corporation | 0.02 | 0.00 | 0.40 | 3.93 | 0.2016 | -0.0046 | |||
| UNM / Unum Group | 0.01 | 0.00 | 0.40 | 8.20 | 0.2010 | 0.0034 | |||
| RSPU / Invesco Exchange-Traded Fund Trust - Invesco S&P 500 Equal Weight Utilities ETF | 0.01 | -1.47 | 0.39 | 0.79 | 0.1957 | -0.0110 | |||
| GD / General Dynamics Corporation | 0.00 | 0.00 | 0.38 | 9.25 | 0.1920 | 0.0052 | |||
| VMC / Vulcan Materials Company | 0.00 | 0.00 | 0.37 | 12.16 | 0.1871 | 0.0093 | |||
| ENB / Enbridge Inc. | 0.01 | 0.00 | 0.37 | 11.59 | 0.1855 | 0.0083 | |||
| NVDA / NVIDIA Corporation | 0.00 | -15.66 | 0.36 | -11.63 | 0.1814 | -0.0369 | |||
| V / Visa Inc. | 0.00 | 0.00 | 0.35 | -1.13 | 0.1770 | -0.0137 | |||
| AMD / Advanced Micro Devices, Inc. | 0.00 | 1.19 | 0.34 | -7.30 | 0.1744 | -0.0255 | |||
| MCD / McDonald's Corporation | 0.00 | 0.00 | 0.32 | 1.26 | 0.1636 | -0.0084 | |||
| BMY / Bristol-Myers Squibb Company | 0.01 | 0.00 | 0.32 | 4.21 | 0.1633 | -0.0036 | |||
| APD / Air Products and Chemicals, Inc. | 0.00 | 0.00 | 0.31 | -5.44 | 0.1590 | -0.0198 | |||
| MMM / 3M Company | 0.00 | 0.00 | 0.30 | 3.75 | 0.1545 | -0.0037 | |||
| QQQ / Invesco QQQ Trust, Series 1 | 0.00 | 0.00 | 0.30 | 6.32 | 0.1537 | -0.0003 | |||
| SPY / SPDR S&P 500 ETF | 0.00 | 6.67 | 0.30 | -76.25 | 0.1498 | -0.5205 | |||
| PSX / Phillips 66 | 0.00 | -0.80 | 0.27 | 9.31 | 0.1369 | 0.0034 | |||
| GOOG / Alphabet Inc. | 0.00 | 0.00 | 0.27 | 25.94 | 0.1358 | 0.0213 | |||
| WM / Waste Management, Inc. | 0.00 | 0.00 | 0.26 | -3.68 | 0.1330 | -0.0139 | |||
| AMP / Ameriprise Financial, Inc. | 0.00 | 0.00 | 0.25 | -5.41 | 0.1245 | -0.0153 | |||
| IDCC / InterDigital, Inc. | 0.00 | 0.23 | 0.1181 | 0.1181 | |||||
| UNH / UnitedHealth Group Incorporated | 0.00 | 0.22 | 0.1115 | 0.1115 | |||||
| TMO / Thermo Fisher Scientific Inc. | 0.00 | 0.00 | 0.22 | 3.37 | 0.1094 | -0.0029 | |||
| EPD / Enterprise Products Partners L.P. - Limited Partnership | 0.01 | 0.00 | 0.21 | 0.97 | 0.1056 | -0.0058 | |||
| RSG / Republic Services, Inc. | 0.00 | 0.00 | 0.21 | -0.48 | 0.1047 | -0.0073 | |||
| CAT / Caterpillar Inc. | 0.00 | 0.20 | 0.1016 | 0.1016 | |||||
| ASO / Academy Sports and Outdoors, Inc. | 0.00 | -100.00 | 0.00 | 0.0000 | |||||
| PH / Parker-Hannifin Corporation | 0.00 | -100.00 | 0.00 | 0.0000 | |||||
| DE / Deere & Company | 0.00 | -100.00 | 0.00 | 0.0000 | |||||
| ADBE / Adobe Inc. | 0.00 | -100.00 | 0.00 | 0.0000 | |||||
| DIVB / iShares Trust - iShares Core Dividend ETF | 0.00 | -100.00 | 0.00 | -100.00 | -0.1480 |