Estatísticas Básicas
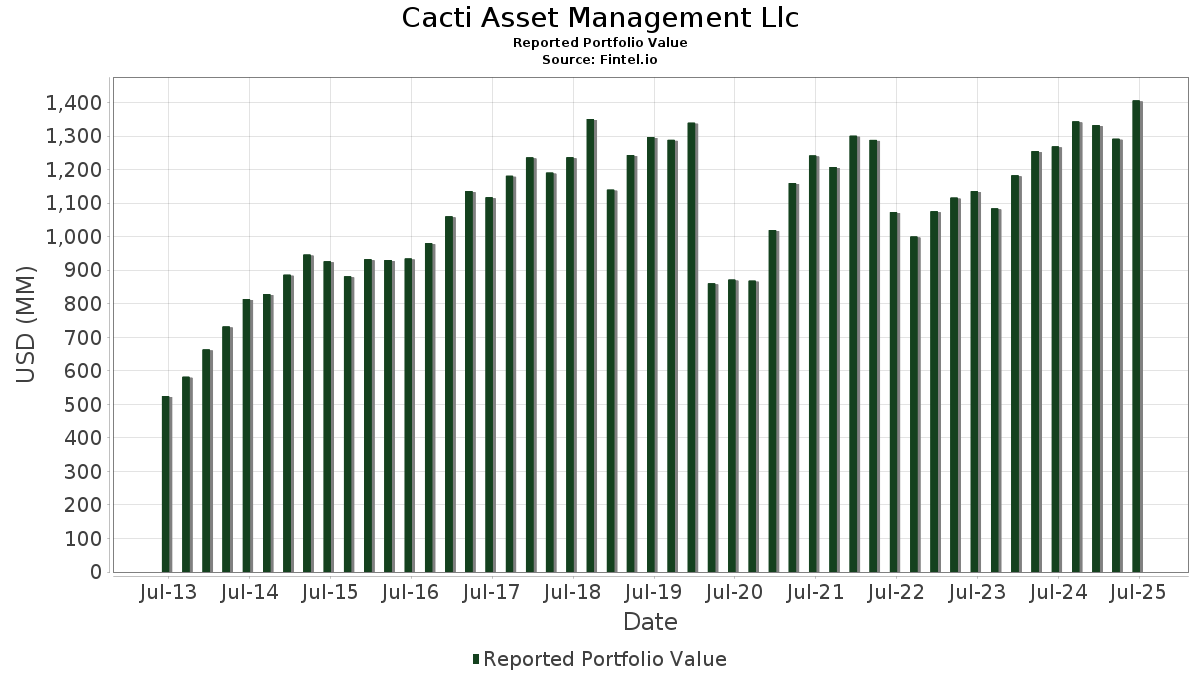
| Valor do Portfólio | $ 1,518,656,245 |
| Posições Atuais | 76 |
Últimas Participações, Desempenho, AUM (de 13F, 13D)
Cacti Asset Management Llc divulgou 76 participações totais em seus últimos arquivamentos da SEC. O valor mais recente da carteira é calculado como $ 1,518,656,245 USD. O Ativo Total Sob Gestão (AUM) é esse valor mais o caixa (que não é divulgado). As principais posições de Cacti Asset Management Llc são GS Connect S&P GSCI Enhanced Commodity Total Return ETN (US:GSCE) , American Express Company (US:AXP) , Apple Inc. (US:AAPL) , Seagate Technology Holdings plc (US:STX) , and Blackstone Inc. (US:BX) .
Maiores Aumentos Este Trimestre
Usamos a mudança na alocação do portfólio porque esta é a métrica mais significativa. As mudanças podem ser devido a operações ou mudanças nos preços das ações.
| Ativo | Ações (MM) |
Valor (MM$) |
% do Portfólio | Δ% do Portfólio |
|---|---|---|---|---|
| 0.54 | 117.40 | 7.7307 | 2.1156 | |
| 0.51 | 130.93 | 8.6216 | 0.9070 | |
| 0.72 | 57.17 | 3.7648 | 0.9020 | |
| 0.40 | 14.14 | 0.9310 | 0.6943 | |
| 0.59 | 86.86 | 5.7198 | 0.2849 | |
| 0.26 | 46.34 | 3.0515 | 0.2555 | |
| 0.05 | 4.43 | 0.2920 | 0.2350 | |
| 0.23 | 25.58 | 1.6842 | 0.1691 | |
| 0.24 | 21.86 | 1.4393 | 0.1635 | |
| 0.31 | 49.85 | 3.2826 | 0.1417 |
Maiores Diminuições Este Trimestre
Usamos a mudança na alocação do portfólio porque esta é a métrica mais significativa. As mudanças podem ser devido a operações ou mudanças nos preços das ações.
| Ativo | Ações (MM) |
Valor (MM$) |
% do Portfólio | Δ% do Portfólio |
|---|---|---|---|---|
| 0.05 | 1.19 | 0.0782 | -1.2274 | |
| 0.54 | 61.82 | 4.0707 | -0.6711 | |
| 0.37 | 30.98 | 2.0401 | -0.6086 | |
| 0.25 | 71.47 | 4.7064 | -0.5160 | |
| 0.39 | 134.21 | 8.8371 | -0.4785 | |
| 0.65 | 113.32 | 7.4618 | -0.3609 | |
| 0.14 | 40.95 | 2.6963 | -0.3358 | |
| 0.64 | 50.66 | 3.3355 | -0.2901 | |
| 0.12 | 13.01 | 0.8569 | -0.2849 | |
| 0.21 | 47.44 | 3.1241 | -0.1491 |
Arquivamentos 13F e Fundo
Este formulário foi arquivado em 2025-10-01 para o período de relatório 2025-09-30. Clique no ícone de link para ver o histórico completo da transação.
Atualize para desbloquear dados premium e exportar para Excel ![]() .
.
| Ativo | Tipo | Preço Médio por Ação | Ações (MM) |
ΔAções (%) |
Valor ($MM) |
ΔAções (%) |
Portfólio (%) |
ΔPortfólio (%) |
|
|---|---|---|---|---|---|---|---|---|---|
| GSCE / GS Connect S&P GSCI Enhanced Commodity Total Return ETN | 0.17 | -8.48 | 134.73 | 6.32 | 8.8714 | -0.1434 | |||
| AXP / American Express Company | 0.39 | -4.86 | 134.21 | 2.49 | 8.8371 | -0.4785 | |||
| AAPL / Apple Inc. | 0.51 | -4.96 | 130.93 | 20.74 | 8.6216 | 0.9070 | |||
| STX / Seagate Technology Holdings plc | 0.54 | -3.27 | 117.40 | 48.75 | 7.7307 | 2.1156 | |||
| BX / Blackstone Inc. | 0.65 | -11.18 | 113.32 | 3.06 | 7.4618 | -0.3609 | |||
| J / Jacobs Solutions Inc. | 0.59 | 0.00 | 86.86 | 13.70 | 5.7198 | 0.2849 | |||
| CB / Chubb Limited | 0.25 | -1.10 | 71.47 | -2.63 | 4.7064 | -0.5160 | |||
| DIS / The Walt Disney Company | 0.54 | 0.00 | 61.82 | -7.25 | 4.0707 | -0.6711 | |||
| GLW / Corning Incorporated | 0.72 | -7.21 | 57.17 | 42.08 | 3.7648 | 0.9020 | |||
| MRK / Merck & Co., Inc. | 0.64 | 0.08 | 50.66 | -0.60 | 3.3355 | -0.2901 | |||
| RTX / RTX Corporation | 0.31 | -0.00 | 49.85 | 12.92 | 3.2826 | 0.1417 | |||
| BA / The Boeing Company | 0.21 | -0.01 | 47.44 | 3.12 | 3.1241 | -0.1491 | |||
| FOXA / Fox Corporation | 0.85 | 0.00 | 47.16 | 5.61 | 3.1055 | -0.0713 | |||
| JNJ / Johnson & Johnson | 0.26 | 0.00 | 46.34 | 17.91 | 3.0515 | 0.2555 | |||
| AVT / Avnet, Inc. | 0.14 | 0.00 | 40.95 | -3.92 | 2.6963 | -0.3358 | |||
| BDX / Becton, Dickinson and Company | 0.18 | 0.01 | 33.28 | 8.05 | 2.1916 | 0.0003 | |||
| UPS / United Parcel Service, Inc. | 0.37 | 0.57 | 30.98 | -16.78 | 2.0401 | -0.6086 | |||
| CVS / CVS Health Corporation | 0.40 | -1.74 | 30.18 | 8.70 | 1.9872 | 0.0121 | |||
| BK / The Bank of New York Mellon Corporation | 0.23 | -0.02 | 25.58 | 20.10 | 1.6842 | 0.1691 | |||
| NKE / NIKE, Inc. | 0.32 | 3.66 | 22.04 | -0.27 | 1.4516 | -0.1210 | |||
| EBAY / eBay Inc. | 0.24 | -1.36 | 21.86 | 21.89 | 1.4393 | 0.1635 | |||
| UBER / Uber Technologies, Inc. | 0.21 | 3.63 | 20.39 | 11.46 | 1.3426 | 0.0412 | |||
| AMTM / Amentum Holdings, Inc. | 0.86 | 0.96 | 19.34 | -2.83 | 1.2738 | -0.1425 | |||
| SPY / SPDR S&P 500 ETF | 0.03 | 0.00 | 16.74 | 7.63 | 1.1023 | -0.0042 | |||
| INTC / Intel Corporation | 0.40 | 171.58 | 14.14 | 324.95 | 0.9310 | 0.6943 | |||
| VWAGY / Volkswagen AG - Depositary Receipt (Common Stock) | 0.12 | -17.82 | 13.01 | -18.92 | 0.8569 | -0.2849 | |||
| GPC / Genuine Parts Company | 0.08 | 0.30 | 11.49 | 14.62 | 0.7569 | 0.0435 | |||
| MSFT / Microsoft Corporation | 0.01 | -1.80 | 5.59 | 1.29 | 0.3681 | -0.0246 | |||
| KKR / KKR & Co. Inc. | 0.03 | -9.15 | 4.46 | -9.35 | 0.2937 | -0.0563 | |||
| EL / The Estée Lauder Companies Inc. | 0.05 | 411.67 | 4.43 | 454.25 | 0.2920 | 0.2350 | |||
| IVZ / Invesco Ltd. | 0.19 | -42.16 | 4.38 | -16.30 | 0.2882 | -0.0838 | |||
| IBM / International Business Machines Corporation | 0.01 | -5.56 | 3.87 | -7.31 | 0.2546 | -0.0422 | |||
| GEV / GE Vernova Inc. | 0.01 | -3.32 | 3.52 | 12.60 | 0.2319 | 0.0094 | |||
| JPM / JPMorgan Chase & Co. | 0.01 | 0.00 | 3.29 | 10.11 | 0.2167 | 0.0040 | |||
| MS / Morgan Stanley | 0.02 | -5.00 | 3.04 | 8.14 | 0.2003 | 0.0001 | |||
| SLV / iShares Silver Trust | 0.07 | -20.77 | 2.94 | 1.66 | 0.1935 | -0.0121 | |||
| HSY / The Hershey Company | 0.01 | -10.32 | 2.56 | 3.94 | 0.1687 | -0.0067 | |||
| KO / The Coca-Cola Company | 0.04 | 0.00 | 2.40 | -6.64 | 0.1583 | -0.0249 | |||
| GJR / Strats Trust For Procter & Gambel Security - Preferred Security | 0.02 | 0.00 | 2.29 | -4.62 | 0.1511 | -0.0200 | |||
| BRO / Brown & Brown, Inc. | 0.02 | 0.00 | 1.97 | -14.43 | 0.1297 | -0.0340 | |||
| VWDRY / Vestas Wind Systems A/S - Depositary Receipt (Common Stock) | 0.30 | 0.00 | 1.85 | 17.26 | 0.1217 | 0.0096 | |||
| AB / AllianceBernstein Holding L.P. - Limited Partnership | 0.04 | 0.00 | 1.70 | -6.34 | 0.1119 | -0.0172 | |||
| PFE / Pfizer Inc. | 0.07 | 0.00 | 1.66 | -1.78 | 0.1093 | -0.0109 | |||
| BMY / Bristol-Myers Squibb Company | 0.04 | 0.00 | 1.61 | -4.80 | 0.1059 | -0.0143 | |||
| PGC / Peapack-Gladstone Financial Corporation | 0.06 | 0.00 | 1.55 | -0.39 | 0.1019 | -0.0086 | |||
| FAST / Fastenal Company | 0.03 | 0.00 | 1.44 | 16.04 | 0.0949 | 0.0066 | |||
| META / Meta Platforms, Inc. | 0.00 | 0.00 | 1.34 | 1.36 | 0.0882 | -0.0058 | |||
| XOM / Exxon Mobil Corporation | 0.01 | -31.53 | 1.29 | -26.64 | 0.0849 | -0.0401 | |||
| KD / Kyndryl Holdings, Inc. | 0.04 | 0.00 | 1.26 | -28.95 | 0.0829 | -0.0432 | |||
| BAX / Baxter International Inc. | 0.05 | -91.06 | 1.19 | -93.54 | 0.0782 | -1.2274 | |||
| USB / U.S. Bancorp | 0.02 | -67.32 | 1.05 | -64.70 | 0.0688 | -0.1418 | |||
| NVO / Novo Nordisk A/S - Depositary Receipt (Common Stock) | 0.02 | 60.00 | 0.89 | 29.78 | 0.0586 | 0.0098 | |||
| HPQ / HP Inc. | 0.03 | 0.00 | 0.80 | 7.81 | 0.0528 | -0.0001 | |||
| SEE / Sealed Air Corporation | 0.02 | 0.00 | 0.77 | 10.20 | 0.0505 | 0.0010 | |||
| HAL / Halliburton Company | 0.03 | 0.00 | 0.75 | 22.04 | 0.0496 | 0.0057 | |||
| HPE / Hewlett Packard Enterprise Company | 0.03 | 0.00 | 0.72 | 30.43 | 0.0474 | 0.0081 | |||
| IFF / International Flavors & Fragrances Inc. | 0.01 | 0.00 | 0.61 | -18.30 | 0.0400 | -0.0129 | |||
| LLY / Eli Lilly and Company | 0.00 | 0.00 | 0.58 | -6.61 | 0.0382 | -0.0060 | |||
| LIND / Lindblad Expeditions Holdings, Inc. | 0.04 | 0.00 | 0.54 | 11.88 | 0.0354 | 0.0012 | |||
| HD / The Home Depot, Inc. | 0.00 | 0.00 | 0.45 | 11.36 | 0.0297 | 0.0008 | |||
| CSCO / Cisco Systems, Inc. | 0.01 | -8.33 | 0.37 | -10.22 | 0.0243 | -0.0050 | |||
| IDXX / IDEXX Laboratories, Inc. | 0.00 | 0.00 | 0.32 | 19.25 | 0.0208 | 0.0019 | |||
| OGN / Organon & Co. | 0.03 | 0.00 | 0.26 | 3.66 | 0.0168 | -0.0007 | |||
| GEHC / GE HealthCare Technologies Inc. | 0.00 | -8.57 | 0.19 | -10.65 | 0.0127 | -0.0027 | |||
| MOV / Movado Group, Inc. | 0.01 | 0.00 | 0.19 | 22.08 | 0.0124 | 0.0014 | |||
| MA / Mastercard Incorporated | 0.00 | 0.00 | 0.17 | 2.42 | 0.0112 | -0.0006 | |||
| TEVA / Teva Pharmaceutical Industries Limited - Depositary Receipt (Common Stock) | 0.01 | -10.00 | 0.17 | -1.20 | 0.0109 | -0.0011 | |||
| FMS / Fresenius Medical Care AG - Depositary Receipt (Common Stock) | 0.01 | 0.00 | 0.15 | -9.47 | 0.0101 | -0.0019 | |||
| WAT / Waters Corporation | 0.00 | 0.00 | 0.15 | -17.61 | 0.0096 | -0.0029 | |||
| TJX / The TJX Companies, Inc. | 0.00 | 0.00 | 0.14 | 16.26 | 0.0094 | 0.0006 | |||
| F / Ford Motor Company | 0.01 | 0.00 | 0.12 | 11.11 | 0.0079 | 0.0002 | |||
| CARR / Carrier Global Corporation | 0.00 | 0.00 | 0.12 | -20.41 | 0.0077 | -0.0027 | |||
| TECH PRECISION CORP / (878739101) | 0.02 | 0.10 | 0.0000 | ||||||
| GLPG / Galapagos NV - Depositary Receipt (Common Stock) | 0.00 | 0.00 | 0.03 | 22.22 | 0.0022 | 0.0002 | |||
| LAC / Lithium Americas Corp. | 0.01 | -50.00 | 0.03 | 14.81 | 0.0021 | 0.0001 | |||
| HISCOX LTD SHSISIN#BMG4593F1041 / (G4593F104) | 0.00 | 0.01 | 0.0000 |