Estatísticas Básicas
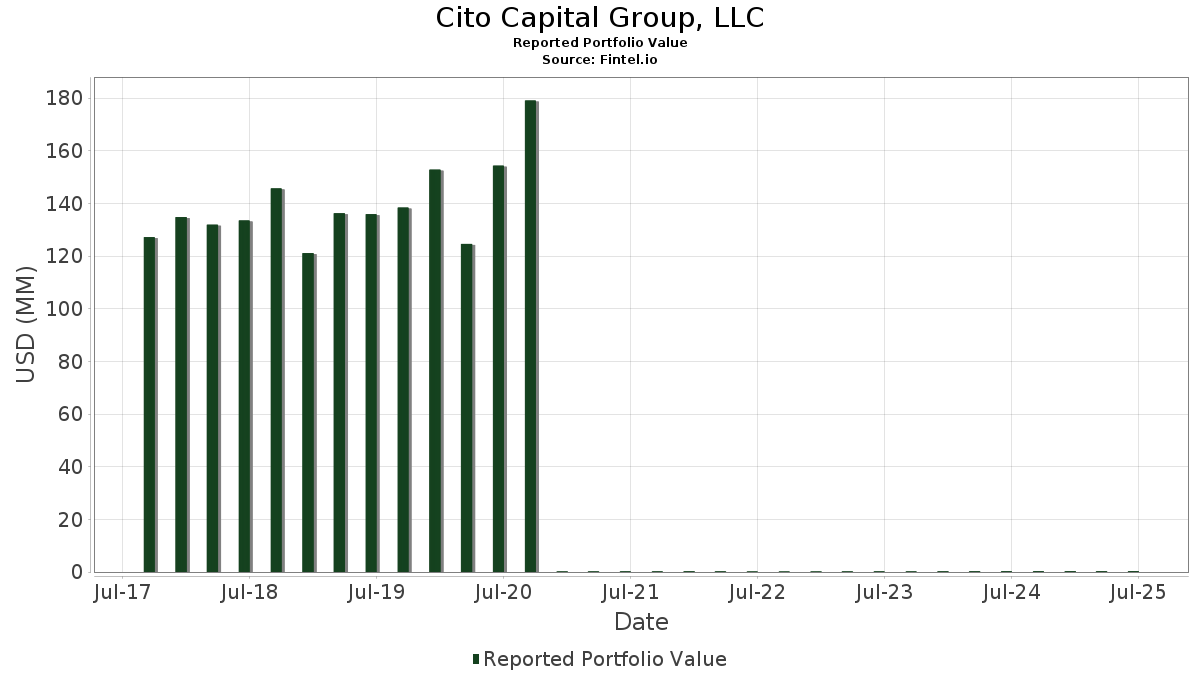
| Valor do Portfólio | $ 344,940 |
| Posições Atuais | 183 |
Últimas Participações, Desempenho, AUM (de 13F, 13D)
Cito Capital Group, LLC divulgou 183 participações totais em seus últimos arquivamentos da SEC. O valor mais recente da carteira é calculado como $ 344,940 USD. O Ativo Total Sob Gestão (AUM) é esse valor mais o caixa (que não é divulgado). As principais posições de Cito Capital Group, LLC são Apple Inc. (US:AAPL) , Popular, Inc. (US:BPOP) , NVIDIA Corporation (US:NVDA) , Microsoft Corporation (US:MSFT) , and Meta Platforms, Inc. (US:META) . As novas posições de Cito Capital Group, LLC incluem Intuit Inc. (US:INTU) , Textron Inc. (US:TXT) , Uber Technologies, Inc. (US:UBER) , Super Micro Computer, Inc. (US:SMCI) , and Nebius Group N.V. (US:NBIS) .
Maiores Aumentos Este Trimestre
Usamos a mudança na alocação do portfólio porque esta é a métrica mais significativa. As mudanças podem ser devido a operações ou mudanças nos preços das ações.
| Ativo | Ações (MM) |
Valor (MM$) |
% do Portfólio | Δ% do Portfólio |
|---|---|---|---|---|
| 0.23 | 0.03 | 8.4406 | 8.4406 | |
| 0.44 | 0.00 | 0.9909 | 0.7205 | |
| 0.00 | 0.00 | 0.3563 | 0.3563 | |
| 0.01 | 0.00 | 0.3543 | 0.3543 | |
| 0.01 | 0.00 | 0.7758 | 0.3095 | |
| 0.01 | 0.00 | 0.8251 | 0.3028 | |
| 0.03 | 0.00 | 0.3012 | 0.3012 | |
| 0.02 | 0.00 | 1.3773 | 0.2663 | |
| 0.02 | 0.00 | 0.4694 | 0.2616 | |
| 0.00 | 0.00 | 0.2577 | 0.2577 |
Maiores Diminuições Este Trimestre
Usamos a mudança na alocação do portfólio porque esta é a métrica mais significativa. As mudanças podem ser devido a operações ou mudanças nos preços das ações.
| Ativo | Ações (MM) |
Valor (MM$) |
% do Portfólio | Δ% do Portfólio |
|---|---|---|---|---|
| 0.01 | 0.00 | 1.0625 | -0.5124 | |
| 0.01 | 0.00 | 0.9007 | -0.4706 | |
| 0.03 | 0.00 | 1.0367 | -0.4672 | |
| 0.01 | 0.00 | 0.6488 | -0.4365 | |
| 0.02 | 0.01 | 1.6742 | -0.3924 | |
| 0.00 | 0.00 | 0.0838 | -0.3849 | |
| 0.02 | 0.01 | 3.7322 | -0.3620 | |
| 0.00 | 0.00 | 0.1615 | -0.3608 | |
| 0.11 | 0.02 | 5.8129 | -0.3392 | |
| 0.01 | 0.01 | 1.7589 | -0.3373 |
Arquivamentos 13F e Fundo
Este formulário foi arquivado em 2025-11-14 para o período de relatório 2025-09-30. Clique no ícone de link para ver o histórico completo da transação.
Atualize para desbloquear dados premium e exportar para Excel ![]() .
.
| Ativo | Tipo | Preço Médio por Ação | Ações (MM) |
ΔAções (%) |
Valor ($MM) |
ΔAções (%) |
Portfólio (%) |
ΔPortfólio (%) |
|
|---|---|---|---|---|---|---|---|---|---|
| AAPL / Apple Inc. | 0.28 | -2.19 | 0.07 | 20.69 | 20.5227 | 0.2305 | |||
| BPOP / Popular, Inc. | 0.23 | 0.03 | 8.4406 | 8.4406 | |||||
| NVDA / NVIDIA Corporation | 0.11 | -3.97 | 0.02 | 17.65 | 5.8129 | -0.3392 | |||
| MSFT / Microsoft Corporation | 0.02 | 5.07 | 0.01 | 9.09 | 3.7322 | -0.3620 | |||
| META / Meta Platforms, Inc. | 0.01 | 1.23 | 0.01 | 0.00 | 1.7589 | -0.3373 | |||
| AMZN / Amazon.com, Inc. | 0.03 | 9.58 | 0.01 | 20.00 | 1.7473 | -0.1652 | |||
| V / Visa Inc. | 0.02 | 1.14 | 0.01 | 0.00 | 1.6742 | -0.3924 | |||
| MS / Morgan Stanley | 0.04 | -7.66 | 0.01 | 0.00 | 1.6661 | -0.2530 | |||
| BRK.B / Berkshire Hathaway Inc. | 0.01 | 0.76 | 0.01 | 0.00 | 1.5443 | -0.2331 | |||
| IBM / International Business Machines Corporation | 0.02 | 55.45 | 0.00 | 33.33 | 1.3773 | 0.2663 | |||
| ABBV / AbbVie Inc. | 0.02 | 0.06 | 0.00 | 33.33 | 1.3063 | 0.0498 | |||
| GOOGL / Alphabet Inc. | 0.02 | -10.28 | 0.00 | 33.33 | 1.2327 | 0.0315 | |||
| HD / The Home Depot, Inc. | 0.01 | -8.91 | 0.00 | 0.00 | 1.2011 | -0.2312 | |||
| CMC / JPMorgan Chase & Co. | 0.01 | -25.58 | 0.00 | -25.00 | 1.0625 | -0.5124 | |||
| WMT / Walmart Inc. | 0.03 | -21.49 | 0.00 | -25.00 | 1.0367 | -0.4672 | |||
| 1B8 / Ondas Holdings Inc. | 0.44 | 9.39 | 0.00 | 0.9909 | 0.7205 | ||||
| RTX / RTX Corporation | 0.02 | -12.47 | 0.00 | 0.00 | 0.9802 | -0.1928 | |||
| AXP / American Express Company | 0.01 | -24.28 | 0.00 | 0.00 | 0.9007 | -0.4706 | |||
| SPY_KZ / SPDR S&P 500 ETF | 0.00 | -9.84 | 0.00 | 0.00 | 0.8868 | -0.2086 | |||
| DRI / Darden Restaurants, Inc. | 0.02 | 0.00 | 0.00 | -33.33 | 0.8555 | -0.3203 | |||
| GOOG.L / Alphabet Inc. | 0.01 | 37.42 | 0.00 | 100.00 | 0.8251 | 0.3028 | |||
| AVGO / Broadcom Inc. | 0.01 | 13.99 | 0.00 | 100.00 | 0.7796 | 0.0937 | |||
| BA / The Boeing Company | 0.01 | 93.79 | 0.00 | 100.00 | 0.7758 | 0.3095 | |||
| DIS / The Walt Disney Company | 0.02 | -8.42 | 0.00 | -33.33 | 0.7338 | -0.3116 | |||
| MRK / Merck & Co., Inc. | 0.03 | 13.34 | 0.00 | 0.00 | 0.7326 | 0.0005 | |||
| JNJ / Johnson & Johnson | 0.01 | 0.00 | 0.00 | 0.00 | 0.7239 | 0.0081 | |||
| MA / Mastercard Incorporated | 0.00 | 0.56 | 0.00 | 0.00 | 0.7048 | -0.1262 | |||
| LOW / Lowe's Companies, Inc. | 0.01 | 12.12 | 0.00 | 100.00 | 0.6740 | 0.0372 | |||
| MCD / McDonald's Corporation | 0.01 | 0.00 | 0.00 | 0.00 | 0.6645 | -0.1025 | |||
| CRM / Salesforce, Inc. | 0.01 | -17.51 | 0.00 | -33.33 | 0.6488 | -0.4365 | |||
| AMGN / Amgen Inc. | 0.01 | 0.00 | 0.00 | 0.00 | 0.6442 | -0.1210 | |||
| ABT / Abbott Laboratories | 0.02 | 0.00 | 0.00 | 0.00 | 0.6291 | -0.1375 | |||
| BAC / Bank of America Corporation | 0.04 | -10.67 | 0.00 | 0.00 | 0.6262 | -0.1456 | |||
| LLY / Eli Lilly and Company | 0.00 | 57.80 | 0.00 | 100.00 | 0.6039 | 0.1345 | |||
| XOM / Exxon Mobil Corporation | 0.02 | 0.99 | 0.00 | 100.00 | 0.5958 | -0.0814 | |||
| GJR / Strats Trust For Procter & Gambel Security - Preferred Security | 0.01 | -13.47 | 0.00 | -50.00 | 0.5720 | -0.2510 | |||
| KR / The Kroger Co. | 0.03 | 0.00 | 0.00 | -50.00 | 0.5688 | -0.1574 | |||
| PEP / PepsiCo, Inc. | 0.01 | 24.94 | 0.00 | 0.00 | 0.5505 | 0.0533 | |||
| UNH / UnitedHealth Group Incorporated | 0.01 | 2.24 | 0.00 | 0.00 | 0.5355 | -0.0324 | |||
| REGN / Regeneron Pharmaceuticals, Inc. | 0.00 | 0.00 | 0.00 | 0.00 | 0.5282 | -0.0637 | |||
| CVX / Chevron Corporation | 0.01 | 0.74 | 0.00 | 0.00 | 0.5224 | -0.0517 | |||
| MMM / 3M Company | 0.01 | 0.00 | 0.00 | 0.00 | 0.5152 | -0.0913 | |||
| PFE / Pfizer Inc. | 0.07 | 0.00 | 0.00 | 0.00 | 0.4894 | -0.0695 | |||
| ORCL / Oracle Corporation | 0.01 | -33.50 | 0.00 | 0.00 | 0.4856 | -0.1957 | |||
| WFC / Wells Fargo & Company | 0.02 | -20.41 | 0.00 | 0.00 | 0.4740 | -0.2091 | |||
| FTNT / Fortinet, Inc. | 0.02 | 240.71 | 0.00 | 0.4694 | 0.2616 | ||||
| COST / Costco Wholesale Corporation | 0.00 | 0.00 | 0.00 | 0.00 | 0.4636 | -0.1315 | |||
| BMY / Bristol-Myers Squibb Company | 0.03 | 3.43 | 0.00 | 0.00 | 0.4496 | -0.0859 | |||
| QCOM / QUALCOMM Incorporated | 0.01 | 0.00 | 0.00 | 0.00 | 0.4244 | -0.0631 | |||
| GE / General Electric Company | 0.00 | -9.34 | 0.00 | 0.00 | 0.4238 | -0.0557 | |||
| AMAT / Applied Materials, Inc. | 0.01 | 67.50 | 0.00 | 0.3978 | 0.1430 | ||||
| ADP / Automatic Data Processing, Inc. | 0.00 | 0.00 | 0.00 | 0.00 | 0.3850 | -0.1004 | |||
| MU / Micron Technology, Inc. | 0.01 | -38.76 | 0.00 | 0.00 | 0.3833 | -0.1700 | |||
| LHX / L3Harris Technologies, Inc. | 0.00 | 0.00 | 0.00 | 0.00 | 0.3719 | 0.0052 | |||
| VRT / Vertiv Holdings Co | 0.01 | -5.56 | 0.00 | 0.00 | 0.3717 | -0.0306 | |||
| CB / Chubb Limited | 0.00 | 28.57 | 0.00 | 0.00 | 0.3693 | 0.0155 | |||
| CSCO / Cisco Systems, Inc. | 0.02 | 0.00 | 0.00 | 0.00 | 0.3676 | -0.0799 | |||
| HII / Huntington Ingalls Industries, Inc. | 0.00 | 10.00 | 0.00 | 0.3673 | 0.0312 | ||||
| GD / General Dynamics Corporation | 0.00 | 0.00 | 0.00 | 0.00 | 0.3659 | -0.0096 | |||
| INTU / Intuit Inc. | 0.00 | 0.00 | 0.3563 | 0.3563 | |||||
| KO / The Coca-Cola Company | 0.02 | 0.00 | 0.00 | 0.00 | 0.3557 | -0.0994 | |||
| PANW / Palo Alto Networks, Inc. | 0.01 | 0.00 | 0.3543 | 0.3543 | |||||
| TGT / Target Corporation | 0.01 | 28.27 | 0.00 | 0.00 | 0.3540 | -0.0104 | |||
| IVV / iShares Trust - iShares Core S&P 500 ETF | 0.00 | 14.97 | 0.00 | 0.3470 | 0.0109 | ||||
| ROL / Rollins, Inc. | 0.02 | 0.00 | 0.00 | 0.00 | 0.3447 | -0.0530 | |||
| WM / Waste Management, Inc. | 0.01 | 0.00 | 0.00 | 0.00 | 0.3427 | -0.0832 | |||
| AIG / American International Group, Inc. | 0.01 | 0.00 | 0.00 | 0.00 | 0.3348 | -0.1029 | |||
| MET / MetLife, Inc. | 0.01 | 40.00 | 0.00 | 0.3343 | 0.0545 | ||||
| DELL / Dell Technologies Inc. | 0.01 | -38.46 | 0.00 | 0.00 | 0.3288 | -0.2259 | |||
| AMD / Advanced Micro Devices, Inc. | 0.01 | -30.00 | 0.00 | 0.00 | 0.3285 | -0.1653 | |||
| C / Citigroup Inc. | 0.01 | -30.96 | 0.00 | 0.00 | 0.3282 | -0.1503 | |||
| JCI / Johnson Controls International plc | 0.01 | 0.00 | 0.00 | 0.00 | 0.3201 | -0.0488 | |||
| CMCSA / Comcast Corporation | 0.04 | -32.13 | 0.00 | 0.00 | 0.3189 | -0.3217 | |||
| CMG / Chipotle Mexican Grill, Inc. | 0.03 | 0.00 | 0.3012 | 0.3012 | |||||
| NOW / ServiceNow, Inc. | 0.00 | 813.01 | 0.00 | 0.2995 | 0.2556 | ||||
| KMB / Kimberly-Clark Corporation | 0.01 | 16.43 | 0.00 | 0.2963 | -0.0207 | ||||
| TJX / The TJX Companies, Inc. | 0.01 | 0.00 | 0.00 | 0.2934 | -0.0073 | ||||
| LMT / Lockheed Martin Corporation | 0.00 | 0.00 | 0.00 | 0.2893 | -0.0329 | ||||
| DG / Dollar General Corporation | 0.01 | 0.00 | 0.00 | -100.00 | 0.2890 | -0.0951 | |||
| GIS / General Mills, Inc. | 0.02 | 0.00 | 0.00 | -100.00 | 0.2858 | -0.0666 | |||
| CLX / The Clorox Company | 0.01 | 20.45 | 0.00 | 0.2841 | 0.0085 | ||||
| NFLX / Netflix, Inc. | 0.00 | 0.00 | 0.00 | -100.00 | 0.2780 | -0.0947 | |||
| COP / ConocoPhillips | 0.01 | 100.00 | 0.00 | 0.2743 | 0.1180 | ||||
| RF / Regions Financial Corporation | 0.04 | 0.00 | 0.00 | 0.2734 | -0.0193 | ||||
| D / Dominion Energy, Inc. | 0.01 | 0.00 | 0.00 | 0.2661 | -0.0289 | ||||
| NOC / Northrop Grumman Corporation | 0.00 | 0.00 | 0.00 | 0.2650 | 0.0040 | ||||
| ALLE / Allegion plc | 0.01 | 3.47 | 0.00 | 0.2606 | 0.0150 | ||||
| TSLA / Tesla, Inc. | 0.00 | 0.00 | 0.2577 | 0.2577 | |||||
| NEXT / NextDecade Corporation | 0.13 | -7.19 | 0.00 | -100.00 | 0.2540 | -0.1768 | |||
| MMC / Marsh & McLennan Companies, Inc. | 0.00 | 0.00 | 0.00 | 0.2513 | -0.0757 | ||||
| TXT / Textron Inc. | 0.01 | 0.00 | 0.2450 | 0.2450 | |||||
| ROK / Rockwell Automation, Inc. | 0.00 | 0.00 | 0.00 | 0.2432 | -0.0341 | ||||
| VRTX / Vertex Pharmaceuticals Incorporated | 0.00 | 0.00 | 0.2334 | 0.2334 | |||||
| MDT / Medtronic plc | 0.01 | 0.00 | 0.00 | 0.2218 | -0.0221 | ||||
| PGR / The Progressive Corporation | 0.00 | -0.80 | 0.00 | 0.2215 | -0.0684 | ||||
| FDX / FedEx Corporation | 0.00 | 0.00 | 0.00 | 0.2200 | -0.0347 | ||||
| USB / U.S. Bancorp | 0.01 | 0.00 | 0.00 | 0.2125 | -0.0262 | ||||
| ALGN / Align Technology, Inc. | 0.01 | 45.00 | 0.00 | 0.2105 | -0.0529 | ||||
| VZ / Verizon Communications Inc. | 0.02 | 0.00 | 0.00 | 0.2009 | -0.0364 | ||||
| TOL / Toll Brothers, Inc. | 0.01 | 0.00 | 0.00 | 0.2003 | 0.0016 | ||||
| GILD / Gilead Sciences, Inc. | 0.01 | 0.00 | 0.00 | 0.1995 | -0.0396 | ||||
| PSX / Phillips 66 | 0.01 | 0.00 | 0.00 | 0.1971 | -0.0106 | ||||
| NUE / Nucor Corporation | 0.01 | 0.00 | 0.00 | 0.1971 | -0.0290 | ||||
| KMPR / Kemper Corporation | 0.01 | 18.33 | 0.00 | 0.1931 | -0.0519 | ||||
| PM / Philip Morris International Inc. | 0.00 | 0.00 | 0.00 | 0.1835 | -0.0656 | ||||
| GEV / GE Vernova Inc. | 0.00 | -55.46 | 0.00 | -100.00 | 0.1789 | -0.2363 | |||
| YUM / Yum! Brands, Inc. | 0.00 | 0.00 | 0.00 | 0.1763 | -0.0301 | ||||
| SHV / iShares Trust - iShares Short Treasury Bond ETF | 0.01 | 0.00 | 0.00 | 0.1763 | -0.0350 | ||||
| KIM / Kimco Realty Corporation | 0.03 | 22.22 | 0.00 | 0.1742 | 0.0096 | ||||
| UBER / Uber Technologies, Inc. | 0.01 | 0.00 | 0.1705 | 0.1705 | |||||
| TSCO / Tractor Supply Company | 0.01 | 0.00 | 0.00 | 0.1650 | -0.0188 | ||||
| 0DY / Flanigan's Enterprises, Inc. | 0.02 | -7.87 | 0.00 | 0.1621 | -0.0680 | ||||
| GS / The Goldman Sachs Group, Inc. | 0.00 | 0.00 | 0.00 | 0.1615 | -0.0108 | ||||
| B / Barrick Mining Corporation | 0.02 | 0.00 | 0.00 | 0.1615 | 0.0383 | ||||
| ADBE / Adobe Inc. | 0.00 | -59.28 | 0.00 | -100.00 | 0.1615 | -0.3608 | |||
| FLRN / SPDR Series Trust - State Street SPDR Bloomberg Investment Grade Floating Rate ETF | 0.02 | 0.00 | 0.00 | 0.1609 | -0.0322 | ||||
| TMUS / T-Mobile US, Inc. | 0.00 | 0.00 | 0.00 | 0.1597 | -0.0309 | ||||
| ACVF / ETF Opportunities Trust - American Conservative Values ETF | 0.01 | 0.00 | 0.00 | 0.1571 | -0.0235 | ||||
| FLOT / iShares Trust - iShares Floating Rate Bond ETF | 0.01 | 0.00 | 0.00 | 0.1554 | -0.0311 | ||||
| HON / Honeywell International Inc. | 0.00 | 0.00 | 0.00 | 0.1525 | -0.0500 | ||||
| NEM / Newmont Corporation | 0.01 | -62.50 | 0.00 | 0.1467 | -0.1776 | ||||
| LNC / Lincoln National Corporation | 0.01 | 0.00 | 0.00 | 0.1403 | -0.0041 | ||||
| MDLZ / Mondelez International, Inc. | 0.01 | -12.51 | 0.00 | 0.1400 | -0.0674 | ||||
| SMCI / Super Micro Computer, Inc. | 0.01 | 0.00 | 0.1389 | 0.1389 | |||||
| NBIS / Nebius Group N.V. | 0.00 | 0.00 | 0.1368 | 0.1368 | |||||
| SCHI / Schwab Strategic Trust - Schwab 5-10 Year Corporate Bond ETF | 0.02 | 0.00 | 0.00 | 0.1339 | -0.0244 | ||||
| AMP / Ameriprise Financial, Inc. | 0.00 | 0.00 | 0.00 | 0.1281 | -0.0389 | ||||
| CL / Colgate-Palmolive Company | 0.01 | 0.00 | 0.00 | 0.1276 | -0.0464 | ||||
| IGIB / iShares Trust - iShares 5-10 Year Investment Grade Corporate Bond ETF | 0.01 | 0.00 | 0.00 | 0.1255 | -0.0227 | ||||
| FCX / Freeport-McMoRan Inc. | 0.01 | 0.00 | 0.00 | 0.1249 | -0.0410 | ||||
| IGSB / iShares Trust - iShares 1-5 Year Investment Grade Corporate Bond ETF | 0.01 | 0.00 | 0.00 | 0.1229 | -0.0239 | ||||
| NKE / NIKE, Inc. | 0.01 | -41.87 | 0.00 | 0.1139 | -0.1258 | ||||
| CVS / CVS Health Corporation | 0.01 | 0.00 | 0.00 | 0.1136 | -0.0113 | ||||
| SPSB / SPDR Series Trust - State Street SPDR Portfolio Short Term Corporate Bond ETF | 0.01 | 0.00 | 0.00 | 0.1099 | -0.0213 | ||||
| DKS / DICK'S Sporting Goods, Inc. | 0.00 | -63.83 | 0.00 | 0.1096 | -0.2140 | ||||
| ZTS / Zoetis Inc. | 0.00 | 0.00 | 0.00 | 0.1081 | -0.0304 | ||||
| SCHO / Schwab Strategic Trust - Schwab Short-Term U.S. Treasury ETF | 0.01 | 0.00 | 0.00 | 0.1061 | -0.0213 | ||||
| CSX / CSX Corporation | 0.01 | 14.02 | 0.00 | 0.1055 | 0.0032 | ||||
| CTVA / Corteva, Inc. | 0.01 | 0.00 | 0.00 | 0.1006 | -0.0323 | ||||
| COIN / Coinbase Global, Inc. | 0.00 | 0.00 | 0.0977 | 0.0977 | |||||
| VCIT / Vanguard Scottsdale Funds - Vanguard Intermediate-Term Corporate Bond ETF | 0.00 | 0.00 | 0.00 | 0.0974 | -0.0181 | ||||
| PML / PIMCO Municipal Income Fund II | 0.04 | 55.22 | 0.00 | 0.0893 | 0.0242 | ||||
| VUG / Vanguard Index Funds - Vanguard Growth ETF | 0.00 | 0.00 | 0.0876 | 0.0876 | |||||
| VTWO / Vanguard Scottsdale Funds - Vanguard Russell 2000 ETF | 0.00 | 0.00 | 0.00 | 0.0849 | -0.0062 | ||||
| SCHW / The Charles Schwab Corporation | 0.00 | 42.73 | 0.00 | 0.0841 | 0.0166 | ||||
| T / AT&T Inc. | 0.01 | 0.00 | 0.00 | 0.0838 | -0.0192 | ||||
| ETN / Eaton Corporation plc | 0.00 | -79.51 | 0.00 | -100.00 | 0.0838 | -0.3849 | |||
| GNRC / Generac Holdings Inc. | 0.00 | 0.00 | 0.00 | 0.0826 | -0.0019 | ||||
| MO / Altria Group, Inc. | 0.00 | 8.41 | 0.00 | 0.0823 | 0.0013 | ||||
| DECK / Deckers Outdoor Corporation | 0.00 | 0.00 | 0.00 | 0.0800 | -0.0178 | ||||
| IGV / iShares Trust - iShares Expanded Tech-Software Sector ETF | 0.00 | 0.00 | 0.00 | 0.0791 | -0.0113 | ||||
| MUB / iShares Trust - iShares National Muni Bond ETF | 0.00 | 0.00 | 0.00 | 0.0786 | -0.0140 | ||||
| ONON / On Holding AG | 0.01 | 0.00 | 0.00 | 0.0658 | -0.0309 | ||||
| SSB / SouthState Bank Corporation | 0.00 | 0.00 | 0.0646 | 0.0646 | |||||
| GABC / German American Bancorp, Inc. | 0.01 | 0.00 | 0.00 | 0.0641 | -0.0114 | ||||
| BHRB / Burke & Herbert Financial Services Corp. | 0.00 | 0.00 | 0.00 | 0.0632 | -0.0102 | ||||
| GEHC / GE HealthCare Technologies Inc. | 0.00 | 0.00 | 0.00 | 0.0609 | -0.0111 | ||||
| PRU / Prudential Financial, Inc. | 0.00 | 0.00 | 0.0600 | 0.0600 | |||||
| ULTA / Ulta Beauty, Inc. | 0.00 | 0.00 | 0.00 | 0.0594 | -0.0015 | ||||
| TXN / Texas Instruments Incorporated | 0.00 | 0.00 | 0.00 | 0.0586 | -0.0208 | ||||
| BLK / BlackRock, Inc. | 0.00 | 0.00 | 0.0574 | 0.0574 | |||||
| EMR / Emerson Electric Co. | 0.00 | 0.00 | 0.00 | 0.0571 | -0.0125 | ||||
| QQQ / Invesco QQQ Trust, Series 1 | 0.00 | 0.00 | 0.00 | 0.0565 | -0.0058 | ||||
| VIVA.X / Vanguard Index Funds - Vanguard Value ETF | 0.00 | 0.00 | 0.0554 | 0.0554 | |||||
| FITB / Fifth Third Bancorp | 0.00 | 0.00 | 0.00 | 0.0522 | -0.0056 | ||||
| VEA / Vanguard Tax-Managed Funds - Vanguard FTSE Developed Markets ETF | 0.00 | 0.00 | 0.0516 | 0.0516 | |||||
| YUMC / Yum China Holdings, Inc. | 0.00 | 0.00 | 0.00 | 0.0499 | -0.0124 | ||||
| GOGO / Gogo Inc. | 0.02 | -18.37 | 0.00 | 0.0499 | -0.0754 | ||||
| INTC / Intel Corporation | 0.01 | 0.00 | 0.00 | 0.0487 | 0.0097 | ||||
| MTN / Vail Resorts, Inc. | 0.00 | 0.00 | 0.00 | 0.0478 | -0.0131 | ||||
| BLE / BlackRock Municipal Income Trust II | 0.02 | 0.00 | 0.00 | 0.0464 | -0.0069 | ||||
| SLB / SLB N.V. | 0.00 | 0.00 | 0.00 | 0.0452 | -0.0080 | ||||
| DOW / Dow Inc. | 0.01 | -71.83 | 0.00 | 0.0446 | -0.1749 | ||||
| LYB / LyondellBasell Industries N.V. | 0.00 | 0.00 | 0.00 | 0.0426 | -0.0179 | ||||
| VO / Vanguard Index Funds - Vanguard Mid-Cap ETF | 0.00 | 0.00 | 0.0412 | 0.0412 | |||||
| ISRG / Intuitive Surgical, Inc. | 0.00 | 0.00 | 0.00 | 0.0406 | -0.0186 | ||||
| IJR / iShares Trust - iShares Core S&P Small-Cap ETF | 0.00 | 0.00 | 0.00 | 0.0357 | -0.0037 | ||||
| NVO / Novo Nordisk A/S - Depositary Receipt (Common Stock) | 0.00 | 0.00 | 0.00 | 0.0354 | -0.0175 | ||||
| NMZ / Nuveen Municipal High Income Opportunity Fund | 0.01 | 0.00 | 0.00 | 0.0310 | -0.0052 | ||||
| OXY / Occidental Petroleum Corporation | 0.00 | -86.96 | 0.00 | 0.0310 | -0.2227 | ||||
| PHK / PIMCO High Income Fund | 0.02 | 0.00 | 0.00 | 0.0293 | -0.0045 | ||||
| IWM / iShares Trust - iShares Russell 2000 ETF | 0.00 | 0.00 | 0.00 | 0.0246 | -0.0018 | ||||
| HPE / Hewlett Packard Enterprise Company | 0.00 | 0.00 | 0.0215 | 0.0215 | |||||
| VST / Vistra Corp. | 0.00 | -100.00 | 0.00 | 0.0000 | |||||
| PMX / PIMCO Municipal Income Fund III | 0.00 | -100.00 | 0.00 | 0.0000 | -0.0358 | ||||
| STZ / Constellation Brands, Inc. | 0.00 | -100.00 | 0.00 | 0.0000 | |||||
| EIX / Edison International | 0.00 | -100.00 | 0.00 | 0.0000 | |||||
| NEE / NextEra Energy, Inc. | 0.00 | -100.00 | 0.00 | 0.0000 | |||||
| ILMN / Illumina, Inc. | 0.00 | -100.00 | 0.00 | 0.0000 | |||||
| MOS / The Mosaic Company | 0.00 | -100.00 | 0.00 | 0.0000 | |||||
| SSB / SouthState Bank Corporation | 0.00 | -100.00 | 0.00 | 0.0000 | |||||
| KMI / Kinder Morgan, Inc. | 0.00 | -100.00 | 0.00 | 0.0000 |