Estatísticas Básicas
| Valor do Portfólio | $ 437,670,156 |
| Posições Atuais | 99 |
Últimas Participações, Desempenho, AUM (de 13F, 13D)
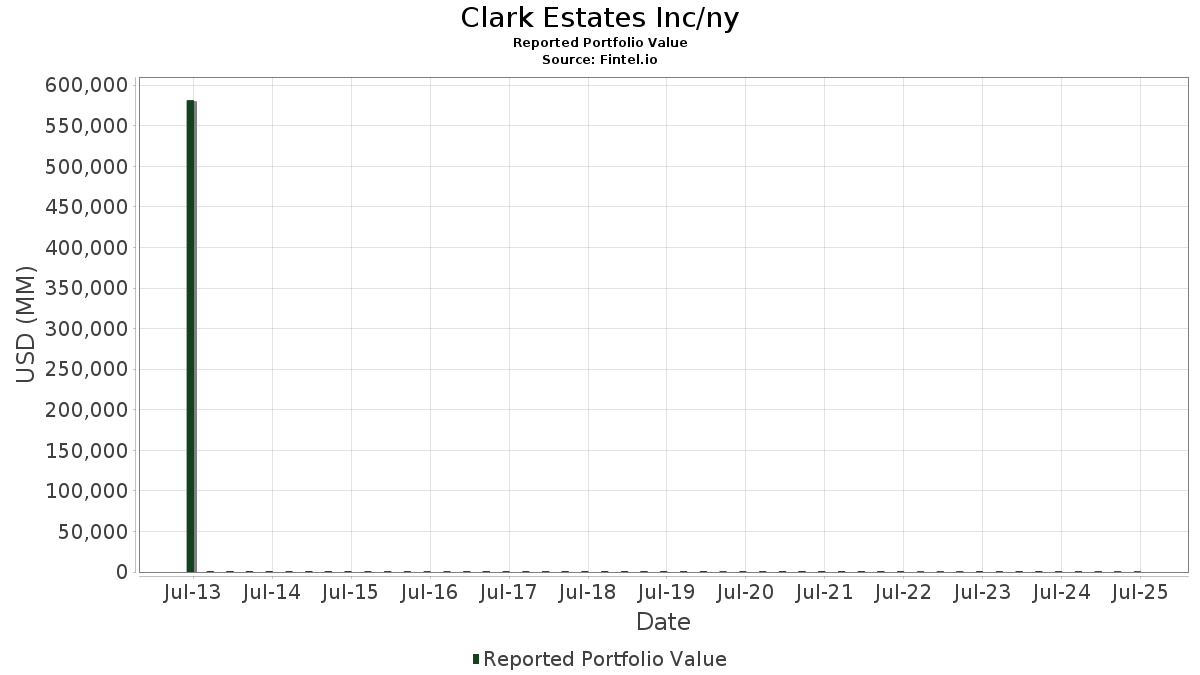
Clark Estates Inc/ny divulgou 99 participações totais em seus últimos arquivamentos da SEC. O valor mais recente da carteira é calculado como $ 437,670,156 USD. O Ativo Total Sob Gestão (AUM) é esse valor mais o caixa (que não é divulgado). As principais posições de Clark Estates Inc/ny são EA Series Trust - Euclidean Fundamental Value ETF (US:ECML) , IQVIA Holdings Inc. (US:IQV) , Medtronic plc (US:MDT) , Expro Group Holdings N.V. (US:XPRO) , and Haleon plc - Depositary Receipt (Common Stock) (US:HLN) . As novas posições de Clark Estates Inc/ny incluem Amrize AG (US:AMRZ) , Rentokil Initial plc - Depositary Receipt (Common Stock) (US:RTO) , OneSpan Inc. (US:OSPN) , Haemonetics Corporation (US:HAE) , and SLB N.V. (US:SLB) .
Maiores Aumentos Este Trimestre
Usamos a mudança na alocação do portfólio porque esta é a métrica mais significativa. As mudanças podem ser devido a operações ou mudanças nos preços das ações.
| Ativo | Ações (MM) |
Valor (MM$) |
% do Portfólio | Δ% do Portfólio |
|---|---|---|---|---|
| 0.30 | 14.56 | 3.3265 | 3.3265 | |
| 0.15 | 11.31 | 2.5853 | 2.5853 | |
| 0.33 | 8.33 | 1.9038 | 1.9038 | |
| 0.15 | 19.38 | 4.4276 | 1.7081 | |
| 0.20 | 10.60 | 2.4216 | 1.0463 | |
| 0.78 | 9.06 | 2.0704 | 0.7141 | |
| 0.16 | 2.48 | 0.5664 | 0.5664 | |
| 1.48 | 3.53 | 0.8058 | 0.5437 | |
| 0.05 | 2.24 | 0.5123 | 0.5123 | |
| 0.07 | 2.23 | 0.5104 | 0.5104 |
Maiores Diminuições Este Trimestre
Usamos a mudança na alocação do portfólio porque esta é a métrica mais significativa. As mudanças podem ser devido a operações ou mudanças nos preços das ações.
| Ativo | Ações (MM) |
Valor (MM$) |
% do Portfólio | Δ% do Portfólio |
|---|---|---|---|---|
| 0.20 | 4.55 | 1.0405 | -4.4286 | |
| 2.31 | 76.91 | 17.5728 | -3.7519 | |
| 0.33 | 11.79 | 2.6948 | -1.9441 | |
| 0.12 | 10.97 | 2.5075 | -0.7732 | |
| 0.25 | 7.20 | 1.6445 | -0.6916 | |
| 1.80 | 16.15 | 3.6891 | -0.4990 | |
| 0.12 | 21.88 | 4.9994 | -0.4882 | |
| 0.00 | 0.00 | -0.4292 | ||
| 0.12 | 14.31 | 3.2702 | -0.2078 | |
| 0.02 | 1.66 | 0.3788 | -0.0540 |
Arquivamentos 13F e Fundo
Este formulário foi arquivado em 2025-11-10 para o período de relatório 2025-09-30. Clique no ícone de link para ver o histórico completo da transação.
Atualize para desbloquear dados premium e exportar para Excel ![]() .
.
| Ativo | Tipo | Preço Médio por Ação | Ações (MM) |
ΔAções (%) |
Valor ($MM) |
ΔAções (%) |
Portfólio (%) |
ΔPortfólio (%) |
|
|---|---|---|---|---|---|---|---|---|---|
| ECML / EA Series Trust - Euclidean Fundamental Value ETF | 2.31 | -25.09 | 76.91 | -19.08 | 17.5728 | -3.7519 | |||
| IQV / IQVIA Holdings Inc. | 0.12 | -25.77 | 21.88 | -10.53 | 4.9994 | -0.4882 | |||
| MDT / Medtronic plc | 0.23 | -10.00 | 21.43 | -1.67 | 4.8962 | 0.0066 | |||
| XPRO / Expro Group Holdings N.V. | 0.15 | 113.80 | 19.38 | 59.88 | 4.4276 | 1.7081 | |||
| HLN / Haleon plc - Depositary Receipt (Common Stock) | 1.80 | 0.00 | 16.15 | -13.50 | 3.6891 | -0.4990 | |||
| AMRZ / Amrize AG | 0.30 | 14.56 | 3.3265 | 3.3265 | |||||
| DIS / The Walt Disney Company | 0.12 | 0.00 | 14.31 | -7.67 | 3.2702 | -0.2078 | |||
| BLCO / Bausch + Lomb Corporation | 0.86 | 1.18 | 12.96 | 17.20 | 2.9612 | 0.4800 | |||
| SNN / Smith & Nephew plc - Depositary Receipt (Common Stock) | 0.33 | -51.85 | 11.79 | -42.96 | 2.6948 | -1.9441 | |||
| SOLV / Solventum Corporation | 0.15 | 11.31 | 2.5853 | 2.5853 | |||||
| DEO / Diageo plc - Depositary Receipt (Common Stock) | 0.12 | -20.69 | 10.97 | -24.94 | 2.5075 | -0.7732 | |||
| UL / Unilever PLC - Depositary Receipt (Common Stock) | 0.18 | 0.00 | 10.67 | -3.09 | 2.4380 | -0.0324 | |||
| PRKS / United Parks & Resorts Inc. | 0.20 | 57.69 | 10.60 | 72.92 | 2.4216 | 1.0463 | |||
| AVNS / Avanos Medical, Inc. | 0.78 | 58.72 | 9.06 | 49.89 | 2.0704 | 0.7141 | |||
| RTO / Rentokil Initial plc - Depositary Receipt (Common Stock) | 0.33 | 8.33 | 1.9038 | 1.9038 | |||||
| SONY / Sony Group Corporation - Depositary Receipt (Common Stock) | 0.25 | -37.50 | 7.20 | -30.88 | 1.6445 | -0.6916 | |||
| BAX / Baxter International Inc. | 0.20 | -75.16 | 4.55 | -81.32 | 1.0405 | -4.4286 | |||
| DDD / 3D Systems Corporation | 1.42 | 0.00 | 4.11 | 88.32 | 0.9400 | 0.4498 | |||
| REZI / Resideo Technologies, Inc. | 0.09 | -13.75 | 4.06 | 68.87 | 0.9284 | 0.3884 | |||
| INDV / Indivior PLC | 0.15 | -24.56 | 3.70 | 23.39 | 0.8461 | 0.1728 | |||
| STTK / Shattuck Labs, Inc. | 1.48 | 0.00 | 3.53 | 201.88 | 0.8058 | 0.5437 | |||
| HSII / Heidrick & Struggles International, Inc. | 0.07 | 0.00 | 3.35 | 8.76 | 0.7663 | 0.0744 | |||
| HALO / Halozyme Therapeutics, Inc. | 0.04 | 0.00 | 3.29 | 40.96 | 0.7518 | 0.2282 | |||
| MO / Altria Group, Inc. | 0.05 | 0.00 | 3.21 | 12.67 | 0.7337 | 0.0943 | |||
| INCY / Incyte Corporation | 0.03 | 0.00 | 2.96 | 24.54 | 0.6773 | 0.1432 | |||
| GILD / Gilead Sciences, Inc. | 0.03 | 0.00 | 2.89 | 0.10 | 0.6600 | 0.0126 | |||
| MD / Pediatrix Medical Group, Inc. | 0.17 | 0.00 | 2.87 | 16.72 | 0.6556 | 0.1041 | |||
| SNX / TD SYNNEX Corporation | 0.02 | 0.00 | 2.83 | 20.66 | 0.6472 | 0.1205 | |||
| UTHR / United Therapeutics Corporation | 0.01 | 10.33 | 2.82 | 61.02 | 0.6446 | 0.2513 | |||
| VNT / Vontier Corporation | 0.06 | 0.00 | 2.55 | 13.76 | 0.5818 | 0.0795 | |||
| AMWD / American Woodmark Corporation | 0.04 | 13.55 | 2.52 | 42.07 | 0.5751 | 0.1775 | |||
| OSK / Oshkosh Corporation | 0.02 | 0.00 | 2.52 | 14.21 | 0.5748 | 0.0807 | |||
| MMS / Maximus, Inc. | 0.03 | 0.00 | 2.48 | 30.13 | 0.5665 | 0.1391 | |||
| OSPN / OneSpan Inc. | 0.16 | 2.48 | 0.5664 | 0.5664 | |||||
| NXST / Nexstar Media Group, Inc. | 0.01 | 0.00 | 2.46 | 14.35 | 0.5628 | 0.0794 | |||
| TGNA / TEGNA Inc. | 0.12 | 0.00 | 2.37 | 21.27 | 0.5407 | 0.1030 | |||
| ZD / Ziff Davis, Inc. | 0.06 | 5.57 | 2.35 | 32.94 | 0.5358 | 0.1399 | |||
| WLY / John Wiley & Sons, Inc. | 0.06 | 0.00 | 2.32 | -9.35 | 0.5294 | -0.0439 | |||
| LEA / Lear Corporation | 0.02 | 0.00 | 2.31 | 5.97 | 0.5274 | 0.0385 | |||
| NTCT / NetScout Systems, Inc. | 0.09 | 0.00 | 2.30 | 4.13 | 0.5247 | 0.0298 | |||
| MTCH / Match Group, Inc. | 0.06 | 0.00 | 2.29 | 14.34 | 0.5229 | 0.0738 | |||
| PVH / PVH Corp. | 0.03 | 0.00 | 2.29 | 22.12 | 0.5225 | 0.1023 | |||
| PFE / Pfizer Inc. | 0.09 | 9.81 | 2.28 | 15.44 | 0.5213 | 0.0778 | |||
| SJM / The J. M. Smucker Company | 0.02 | 0.00 | 2.28 | 10.63 | 0.5208 | 0.0583 | |||
| LEN / Lennar Corporation | 0.02 | 6.03 | 2.27 | 20.80 | 0.5191 | 0.0972 | |||
| CPRX / Catalyst Pharmaceuticals, Inc. | 0.11 | 0.00 | 2.24 | -9.22 | 0.5128 | -0.0419 | |||
| HAE / Haemonetics Corporation | 0.05 | 2.24 | 0.5123 | 0.5123 | |||||
| SLB / SLB N.V. | 0.07 | 2.23 | 0.5104 | 0.5104 | |||||
| DOX / Amdocs Limited | 0.03 | 2.22 | 0.5062 | 0.5062 | |||||
| DBX / Dropbox, Inc. | 0.07 | 2.18 | 0.4970 | 0.4970 | |||||
| LNTH / Lantheus Holdings, Inc. | 0.04 | 2.15 | 0.4922 | 0.4922 | |||||
| BIIB / Biogen Inc. | 0.02 | 0.00 | 2.14 | 11.56 | 0.4897 | 0.0586 | |||
| MTX / Minerals Technologies Inc. | 0.03 | 0.00 | 2.12 | 12.84 | 0.4840 | 0.0627 | |||
| TDC / Teradata Corporation | 0.10 | 16.87 | 2.10 | 12.65 | 0.4802 | 0.0617 | |||
| CROX / Crocs, Inc. | 0.03 | 32.38 | 2.10 | 9.22 | 0.4792 | 0.0483 | |||
| WEX / WEX Inc. | 0.01 | 0.00 | 2.10 | 7.27 | 0.4787 | 0.0404 | |||
| HAL / Halliburton Company | 0.08 | 36.88 | 2.07 | 65.18 | 0.4727 | 0.1918 | |||
| OMC / Omnicom Group Inc. | 0.03 | 0.00 | 2.05 | 13.36 | 0.4694 | 0.0627 | |||
| ASGN / ASGN Incorporated | 0.04 | 2.04 | 0.4652 | 0.4652 | |||||
| YELP / Yelp Inc. | 0.07 | 17.09 | 2.03 | 6.61 | 0.4641 | 0.0366 | |||
| UPBD / Upbound Group, Inc. | 0.09 | 11.04 | 2.02 | 4.55 | 0.4616 | 0.0280 | |||
| TFX / Teleflex Incorporated | 0.02 | 9.33 | 2.01 | 13.01 | 0.4585 | 0.0602 | |||
| CARS / Cars.com Inc. | 0.16 | 7.06 | 2.00 | 10.37 | 0.4573 | 0.0505 | |||
| SMPL / The Simply Good Foods Company | 0.08 | 1.99 | 0.4537 | 0.4537 | |||||
| YETI / YETI Holdings, Inc. | 0.06 | 0.00 | 1.96 | 5.31 | 0.4488 | 0.0301 | |||
| TAP / Molson Coors Beverage Company | 0.04 | 11.81 | 1.96 | 5.21 | 0.4477 | 0.0298 | |||
| CMCSA / Comcast Corporation | 0.06 | 41.28 | 1.95 | 24.43 | 0.4458 | 0.0938 | |||
| BBWI / Bath & Body Works, Inc. | 0.08 | 11.55 | 1.95 | -4.09 | 0.4450 | -0.0106 | |||
| BMY / Bristol-Myers Squibb Company | 0.04 | 10.82 | 1.94 | 7.96 | 0.4431 | 0.0401 | |||
| BWA / BorgWarner Inc. | 0.04 | 0.00 | 1.89 | 31.34 | 0.4319 | 0.1089 | |||
| HRMY / Harmony Biosciences Holdings, Inc. | 0.07 | 12.17 | 1.85 | -2.22 | 0.4238 | -0.0016 | |||
| HPQ / HP Inc. | 0.06 | 0.00 | 1.72 | 11.37 | 0.3940 | 0.0464 | |||
| VTRS / Viatris Inc. | 0.17 | 0.00 | 1.70 | 10.84 | 0.3881 | 0.0443 | |||
| CTSH / Cognizant Technology Solutions Corporation | 0.02 | 0.00 | 1.66 | -14.00 | 0.3788 | -0.0540 | |||
| KHC / The Kraft Heinz Company | 0.06 | 0.00 | 1.54 | 0.85 | 0.3518 | 0.0093 | |||
| ALSN / Allison Transmission Holdings, Inc. | 0.02 | 0.00 | 1.51 | -10.68 | 0.3442 | -0.0341 | |||
| EMBC / Embecta Corp. | 0.11 | 0.00 | 1.48 | 45.63 | 0.3392 | 0.1104 | |||
| CNXC / Concentrix Corporation | 0.03 | 0.00 | 1.34 | -12.73 | 0.3073 | -0.0383 | |||
| WU / The Western Union Company | 0.15 | 0.00 | 1.22 | -5.12 | 0.2794 | -0.0097 | |||
| XPOF / Xponential Fitness, Inc. | 0.14 | 0.00 | 1.13 | 3.97 | 0.2576 | 0.0144 | |||
| MAN / ManpowerGroup Inc. | 0.03 | 0.00 | 1.11 | -6.25 | 0.2538 | -0.0119 | |||
| DXC / DXC Technology Company | 0.08 | 0.00 | 1.10 | -10.87 | 0.2513 | -0.0255 | |||
| DH / Definitive Healthcare Corp. | 0.24 | 0.00 | 0.97 | 4.07 | 0.2223 | 0.0126 | |||
| PG / The Procter & Gamble Company | 0.01 | 0.00 | 0.88 | -3.60 | 0.2019 | -0.0037 | |||
| IBM / International Business Machines Corporation | 0.00 | 0.00 | 0.86 | -4.33 | 0.1970 | -0.0051 | |||
| HELE / Helen of Troy Limited | 0.03 | 0.00 | 0.86 | -11.24 | 0.1969 | -0.0209 | |||
| AAPL / Apple Inc. | 0.00 | 0.00 | 0.79 | 24.14 | 0.1810 | 0.0378 | |||
| JNJ / Johnson & Johnson | 0.00 | 0.00 | 0.76 | 21.37 | 0.1739 | 0.0332 | |||
| SPY / SPDR S&P 500 ETF | 0.00 | 0.00 | 0.70 | 7.83 | 0.1604 | 0.0143 | |||
| AMZN / Amazon.com, Inc. | 0.00 | 0.00 | 0.54 | 0.00 | 0.1224 | 0.0023 | |||
| MSFT / Microsoft Corporation | 0.00 | 0.00 | 0.44 | 4.01 | 0.1009 | 0.0057 | |||
| VB / Vanguard Index Funds - Vanguard Small-Cap ETF | 0.00 | 0.00 | 0.34 | 7.52 | 0.0784 | 0.0067 | |||
| CPNG / Coupang, Inc. | 0.01 | 0.00 | 0.30 | 7.55 | 0.0683 | 0.0059 | |||
| GOOGL / Alphabet Inc. | 0.00 | -24.14 | 0.27 | 4.71 | 0.0611 | 0.0038 | |||
| XOM / Exxon Mobil Corporation | 0.00 | 0.00 | 0.25 | 4.60 | 0.0573 | 0.0035 | |||
| JPM / JPMorgan Chase & Co. | 0.00 | 0.00 | 0.24 | 8.76 | 0.0541 | 0.0053 | |||
| CB / Chubb Limited | 0.00 | 0.00 | 0.23 | -2.60 | 0.0516 | -0.0004 | |||
| EFA / iShares Trust - iShares MSCI EAFE ETF | 0.00 | 0.00 | 0.22 | 4.74 | 0.0506 | 0.0030 | |||
| NOW / ServiceNow, Inc. | 0.00 | 0.00 | 0.21 | -10.39 | 0.0473 | -0.0046 | |||
| EXPE / Expedia Group, Inc. | 0.00 | -100.00 | 0.00 | 0.0000 | |||||
| PINC / Premier, Inc. | 0.00 | -100.00 | 0.00 | -100.00 | -0.4292 | ||||
| ROCK / Gibraltar Industries, Inc. | 0.00 | -100.00 | 0.00 | 0.0000 | |||||
| SHOO / Steven Madden, Ltd. | 0.00 | -100.00 | 0.00 | 0.0000 | |||||
| NXT / Nextpower Inc. | 0.00 | -100.00 | 0.00 | 0.0000 | |||||
| DELL / Dell Technologies Inc. | 0.00 | -100.00 | 0.00 | 0.0000 | |||||
| TRIP / Tripadvisor, Inc. | 0.00 | -100.00 | 0.00 | 0.0000 | |||||
| KVUE / Kenvue Inc. | 0.00 | -100.00 | 0.00 | 0.0000 | |||||
| SWKS / Skyworks Solutions, Inc. | 0.00 | -100.00 | 0.00 | 0.0000 |