Estatísticas Básicas
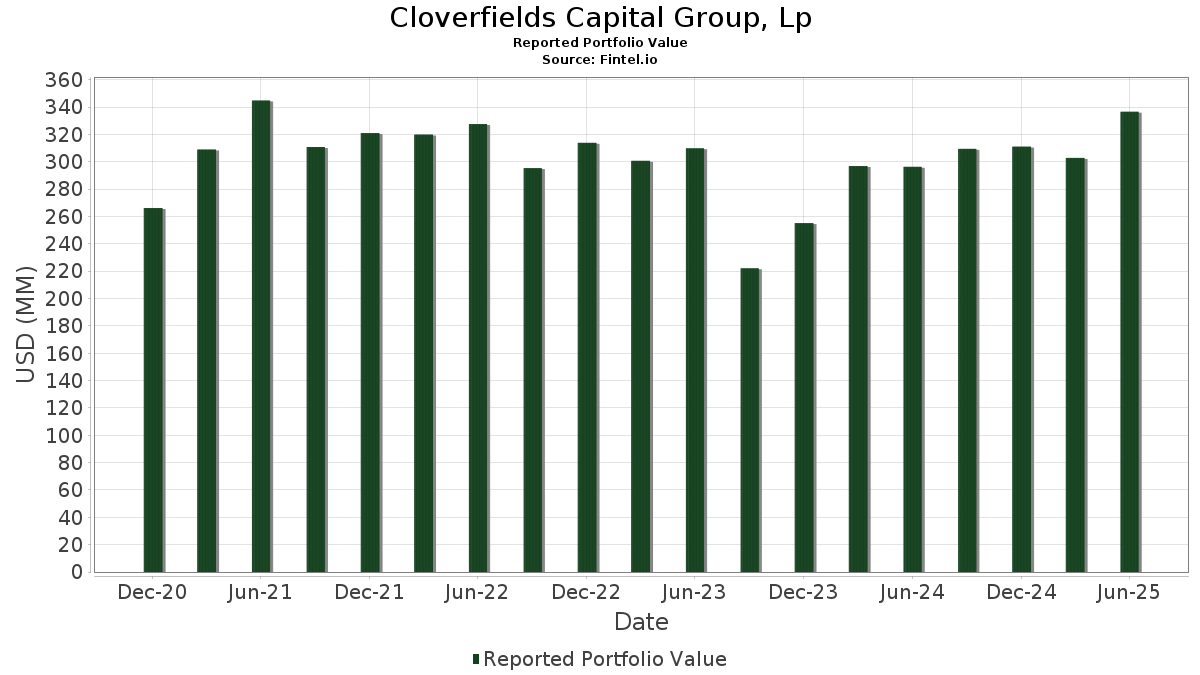
| Valor do Portfólio | $ 319,491,634 |
| Posições Atuais | 96 |
Últimas Participações, Desempenho, AUM (de 13F, 13D)
Cloverfields Capital Group, Lp divulgou 96 participações totais em seus últimos arquivamentos da SEC. O valor mais recente da carteira é calculado como $ 319,491,634 USD. O Ativo Total Sob Gestão (AUM) é esse valor mais o caixa (que não é divulgado). As principais posições de Cloverfields Capital Group, Lp são Taiwan Semiconductor Manufacturing Company Limited - Depositary Receipt (Common Stock) (US:TSM) , Alphabet Inc. (US:GOOGL) , Meta Platforms, Inc. (US:META) , Microsoft Corporation (US:MSFT) , and General Electric Company (US:GE) .
Maiores Aumentos Este Trimestre
Usamos a mudança na alocação do portfólio porque esta é a métrica mais significativa. As mudanças podem ser devido a operações ou mudanças nos preços das ações.
| Ativo | Ações (MM) |
Valor (MM$) |
% do Portfólio | Δ% do Portfólio |
|---|---|---|---|---|
| HLT / Hilton Worldwide Holdings Inc. | 0.02 | 4.11 | 1.2860 | 1.2860 |
| APP / AppLovin Corporation | 0.01 | 6.02 | 1.8838 | 0.9868 |
| GOOGL / Alphabet Inc. | 0.03 | 8.17 | 2.5570 | 0.7695 |
| TSM / Taiwan Semiconductor Manufacturing Company Limited - Depositary Receipt (Common Stock) | 0.03 | 9.19 | 2.8750 | 0.4820 |
| EBGEF / Enbridge Inc. - Preferred Stock | 0.06 | 3.14 | 0.9824 | 0.4726 |
| NVDA / NVIDIA Corporation | 0.04 | 7.57 | 2.3695 | 0.4652 |
| GLD / SPDR Gold Shares | 0.02 | 6.95 | 2.1741 | 0.3875 |
| BABA / Alibaba Group Holding Limited - Depositary Receipt (Common Stock) | 0.02 | 3.30 | 1.0329 | 0.3482 |
| TMO / Thermo Fisher Scientific Inc. | 0.01 | 4.45 | 1.3930 | 0.2735 |
| CNR / Core Natural Resources, Inc. | 0.06 | 4.96 | 1.5512 | 0.2328 |
Maiores Diminuições Este Trimestre
Usamos a mudança na alocação do portfólio porque esta é a métrica mais significativa. As mudanças podem ser devido a operações ou mudanças nos preços das ações.
| Ativo | Ações (MM) |
Valor (MM$) |
% do Portfólio | Δ% do Portfólio |
|---|---|---|---|---|
| AAPL / Apple Inc. | 0.00 | 0.00 | -1.1794 | |
| AZN / AstraZeneca PLC - Depositary Receipt (Common Stock) | 0.00 | 0.00 | -0.7830 | |
| FI / Fiserv, Inc. | 0.04 | 5.58 | 1.7459 | -0.4590 |
| AGRO / Adecoagro S.A. | 0.05 | 0.42 | 0.1326 | -0.3693 |
| GLNG / Golar LNG Limited | 0.09 | 3.71 | 1.1617 | -0.3127 |
| EXE / Expand Energy Corporation | 0.01 | 1.40 | 0.4395 | -0.2801 |
| FLR / Fluor Corporation | 0.02 | 0.83 | 0.2584 | -0.2233 |
| GEV / GE Vernova Inc. | 0.00 | 1.97 | 0.6180 | -0.2169 |
| FOUR / Shift4 Payments, Inc. | 0.04 | 3.32 | 1.0394 | -0.2005 |
| LNG / Cheniere Energy, Inc. | 0.00 | 1.02 | 0.3195 | -0.1901 |
Arquivamentos 13F e Fundo
Este formulário foi arquivado em 2025-11-13 para o período de relatório 2025-09-30. Clique no ícone de link para ver o histórico completo da transação.
Atualize para desbloquear dados premium e exportar para Excel ![]() .
.
| Ativo | Tipo | Preço Médio por Ação | Ações (MM) |
ΔAções (%) |
Valor ($MM) |
ΔAções (%) |
Portfólio (%) |
ΔPortfólio (%) |
|
|---|---|---|---|---|---|---|---|---|---|
| TSM / Taiwan Semiconductor Manufacturing Company Limited - Depositary Receipt (Common Stock) | 0.03 | -7.52 | 9.19 | 14.04 | 2.8750 | 0.4820 | |||
| GOOGL / Alphabet Inc. | 0.03 | -1.10 | 8.17 | 35.79 | 2.5570 | 0.7695 | |||
| META / Meta Platforms, Inc. | 0.01 | -1.05 | 8.06 | -1.55 | 2.5225 | 0.0903 | |||
| MSFT / Microsoft Corporation | 0.02 | 0.04 | 8.00 | 4.17 | 2.5025 | 0.2222 | |||
| GE / General Electric Company | 0.03 | -12.81 | 7.71 | 1.90 | 2.4145 | 0.1654 | |||
| OTIS / Otis Worldwide Corporation | 0.08 | -3.46 | 7.57 | -10.86 | 2.3704 | -0.1539 | |||
| NVDA / NVIDIA Corporation | 0.04 | 0.01 | 7.57 | 18.12 | 2.3695 | 0.4652 | |||
| SCHW / The Charles Schwab Corporation | 0.08 | -0.50 | 7.36 | 4.12 | 2.3031 | 0.2033 | |||
| X88 / Canadian Pacific Kansas City Limited | 0.10 | -2.78 | 7.25 | -8.64 | 2.2683 | -0.0886 | |||
| AMZN / Amazon.com, Inc. | 0.03 | 0.15 | 7.03 | 0.24 | 2.2007 | 0.1166 | |||
| GLD / SPDR Gold Shares | 0.02 | -0.95 | 6.95 | 15.52 | 2.1741 | 0.3875 | |||
| PM / Philip Morris International Inc. | 0.04 | -0.40 | 6.83 | -11.30 | 2.1368 | -0.1498 | |||
| ADP / Automatic Data Processing, Inc. | 0.02 | 0.15 | 6.82 | -4.68 | 2.1359 | 0.0087 | |||
| NFLX / Netflix, Inc. | 0.01 | -0.33 | 6.59 | -10.76 | 2.0632 | -0.1314 | |||
| BRK.B / Berkshire Hathaway Inc. | 0.01 | -1.00 | 6.20 | 2.46 | 1.9397 | 0.1426 | |||
| APP / AppLovin Corporation | 0.01 | -2.88 | 6.02 | 99.34 | 1.8838 | 0.9868 | |||
| ACGL / Arch Capital Group Ltd. | 0.06 | -5.05 | 5.72 | -5.40 | 1.7891 | -0.0057 | |||
| MA / Mastercard Incorporated | 0.01 | -0.81 | 5.66 | 0.41 | 1.7723 | 0.0968 | |||
| UBER / Uber Technologies, Inc. | 0.06 | -0.46 | 5.61 | 4.53 | 1.7545 | 0.1611 | |||
| FI / Fiserv, Inc. | 0.04 | 0.51 | 5.58 | -24.83 | 1.7459 | -0.4590 | |||
| PGR / The Progressive Corporation | 0.02 | 0.41 | 5.38 | -7.08 | 1.6847 | -0.0363 | |||
| MCO / Moody's Corporation | 0.01 | -0.42 | 5.03 | -5.40 | 1.5738 | -0.0054 | |||
| CPAY / Corpay, Inc. | 0.02 | -0.25 | 5.02 | -13.41 | 1.5722 | -0.1512 | |||
| CNR / Core Natural Resources, Inc. | 0.06 | -6.70 | 4.96 | 11.67 | 1.5512 | 0.2328 | |||
| BAC / Bank of America Corporation | 0.09 | -1.08 | 4.90 | 7.84 | 1.5326 | 0.1836 | |||
| V / Visa Inc. | 0.01 | -0.91 | 4.83 | -4.72 | 1.5109 | 0.0056 | |||
| TECK.B / Teck Resources Limited | 0.11 | -13.27 | 4.76 | -5.73 | 1.4896 | -0.0102 | |||
| CRH / CRH plc | 0.04 | -17.85 | 4.51 | 7.30 | 1.4129 | 0.1630 | |||
| TMO / Thermo Fisher Scientific Inc. | 0.01 | -1.26 | 4.45 | 18.13 | 1.3930 | 0.2735 | |||
| SPGI / S&P Global Inc. | 0.01 | 0.35 | 4.43 | -7.37 | 1.3879 | -0.0344 | |||
| CVS / CVS Health Corporation | 0.06 | 0.18 | 4.29 | 9.48 | 1.3415 | 0.1785 | |||
| APO / Apollo Global Management, Inc. | 0.03 | 1.10 | 4.26 | -5.02 | 1.3321 | 0.0008 | |||
| NKE / NIKE, Inc. | 0.06 | 0.01 | 4.12 | -1.84 | 1.2882 | 0.0425 | |||
| HLT / Hilton Worldwide Holdings Inc. | 0.02 | 4.11 | 1.2860 | 1.2860 | |||||
| FLUT / Flutter Entertainment plc | 0.02 | 0.06 | 4.04 | -11.07 | 1.2650 | -0.0851 | |||
| SE / Sea Limited - Depositary Receipt (Common Stock) | 0.02 | -18.14 | 3.95 | -8.52 | 1.2361 | -0.0466 | |||
| TDG / TransDigm Group Incorporated | 0.00 | 1.34 | 3.87 | -12.19 | 1.2127 | -0.0981 | |||
| GLNG / Golar LNG Limited | 0.09 | -23.77 | 3.71 | -25.21 | 1.1617 | -0.3127 | |||
| HPQ / HP Inc. | 0.13 | 0.05 | 3.57 | 11.37 | 1.1164 | 0.1650 | |||
| UBS / UBS Group AG | 0.09 | -3.25 | 3.50 | 17.30 | 1.0950 | 0.2088 | |||
| XOM / Exxon Mobil Corporation | 0.03 | -12.94 | 3.45 | -8.94 | 1.0809 | -0.0459 | |||
| BTI / British American Tobacco p.l.c. - Depositary Receipt (Common Stock) | 0.06 | -9.27 | 3.38 | 1.75 | 1.0585 | 0.0710 | |||
| ZTS / Zoetis Inc. | 0.02 | -0.57 | 3.35 | -6.72 | 1.0479 | -0.0184 | |||
| FOUR / Shift4 Payments, Inc. | 0.04 | 1.89 | 3.32 | -20.44 | 1.0394 | -0.2005 | |||
| BABA / Alibaba Group Holding Limited - Depositary Receipt (Common Stock) | 0.02 | -9.13 | 3.30 | 43.19 | 1.0329 | 0.3482 | |||
| EBGEF / Enbridge Inc. - Preferred Stock | 0.06 | 64.28 | 3.14 | 82.97 | 0.9824 | 0.4726 | |||
| CPNG / Coupang, Inc. | 0.10 | -8.32 | 3.07 | -1.48 | 0.9603 | 0.0352 | |||
| NU / Nu Holdings Ltd. | 0.19 | -8.31 | 3.06 | 7.03 | 0.9584 | 0.1081 | |||
| LLY / Eli Lilly and Company | 0.00 | -0.68 | 3.01 | -2.81 | 0.9424 | 0.0222 | |||
| TTE / TotalEnergies SE - Depositary Receipt (Common Stock) | 0.05 | -18.40 | 2.98 | -20.66 | 0.9340 | -0.1834 | |||
| ASML / ASML Holding N.V. - Depositary Receipt (Common Stock) | 0.00 | -8.83 | 2.91 | 10.15 | 0.9105 | 0.1258 | |||
| INTU / Intuit Inc. | 0.00 | 0.41 | 2.83 | -12.94 | 0.8866 | -0.0801 | |||
| PBR / Petróleo Brasileiro S.A. - Petrobras - Depositary Receipt (Common Stock) | 0.22 | -20.86 | 2.83 | -19.92 | 0.8848 | -0.1639 | |||
| LRCX / Lam Research Corporation | 0.02 | -10.33 | 2.73 | 23.36 | 0.8546 | 0.1970 | |||
| VALE / Vale S.A. - Depositary Receipt (Common Stock) | 0.23 | -22.84 | 2.47 | -13.69 | 0.7719 | -0.0771 | |||
| NVS / Novartis AG - Depositary Receipt (Common Stock) | 0.02 | -9.19 | 2.39 | -3.79 | 0.7471 | 0.0102 | |||
| KT / KT Corporation - Depositary Receipt (Common Stock) | 0.11 | -1.85 | 2.20 | -7.91 | 0.6889 | -0.0211 | |||
| NVO / Novo Nordisk A/S - Depositary Receipt (Common Stock) | 0.04 | -8.48 | 2.02 | -26.41 | 0.6314 | -0.1831 | |||
| GEV / GE Vernova Inc. | 0.00 | -39.54 | 1.97 | -29.75 | 0.6180 | -0.2169 | |||
| PHG / Koninklijke Philips N.V. - Depositary Receipt (Common Stock) | 0.07 | -8.22 | 1.89 | 4.36 | 0.5913 | 0.0534 | |||
| TLN / Talen Energy Corporation | 0.00 | -39.07 | 1.86 | -10.85 | 0.5814 | -0.0377 | |||
| NEM / Newmont Corporation | 0.02 | -37.80 | 1.80 | -9.99 | 0.5644 | -0.0308 | |||
| HDB / HDFC Bank Limited - Depositary Receipt (Common Stock) | 0.05 | 83.47 | 1.74 | -18.26 | 0.5452 | -0.0879 | |||
| ETN / Eaton Corporation plc | 0.00 | -32.41 | 1.56 | -29.17 | 0.4882 | -0.1659 | |||
| MELI / MercadoLibre, Inc. | 0.00 | -8.39 | 1.53 | -18.09 | 0.4791 | -0.0761 | |||
| B / Barrick Mining Corporation | 0.04 | -38.44 | 1.47 | -3.04 | 0.4599 | 0.0097 | |||
| VRT / Vertiv Holdings Co | 0.01 | -38.24 | 1.46 | -27.46 | 0.4575 | -0.1411 | |||
| CNH / CNH Industrial N.V. | 0.13 | -8.01 | 1.44 | -23.02 | 0.4513 | -0.1050 | |||
| EXE / Expand Energy Corporation | 0.01 | -36.18 | 1.40 | -42.01 | 0.4395 | -0.2801 | |||
| IBN / ICICI Bank Limited - Depositary Receipt (Common Stock) | 0.04 | -8.48 | 1.35 | -17.76 | 0.4233 | -0.0652 | |||
| G / Genpact Limited | 0.03 | -7.02 | 1.21 | -11.46 | 0.3797 | -0.0275 | |||
| QUAL / iShares Trust - iShares MSCI USA Quality Factor ETF | 0.01 | 0.00 | 1.18 | 6.39 | 0.3700 | 0.0399 | |||
| WIX / Wix.com Ltd. | 0.01 | 6.18 | 1.12 | 19.02 | 0.3508 | 0.0710 | |||
| YUMC / Yum China Holdings, Inc. | 0.03 | -9.61 | 1.09 | -13.25 | 0.3422 | -0.0322 | |||
| NEE / NextEra Energy, Inc. | 0.01 | -38.85 | 1.07 | -33.48 | 0.3346 | -0.1430 | |||
| XP / XP Inc. | 0.05 | -8.46 | 1.02 | -14.85 | 0.3198 | -0.0367 | |||
| LNG / Cheniere Energy, Inc. | 0.00 | -38.32 | 1.02 | -40.52 | 0.3195 | -0.1901 | |||
| RUN / Sunrun Inc. | 0.05 | -41.13 | 0.94 | 24.50 | 0.2943 | 0.0698 | |||
| AA / Alcoa Corporation | 0.03 | -37.79 | 0.92 | -30.67 | 0.2880 | -0.1063 | |||
| CEG / Constellation Energy Corporation | 0.00 | -41.18 | 0.89 | -40.09 | 0.2795 | -0.1629 | |||
| VST / Vistra Corp. | 0.00 | -31.94 | 0.83 | -31.24 | 0.2612 | -0.0992 | |||
| FLR / Fluor Corporation | 0.02 | -37.95 | 0.83 | -49.11 | 0.2584 | -0.2233 | |||
| FCX / Freeport-McMoRan Inc. | 0.02 | -38.96 | 0.80 | -44.81 | 0.2500 | -0.1797 | |||
| EQT / EQT Corporation | 0.01 | -41.31 | 0.77 | -45.22 | 0.2420 | -0.1774 | |||
| CLF / Cleveland-Cliffs Inc. | 0.06 | -36.87 | 0.73 | 1.39 | 0.2288 | 0.0145 | |||
| RIO / Rio Tinto Group - Depositary Receipt (Common Stock) | 0.01 | -36.41 | 0.69 | -28.05 | 0.2162 | -0.0690 | |||
| SQM / Sociedad Química y Minera de Chile S.A. - Depositary Receipt (Common Stock) | 0.02 | -36.23 | 0.68 | -22.37 | 0.2131 | -0.0472 | |||
| FTV / Fortive Corporation | 0.01 | -36.98 | 0.67 | -40.73 | 0.2091 | -0.1260 | |||
| ALB / Albemarle Corporation | 0.01 | -38.46 | 0.53 | -20.39 | 0.1664 | -0.0320 | |||
| CVE / Cenovus Energy Inc. | 0.03 | -38.89 | 0.51 | -23.53 | 0.1587 | -0.0385 | |||
| ST / Sensata Technologies Holding plc | 0.02 | -39.48 | 0.47 | -38.58 | 0.1466 | -0.0800 | |||
| AES / The AES Corporation | 0.04 | -36.17 | 0.46 | -20.14 | 0.1452 | -0.0274 | |||
| KOS / Kosmos Energy Ltd. | 0.27 | -35.56 | 0.45 | -37.79 | 0.1413 | -0.0743 | |||
| AGRO / Adecoagro S.A. | 0.05 | -70.76 | 0.42 | -74.96 | 0.1326 | -0.3693 | |||
| CIVI / Civitas Resources, Inc. | 0.01 | 0.03 | 0.38 | 18.32 | 0.1194 | 0.0235 | |||
| RAL / Ralliant Corporation | 0.01 | 0.00 | 0.32 | -9.74 | 0.0987 | -0.0052 | |||
| AAPL / Apple Inc. | 0.00 | -100.00 | 0.00 | -100.00 | -1.1794 | ||||
| AZN / AstraZeneca PLC - Depositary Receipt (Common Stock) | 0.00 | -100.00 | 0.00 | -100.00 | -0.7830 | ||||
| BRFS / BRF S.A. - Depositary Receipt (Common Stock) | 0.00 | -100.00 | 0.00 | 0.0000 |