Estatísticas Básicas
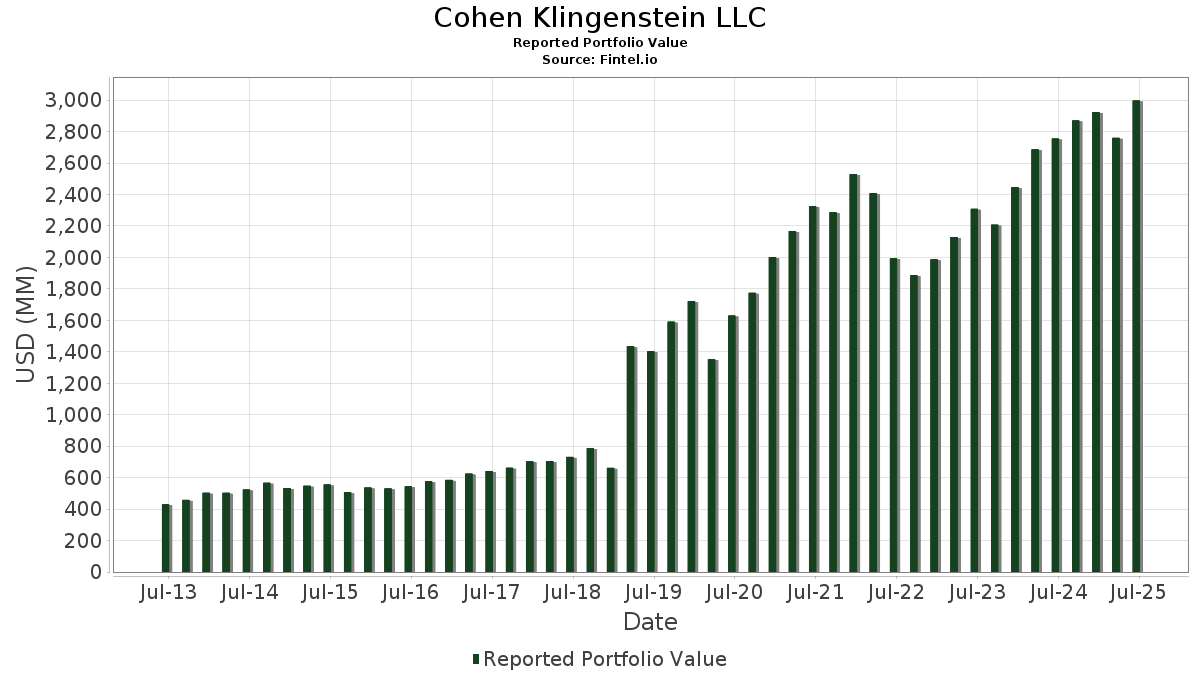
| Valor do Portfólio | $ 3,191,845,034 |
| Posições Atuais | 204 |
Últimas Participações, Desempenho, AUM (de 13F, 13D)
Cohen Klingenstein LLC divulgou 204 participações totais em seus últimos arquivamentos da SEC. O valor mais recente da carteira é calculado como $ 3,191,845,034 USD. O Ativo Total Sob Gestão (AUM) é esse valor mais o caixa (que não é divulgado). As principais posições de Cohen Klingenstein LLC são SPDR S&P 500 ETF (US:SPY) , Vanguard Index Funds - Vanguard Small-Cap Growth ETF (US:VBK) , Invesco QQQ Trust, Series 1 (US:QQQ) , iShares Trust - iShares Russell 2000 Growth ETF (US:IWO) , and Microsoft Corporation (US:MSFT) . As novas posições de Cohen Klingenstein LLC incluem Lam Research Corporation (US:LRCX) , .
Maiores Aumentos Este Trimestre
Usamos a mudança na alocação do portfólio porque esta é a métrica mais significativa. As mudanças podem ser devido a operações ou mudanças nos preços das ações.
| Ativo | Ações (MM) |
Valor (MM$) |
% do Portfólio | Δ% do Portfólio |
|---|---|---|---|---|
| 0.47 | 118.77 | 3.7211 | 0.5280 | |
| 0.14 | 22.04 | 0.6905 | 0.4851 | |
| 0.25 | 61.58 | 1.9292 | 0.4398 | |
| 0.24 | 58.75 | 1.8406 | 0.4070 | |
| 0.46 | 86.58 | 2.7126 | 0.2685 | |
| 0.18 | 58.58 | 1.8352 | 0.2022 | |
| 0.53 | 168.35 | 5.2745 | 0.1966 | |
| 0.05 | 20.70 | 0.6485 | 0.1552 | |
| 0.07 | 20.45 | 0.6406 | 0.1102 | |
| 0.13 | 23.80 | 0.7456 | 0.0894 |
Maiores Diminuições Este Trimestre
Usamos a mudança na alocação do portfólio porque esta é a métrica mais significativa. As mudanças podem ser devido a operações ou mudanças nos preços das ações.
| Ativo | Ações (MM) |
Valor (MM$) |
% do Portfólio | Δ% do Portfólio |
|---|---|---|---|---|
| 0.55 | 63.33 | 1.9840 | -0.3044 | |
| 0.13 | 99.36 | 3.1129 | -0.2741 | |
| 0.55 | 120.45 | 3.7737 | -0.2419 | |
| 0.08 | 58.38 | 1.8291 | -0.1286 | |
| 0.57 | 18.01 | 0.5642 | -0.1194 | |
| 0.29 | 147.87 | 4.6329 | -0.1054 | |
| 0.04 | 18.53 | 0.5806 | -0.0912 | |
| 0.17 | 13.44 | 0.4211 | -0.0889 | |
| 0.17 | 26.82 | 0.8404 | -0.0876 | |
| 0.06 | 11.71 | 0.3670 | -0.0822 |
Arquivamentos 13F e Fundo
Este formulário foi arquivado em 2025-10-16 para o período de relatório 2025-09-30. Clique no ícone de link para ver o histórico completo da transação.
Atualize para desbloquear dados premium e exportar para Excel ![]() .
.
| Ativo | Tipo | Preço Médio por Ação | Ações (MM) |
ΔAções (%) |
Valor ($MM) |
ΔAções (%) |
Portfólio (%) |
ΔPortfólio (%) |
|
|---|---|---|---|---|---|---|---|---|---|
| SPY / SPDR S&P 500 ETF | 1.14 | -1.51 | 757.49 | 6.19 | 23.7320 | -0.0686 | |||
| VBK / Vanguard Index Funds - Vanguard Small-Cap Growth ETF | 0.67 | -1.24 | 199.53 | 6.13 | 6.2513 | -0.0217 | |||
| QQQ / Invesco QQQ Trust, Series 1 | 0.32 | -1.37 | 193.24 | 7.34 | 6.0543 | 0.0474 | |||
| IWO / iShares Trust - iShares Russell 2000 Growth ETF | 0.53 | -1.19 | 168.35 | 10.62 | 5.2745 | 0.1966 | |||
| MSFT / Microsoft Corporation | 0.29 | 0.00 | 147.87 | 4.13 | 4.6329 | -0.1054 | |||
| AMZN / Amazon.com, Inc. | 0.55 | 0.00 | 120.45 | 0.08 | 3.7737 | -0.2419 | |||
| AAPL / Apple Inc. | 0.47 | 0.00 | 118.77 | 24.11 | 3.7211 | 0.5280 | |||
| LLY / Eli Lilly and Company | 0.13 | 0.00 | 99.36 | -2.12 | 3.1129 | -0.2741 | |||
| NVDD / Direxion Shares ETF Trust - Direxion Daily NVDA Bear 1X Shares | 0.46 | 0.09 | 86.58 | 18.20 | 2.7126 | 0.2685 | |||
| DIS / The Walt Disney Company | 0.55 | 0.00 | 63.33 | -7.67 | 1.9840 | -0.3044 | |||
| AXP / American Express Company | 0.19 | 0.00 | 61.84 | 4.13 | 1.9373 | -0.0440 | |||
| GOOGL / Alphabet Inc. | 0.25 | 0.00 | 61.58 | 37.94 | 1.9292 | 0.4398 | |||
| GOOG / Alphabet Inc. | 0.24 | -0.41 | 58.75 | 36.73 | 1.8406 | 0.4070 | |||
| AVGO / Broadcom Inc. | 0.18 | 0.00 | 58.58 | 19.68 | 1.8352 | 0.2022 | |||
| META / Meta Platforms, Inc. | 0.08 | 0.01 | 58.38 | -0.50 | 1.8291 | -0.1286 | |||
| BRK.A / Berkshire Hathaway Inc. | 0.11 | 0.00 | 53.26 | 3.49 | 1.6685 | -0.0484 | |||
| PEP / PepsiCo, Inc. | 0.30 | 0.00 | 41.72 | 6.36 | 1.3071 | -0.0017 | |||
| UNPC / Union Pacific Corporation | 0.12 | -0.04 | 29.30 | 2.69 | 0.9179 | -0.0341 | |||
| GJR / Strats Trust For Procter & Gambel Security - Preferred Security | 0.17 | 0.00 | 26.82 | -3.56 | 0.8404 | -0.0876 | |||
| RTX / RTX Corporation | 0.15 | -2.46 | 25.86 | 11.78 | 0.8101 | 0.0382 | |||
| JNJ / Johnson & Johnson | 0.13 | -0.32 | 23.80 | 21.00 | 0.7456 | 0.0894 | |||
| JPM / JPMorgan Chase & Co. | 0.07 | 0.00 | 22.93 | 8.80 | 0.7184 | 0.0152 | |||
| CVX / Chevron Corporation | 0.14 | 230.08 | 22.04 | 257.97 | 0.6905 | 0.4851 | |||
| YUM / Yum! Brands, Inc. | 0.14 | 0.00 | 22.02 | 2.58 | 0.6899 | -0.0264 | |||
| TSLA / Tesla, Inc. | 0.05 | 0.00 | 20.70 | 40.00 | 0.6485 | 0.1552 | |||
| ORCL / Oracle Corporation | 0.07 | 0.00 | 20.45 | 28.64 | 0.6406 | 0.1102 | |||
| AMP / Ameriprise Financial, Inc. | 0.04 | 0.00 | 18.53 | -7.96 | 0.5806 | -0.0912 | |||
| CMCSA / Comcast Corporation | 0.57 | -0.15 | 18.01 | -12.10 | 0.5642 | -0.1194 | |||
| HIG / The Hartford Insurance Group, Inc. | 0.11 | 0.00 | 14.42 | 5.14 | 0.4519 | -0.0058 | |||
| BAC / Bank of America Corporation | 0.28 | 0.08 | 14.34 | 9.12 | 0.4494 | 0.0108 | |||
| ITW / Illinois Tool Works Inc. | 0.05 | 0.00 | 14.24 | 5.46 | 0.4461 | -0.0044 | |||
| CL / Colgate-Palmolive Company | 0.17 | 0.00 | 13.44 | -12.06 | 0.4211 | -0.0889 | |||
| V / Visa Inc. | 0.04 | 0.00 | 12.29 | -3.85 | 0.3850 | -0.0414 | |||
| AMT / American Tower Corporation | 0.06 | 0.00 | 11.71 | -12.99 | 0.3670 | -0.0822 | |||
| SHEL / Shell plc - Depositary Receipt (Common Stock) | 0.16 | 0.00 | 11.24 | 1.59 | 0.3521 | -0.0170 | |||
| XOM / Exxon Mobil Corporation | 0.10 | 0.00 | 11.21 | 4.59 | 0.3511 | -0.0064 | |||
| PANW / Palo Alto Networks, Inc. | 0.05 | 0.00 | 10.87 | -0.49 | 0.3407 | -0.0240 | |||
| NSC / Norfolk Southern Corporation | 0.04 | 0.00 | 10.66 | 17.37 | 0.3341 | 0.0309 | |||
| MRKCL / Merck & Co., Inc. | 0.12 | -2.39 | 10.42 | 3.50 | 0.3266 | -0.0095 | |||
| GE / General Electric Company | 0.03 | 0.00 | 9.80 | 16.87 | 0.3071 | 0.0273 | |||
| MA / Mastercard Incorporated | 0.02 | 0.00 | 9.56 | 1.23 | 0.2994 | -0.0156 | |||
| TMO / Thermo Fisher Scientific Inc. | 0.02 | 0.00 | 9.50 | 19.63 | 0.2977 | 0.0327 | |||
| FCX / Freeport-McMoRan Inc. | 0.24 | 0.00 | 9.34 | -9.52 | 0.2927 | -0.0518 | |||
| GL / Globe Life Inc. | 0.06 | 0.00 | 9.02 | 15.02 | 0.2826 | 0.0210 | |||
| AMGN / Amgen Inc. | 0.03 | 0.00 | 8.82 | 1.08 | 0.2765 | -0.0148 | |||
| IBM / International Business Machines Corporation | 0.03 | 0.00 | 8.79 | -4.28 | 0.2755 | -0.0310 | |||
| CSCO / Cisco Systems, Inc. | 0.13 | 0.00 | 8.64 | -1.38 | 0.2707 | -0.0216 | |||
| HON / Honeywell International Inc. | 0.04 | 0.00 | 8.55 | -9.62 | 0.2680 | -0.0478 | |||
| CP / Canadian Pacific Kansas City Limited | 0.11 | 0.00 | 8.36 | -6.03 | 0.2618 | -0.0349 | |||
| SAP / SAP SE - Depositary Receipt (Common Stock) | 0.03 | 0.00 | 8.06 | -12.13 | 0.2526 | -0.0536 | |||
| WFC / Wells Fargo & Company | 0.09 | 0.00 | 7.62 | 4.63 | 0.2387 | -0.0043 | |||
| FDX / FedEx Corporation | 0.03 | -4.97 | 7.42 | -1.41 | 0.2323 | -0.0186 | |||
| LH / Labcorp Holdings Inc. | 0.02 | 0.00 | 7.09 | 9.36 | 0.2222 | 0.0058 | |||
| PM / Philip Morris International Inc. | 0.04 | 0.00 | 7.08 | -10.95 | 0.2220 | -0.0435 | |||
| VUG / Vanguard Index Funds - Vanguard Growth ETF | 0.01 | 0.00 | 7.07 | 9.41 | 0.2214 | 0.0059 | |||
| TEL / TE Connectivity plc | 0.03 | 0.00 | 6.89 | 30.15 | 0.2160 | 0.0393 | |||
| VMC / Vulcan Materials Company | 0.02 | 0.00 | 6.70 | 17.95 | 0.2098 | 0.0204 | |||
| ABT / Abbott Laboratories | 0.05 | 0.00 | 6.62 | -1.52 | 0.2074 | -0.0169 | |||
| QCOM / QUALCOMM Incorporated | 0.04 | 0.00 | 6.55 | 4.46 | 0.2054 | -0.0040 | |||
| HD / The Home Depot, Inc. | 0.02 | 0.00 | 6.48 | 10.52 | 0.2031 | 0.0074 | |||
| CRM / Salesforce, Inc. | 0.03 | -1.03 | 6.40 | -13.98 | 0.2006 | -0.0478 | |||
| NFLX / Netflix, Inc. | 0.01 | 0.00 | 5.99 | -10.47 | 0.1878 | -0.0356 | |||
| UNH / UnitedHealth Group Incorporated | 0.02 | 0.29 | 5.96 | 11.02 | 0.1866 | 0.0076 | |||
| COST / Costco Wholesale Corporation | 0.01 | 0.00 | 5.92 | -6.49 | 0.1856 | -0.0258 | |||
| MDT / Medtronic plc | 0.06 | -7.42 | 5.76 | 1.14 | 0.1805 | -0.0096 | |||
| BKNG / Booking Holdings Inc. | 0.00 | 0.00 | 5.40 | -6.74 | 0.1692 | -0.0240 | |||
| ALL / The Allstate Corporation | 0.02 | 0.00 | 5.33 | 6.63 | 0.1669 | 0.0002 | |||
| WMT / Walmart Inc. | 0.05 | 0.00 | 5.26 | 5.42 | 0.1647 | -0.0017 | |||
| GEV / GE Vernova Inc. | 0.01 | 0.00 | 5.01 | 16.23 | 0.1569 | 0.0131 | |||
| MMM / 3M Company | 0.03 | -1.90 | 4.94 | -0.02 | 0.1548 | -0.0101 | |||
| PYPL / PayPal Holdings, Inc. | 0.07 | 0.00 | 4.61 | -9.77 | 0.1444 | -0.0260 | |||
| NEE / NextEra Energy, Inc. | 0.06 | 0.00 | 4.48 | 8.76 | 0.1405 | 0.0029 | |||
| T / AT&T Inc. | 0.15 | 0.00 | 4.37 | -2.41 | 0.1370 | -0.0125 | |||
| PFE / Pfizer Inc. | 0.17 | 0.00 | 4.31 | 5.13 | 0.1349 | -0.0018 | |||
| ABBV / AbbVie Inc. | 0.02 | 0.00 | 4.17 | 24.72 | 0.1306 | 0.0191 | |||
| TXN / Texas Instruments Incorporated | 0.02 | 0.00 | 4.02 | -11.50 | 0.1261 | -0.0256 | |||
| VMGI.X / Vanguard Index Funds - Vanguard Mid-Cap Growth ETF | 0.01 | 0.00 | 3.99 | 3.32 | 0.1249 | -0.0039 | |||
| VZ / Verizon Communications Inc. | 0.09 | 0.00 | 3.98 | 1.56 | 0.1248 | -0.0061 | |||
| YUMC / Yum China Holdings, Inc. | 0.09 | 0.00 | 3.92 | -4.01 | 0.1229 | -0.0134 | |||
| INTC / Intel Corporation | 0.12 | 0.00 | 3.87 | 49.81 | 0.1213 | 0.0350 | |||
| SIEGY / Siemens Aktiengesellschaft - Depositary Receipt (Common Stock) | 0.03 | 0.00 | 3.86 | 4.78 | 0.1210 | -0.0020 | |||
| LIN / Linde plc | 0.01 | 0.00 | 3.80 | 1.25 | 0.1191 | -0.0062 | |||
| ISRG / Intuitive Surgical, Inc. | 0.01 | 0.00 | 3.78 | -17.71 | 0.1185 | -0.0349 | |||
| MS / Morgan Stanley | 0.02 | 0.00 | 3.47 | 12.87 | 0.1086 | 0.0061 | |||
| KO / The Coca-Cola Company | 0.05 | 0.00 | 3.45 | -6.28 | 0.1080 | -0.0147 | |||
| GSK / GSK plc - Depositary Receipt (Common Stock) | 0.08 | 0.00 | 3.43 | 12.40 | 0.1074 | 0.0056 | |||
| COF / Capital One Financial Corporation | 0.02 | 0.00 | 3.41 | -0.09 | 0.1070 | -0.0070 | |||
| TJX / The TJX Companies, Inc. | 0.02 | 0.00 | 3.41 | 17.06 | 0.1069 | 0.0096 | |||
| MO / Altria Group, Inc. | 0.05 | 0.00 | 3.38 | 12.66 | 0.1060 | 0.0058 | |||
| ADP / Automatic Data Processing, Inc. | 0.01 | 0.00 | 3.14 | -4.85 | 0.0984 | -0.0117 | |||
| LOW / Lowe's Companies, Inc. | 0.01 | 0.00 | 3.00 | 13.28 | 0.0941 | 0.0056 | |||
| BSX / Boston Scientific Corporation | 0.03 | 0.00 | 2.98 | -9.13 | 0.0933 | -0.0160 | |||
| GS / The Goldman Sachs Group, Inc. | 0.00 | 0.00 | 2.87 | 12.52 | 0.0898 | 0.0048 | |||
| GEN / Gen Digital Inc. | 0.10 | 0.00 | 2.80 | -3.42 | 0.0877 | -0.0090 | |||
| MET / MetLife, Inc. | 0.03 | 0.00 | 2.78 | 2.43 | 0.0871 | -0.0035 | |||
| DE / Deere & Company | 0.01 | 0.00 | 2.74 | -10.07 | 0.0860 | -0.0158 | |||
| BA / The Boeing Company | 0.01 | 0.00 | 2.74 | 3.01 | 0.0859 | -0.0029 | |||
| MCD / McDonald's Corporation | 0.01 | 0.00 | 2.74 | 4.03 | 0.0857 | -0.0020 | |||
| CARR / Carrier Global Corporation | 0.05 | 0.00 | 2.73 | -18.43 | 0.0854 | -0.0261 | |||
| GHC / Graham Holdings Company | 0.00 | 0.00 | 2.70 | 24.47 | 0.0845 | 0.0122 | |||
| COP / ConocoPhillips | 0.03 | 0.00 | 2.70 | 5.40 | 0.0845 | -0.0009 | |||
| CB / Chubb Limited | 0.01 | 0.00 | 2.57 | -2.57 | 0.0806 | -0.0075 | |||
| EMR / Emerson Electric Co. | 0.02 | 0.00 | 2.39 | -1.61 | 0.0748 | -0.0062 | |||
| EPI / WisdomTree Trust - WisdomTree India Earnings Fund | 0.05 | 0.00 | 2.37 | -6.88 | 0.0742 | -0.0107 | |||
| SYK / Stryker Corporation | 0.01 | 0.00 | 2.37 | -6.60 | 0.0741 | -0.0104 | |||
| VRTX / Vertex Pharmaceuticals Incorporated | 0.01 | 0.00 | 2.35 | -12.06 | 0.0736 | -0.0155 | |||
| VERSX / Vanguard Emerging Markets Stock Index Fund | 0.04 | 0.00 | 2.35 | 9.52 | 0.0735 | 0.0020 | |||
| CCI / Crown Castle Inc. | 0.02 | -4.10 | 2.32 | -9.94 | 0.0727 | -0.0133 | |||
| GILD / Gilead Sciences, Inc. | 0.02 | 0.00 | 2.30 | 0.09 | 0.0720 | -0.0046 | |||
| UPS / United Parcel Service, Inc. | 0.03 | -2.13 | 2.23 | -19.01 | 0.0700 | -0.0220 | |||
| OTIS / Otis Worldwide Corporation | 0.02 | 0.00 | 2.15 | -7.65 | 0.0673 | -0.0103 | |||
| BMY / Bristol-Myers Squibb Company | 0.05 | 0.00 | 2.14 | -2.59 | 0.0672 | -0.0063 | |||
| TGT / Target Corporation | 0.02 | 0.00 | 2.11 | -9.08 | 0.0662 | -0.0113 | |||
| SO / The Southern Company | 0.02 | 0.00 | 2.07 | 3.20 | 0.0647 | -0.0021 | |||
| WM / Waste Management, Inc. | 0.01 | 0.00 | 2.05 | -3.52 | 0.0643 | -0.0067 | |||
| PLD / Prologis, Inc. | 0.02 | 0.00 | 2.04 | 8.96 | 0.0641 | 0.0014 | |||
| MMC / Marsh & McLennan Companies, Inc. | 0.01 | 0.00 | 2.02 | -7.82 | 0.0631 | -0.0098 | |||
| AFL / Aflac Incorporated | 0.02 | 0.00 | 2.01 | 5.90 | 0.0630 | -0.0003 | |||
| LRCX / Lam Research Corporation | 0.01 | 2.01 | 0.0000 | ||||||
| DUKH / Northern Lights Fund Trust - Ocean Park High Income ETF | 0.02 | 0.00 | 2.00 | 4.87 | 0.0628 | -0.0010 | |||
| PTC / PTC Inc. | 0.01 | 0.00 | 1.99 | 17.80 | 0.0624 | 0.0060 | |||
| AMAT / Applied Materials, Inc. | 0.01 | 0.00 | 1.97 | 11.84 | 0.0616 | 0.0029 | |||
| AMD / Advanced Micro Devices, Inc. | 0.01 | 0.00 | 1.96 | 14.04 | 0.0613 | 0.0040 | |||
| MDLZ / Mondelez International, Inc. | 0.03 | 0.00 | 1.94 | -7.39 | 0.0609 | -0.0091 | |||
| DHR / Danaher Corporation | 0.01 | 0.00 | 1.90 | 0.37 | 0.0596 | -0.0036 | |||
| CI / The Cigna Group | 0.01 | 0.00 | 1.90 | -12.79 | 0.0596 | -0.0132 | |||
| ICE / Intercontinental Exchange, Inc. | 0.01 | 0.00 | 1.85 | -8.18 | 0.0581 | -0.0093 | |||
| NOW / ServiceNow, Inc. | 0.00 | 0.00 | 1.84 | -10.51 | 0.0577 | -0.0109 | |||
| GLW / Corning Incorporated | 0.02 | -55.68 | 1.82 | -30.86 | 0.0569 | -0.0307 | |||
| USB / U.S. Bancorp | 0.04 | 0.00 | 1.80 | 6.82 | 0.0565 | 0.0002 | |||
| EA / Electronic Arts Inc. | 0.01 | 0.00 | 1.80 | 26.26 | 0.0564 | 0.0088 | |||
| ABBNY / ABB Ltd - Depositary Receipt (Common Stock) | 0.03 | 0.00 | 1.80 | 20.59 | 0.0564 | 0.0066 | |||
| AON / Aon plc | 0.01 | 0.00 | 1.78 | -0.06 | 0.0559 | -0.0037 | |||
| AIG / American International Group, Inc. | 0.02 | 0.00 | 1.71 | -8.21 | 0.0536 | -0.0086 | |||
| GD / General Dynamics Corporation | 0.01 | 0.00 | 1.71 | 16.94 | 0.0534 | 0.0048 | |||
| ACN / Accenture plc | 0.01 | 0.00 | 1.68 | -17.52 | 0.0525 | -0.0153 | |||
| PNC / The PNC Financial Services Group, Inc. | 0.01 | 0.00 | 1.67 | 7.76 | 0.0522 | 0.0006 | |||
| LMT / Lockheed Martin Corporation | 0.00 | 0.00 | 1.65 | 7.79 | 0.0516 | 0.0006 | |||
| RMD / ResMed Inc. | 0.01 | 0.00 | 1.62 | 6.11 | 0.0506 | -0.0002 | |||
| SYF / Synchrony Financial | 0.02 | 0.00 | 1.59 | 6.44 | 0.0497 | -0.0000 | |||
| ADBE / Adobe Inc. | 0.00 | 0.00 | 1.57 | -8.83 | 0.0492 | -0.0083 | |||
| EQIX / Equinix, Inc. | 0.00 | 0.00 | 1.57 | -1.51 | 0.0491 | -0.0040 | |||
| GM / General Motors Company | 0.03 | 0.00 | 1.52 | 23.90 | 0.0478 | 0.0067 | |||
| SBUX / Starbucks Corporation | 0.02 | 0.00 | 1.52 | -7.70 | 0.0477 | -0.0073 | |||
| CSX / CSX Corporation | 0.04 | 0.00 | 1.44 | 8.86 | 0.0451 | 0.0010 | |||
| NKE / NIKE, Inc. | 0.02 | 0.00 | 1.38 | -1.85 | 0.0433 | -0.0037 | |||
| ETW / Eaton Vance Tax-Managed Global Buy-Write Opportunities Fund | 0.15 | 0.00 | 1.32 | 4.60 | 0.0414 | -0.0007 | |||
| SHW / The Sherwin-Williams Company | 0.00 | 0.00 | 1.31 | 0.84 | 0.0412 | -0.0023 | |||
| EOG / EOG Resources, Inc. | 0.01 | 0.00 | 1.30 | -6.27 | 0.0407 | -0.0055 | |||
| AL / Air Lease Corporation | 0.02 | 0.00 | 1.28 | 8.82 | 0.0402 | 0.0009 | |||
| C.WS.B / Citigroup Inc. | 0.01 | 0.00 | 1.20 | 19.22 | 0.0375 | 0.0040 | |||
| D / Dominion Energy, Inc. | 0.02 | 0.00 | 1.14 | 8.24 | 0.0358 | 0.0006 | |||
| DD / DuPont de Nemours, Inc. | 0.01 | 0.00 | 1.12 | 13.59 | 0.0351 | 0.0022 | |||
| APD / Air Products and Chemicals, Inc. | 0.00 | 0.00 | 1.09 | -3.37 | 0.0342 | -0.0035 | |||
| SEE / Sealed Air Corporation | 0.03 | 0.00 | 1.09 | 14.02 | 0.0342 | 0.0022 | |||
| ECL / Ecolab Inc. | 0.00 | 0.00 | 1.07 | 1.61 | 0.0337 | -0.0016 | |||
| WY / Weyerhaeuser Company | 0.04 | -7.55 | 1.02 | -10.80 | 0.0321 | -0.0062 | |||
| CTVA / Corteva, Inc. | 0.01 | 0.00 | 0.97 | -9.24 | 0.0305 | -0.0053 | |||
| RCL / Royal Caribbean Cruises Ltd. | 0.00 | 0.00 | 0.97 | 3.30 | 0.0304 | -0.0009 | |||
| CVS / CVS Health Corporation | 0.01 | 0.00 | 0.88 | 9.29 | 0.0276 | 0.0007 | |||
| KMB / Kimberly-Clark Corporation | 0.01 | 0.00 | 0.87 | -3.55 | 0.0273 | -0.0028 | |||
| SRE / Sempra | 0.01 | 0.00 | 0.86 | 18.71 | 0.0271 | 0.0028 | |||
| FOXA / Fox Corporation | 0.01 | 0.00 | 0.86 | 12.57 | 0.0269 | 0.0014 | |||
| IHRMF / iShares Public Limited Company - iShares MSCI Japan UCITS ETF USD (Dist) | 0.01 | 0.00 | 0.84 | 6.99 | 0.0264 | 0.0001 | |||
| EBAY / eBay Inc. | 0.01 | 0.00 | 0.84 | 22.04 | 0.0262 | 0.0034 | |||
| BDX / Becton, Dickinson and Company | 0.00 | 0.00 | 0.82 | 8.72 | 0.0258 | 0.0005 | |||
| GEHC / GE HealthCare Technologies Inc. | 0.01 | 0.00 | 0.82 | 1.37 | 0.0255 | -0.0013 | |||
| INGR / Ingredion Incorporated | 0.01 | 0.00 | 0.77 | -9.95 | 0.0241 | -0.0044 | |||
| CCL / Carnival Corporation & plc | 0.03 | 0.00 | 0.77 | 2.82 | 0.0240 | -0.0009 | |||
| CHTR / Charter Communications, Inc. | 0.00 | 0.00 | 0.74 | -32.73 | 0.0233 | -0.0136 | |||
| IDCC / InterDigital, Inc. | 0.00 | 0.00 | 0.73 | 54.11 | 0.0230 | 0.0071 | |||
| HLN / Haleon plc - Depositary Receipt (Common Stock) | 0.08 | 0.00 | 0.73 | -13.48 | 0.0229 | -0.0053 | |||
| HPQ / HP Inc. | 0.03 | 0.00 | 0.71 | 11.41 | 0.0224 | 0.0010 | |||
| 0I35 / Consolidated Edison, Inc. | 0.01 | 0.00 | 0.69 | 0.14 | 0.0217 | -0.0014 | |||
| WBD / Warner Bros. Discovery, Inc. | 0.03 | 0.00 | 0.66 | 70.73 | 0.0207 | 0.0077 | |||
| XEL / Xcel Energy Inc. | 0.01 | 0.00 | 0.65 | 18.51 | 0.0205 | 0.0021 | |||
| ZTS / Zoetis Inc. | 0.00 | 0.00 | 0.65 | -6.09 | 0.0203 | -0.0027 | |||
| HPE / Hewlett Packard Enterprise Company | 0.03 | 0.00 | 0.64 | 20.19 | 0.0202 | 0.0023 | |||
| AEP / American Electric Power Company, Inc. | 0.01 | 0.00 | 0.62 | 8.42 | 0.0194 | 0.0003 | |||
| SPG / Simon Property Group, Inc. | 0.00 | 0.00 | 0.58 | 16.67 | 0.0182 | 0.0016 | |||
| SLAB / Silicon Laboratories Inc. | 0.00 | 0.00 | 0.57 | -11.06 | 0.0179 | -0.0035 | |||
| BIIB / Biogen Inc. | 0.00 | 0.00 | 0.56 | 11.55 | 0.0176 | 0.0008 | |||
| PPG / PPG Industries, Inc. | 0.00 | 0.00 | 0.51 | -7.50 | 0.0159 | -0.0024 | |||
| MDY / SPDR S&P MidCap 400 ETF Trust | 0.00 | 0.00 | 0.48 | 5.08 | 0.0149 | -0.0002 | |||
| KVUE / Kenvue Inc. | 0.03 | -0.78 | 0.46 | -23.09 | 0.0145 | -0.0056 | |||
| SOLV / Solventum Corporation | 0.01 | 0.00 | 0.45 | -3.62 | 0.0142 | -0.0015 | |||
| NWSA / News Corporation | 0.01 | 0.00 | 0.42 | 3.21 | 0.0131 | -0.0004 | |||
| IP / International Paper Company | 0.01 | 0.00 | 0.42 | -0.95 | 0.0131 | -0.0010 | |||
| EFA / iShares Trust - iShares MSCI EAFE ETF | 0.00 | 0.00 | 0.40 | 4.43 | 0.0126 | -0.0002 | |||
| SLB / SLB N.V. | 0.01 | 0.00 | 0.38 | 1.89 | 0.0118 | -0.0006 | |||
| EXC / Exelon Corporation | 0.01 | 0.00 | 0.37 | 3.65 | 0.0116 | -0.0003 | |||
| CABO / Cable One, Inc. | 0.00 | 0.00 | 0.35 | 30.63 | 0.0111 | 0.0020 | |||
| SCHW / The Charles Schwab Corporation | 0.00 | 0.00 | 0.35 | 4.80 | 0.0109 | -0.0002 | |||
| VLTO / Veralto Corporation | 0.00 | 0.00 | 0.34 | 5.57 | 0.0107 | -0.0001 | |||
| DOW / Dow Inc. | 0.01 | 0.00 | 0.33 | -13.42 | 0.0103 | -0.0024 | |||
| IJR / iShares Trust - iShares Core S&P Small-Cap ETF | 0.00 | 0.00 | 0.29 | 8.78 | 0.0089 | 0.0002 | |||
| ILMN / Illumina, Inc. | 0.00 | 0.00 | 0.28 | -0.70 | 0.0089 | -0.0006 | |||
| LW / Lamb Weston Holdings, Inc. | 0.00 | 0.00 | 0.24 | 12.15 | 0.0075 | 0.0004 | |||
| CAG / Conagra Brands, Inc. | 0.01 | 0.00 | 0.23 | -10.28 | 0.0071 | -0.0014 | |||
| JHG / Janus Henderson Group plc | 0.01 | 0.22 | 0.0070 | 0.0070 | |||||
| DOX / Amdocs Limited | 0.00 | 0.00 | 0.22 | -10.25 | 0.0069 | -0.0013 | |||
| HAL / Halliburton Company | 0.01 | 0.21 | 0.0066 | 0.0066 | |||||
| VTRS / Viatris Inc. | 0.02 | 0.00 | 0.18 | 11.04 | 0.0057 | 0.0002 | |||
| FTRE / Fortrea Holdings Inc. | 0.02 | 0.00 | 0.13 | 70.67 | 0.0040 | 0.0015 | |||
| HES / Hess Corporation | 0.00 | -100.00 | 0.00 | 0.0000 | |||||
| SPGI / S&P Global Inc. | 0.00 | -100.00 | 0.00 | 0.0000 |