Estatísticas Básicas
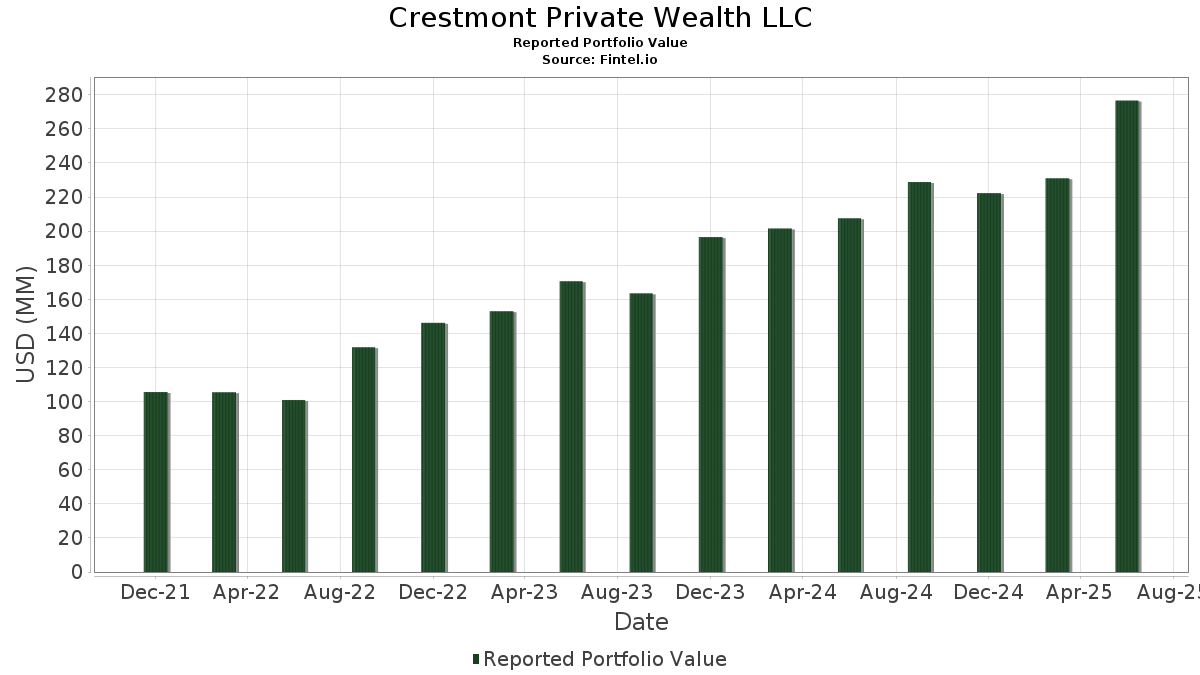
| Valor do Portfólio | $ 302,651,087 |
| Posições Atuais | 95 |
Últimas Participações, Desempenho, AUM (de 13F, 13D)
Crestmont Private Wealth LLC divulgou 95 participações totais em seus últimos arquivamentos da SEC. O valor mais recente da carteira é calculado como $ 302,651,087 USD. O Ativo Total Sob Gestão (AUM) é esse valor mais o caixa (que não é divulgado). As principais posições de Crestmont Private Wealth LLC são iShares Trust - iShares Core S&P 500 ETF (US:IVV) , Vanguard Index Funds - Vanguard S&P 500 ETF (US:VOO) , PIMCO ETF Trust - PIMCO Multisector Bond Active Exchange-Traded Fund (US:PYLD) , PIMCO ETF Trust - PIMCO Active Bond Exchange-Traded Fund (US:BOND) , and Vanguard International Equity Index Funds - Vanguard FTSE Emerging Markets ETF (US:VWO) . As novas posições de Crestmont Private Wealth LLC incluem Valero Energy Corporation (US:VLO) , Cummins Inc. (US:CMI) , L3Harris Technologies, Inc. (US:LHX) , General Dynamics Corporation (US:GD) , and .
Maiores Aumentos Este Trimestre
Usamos a mudança na alocação do portfólio porque esta é a métrica mais significativa. As mudanças podem ser devido a operações ou mudanças nos preços das ações.
| Ativo | Ações (MM) |
Valor (MM$) |
% do Portfólio | Δ% do Portfólio |
|---|---|---|---|---|
| 0.10 | 60.21 | 19.8944 | 0.4759 | |
| 0.01 | 1.29 | 0.4275 | 0.4275 | |
| 0.01 | 1.36 | 0.4485 | 0.1089 | |
| 0.00 | 0.33 | 0.1076 | 0.1076 | |
| 0.00 | 0.31 | 0.1033 | 0.1033 | |
| 0.01 | 1.25 | 0.4139 | 0.0929 | |
| 0.00 | 0.23 | 0.0774 | 0.0774 | |
| 0.00 | 0.22 | 0.0743 | 0.0743 | |
| 0.00 | 0.22 | 0.0734 | 0.0734 | |
| 0.01 | 0.76 | 0.2508 | 0.0732 |
Maiores Diminuições Este Trimestre
Usamos a mudança na alocação do portfólio porque esta é a métrica mais significativa. As mudanças podem ser devido a operações ou mudanças nos preços das ações.
| Ativo | Ações (MM) |
Valor (MM$) |
% do Portfólio | Δ% do Portfólio |
|---|---|---|---|---|
| 0.10 | 65.32 | 21.5824 | -0.6965 | |
| 1.12 | 30.18 | 9.9705 | -0.4800 | |
| 0.19 | 17.30 | 5.7162 | -0.2874 | |
| 0.23 | 11.92 | 3.9385 | -0.2602 | |
| 0.18 | 9.62 | 3.1790 | -0.1817 | |
| 0.33 | 7.93 | 2.6212 | -0.1716 | |
| 0.25 | 15.01 | 4.9600 | -0.1176 | |
| 0.01 | 0.39 | 0.1276 | -0.0922 | |
| 0.11 | 7.40 | 2.4453 | -0.0716 | |
| 0.07 | 1.85 | 0.6104 | -0.0627 |
Arquivamentos 13F e Fundo
Este formulário foi arquivado em 2025-11-13 para o período de relatório 2025-09-30. Clique no ícone de link para ver o histórico completo da transação.
Atualize para desbloquear dados premium e exportar para Excel ![]() .
.
| Ativo | Tipo | Preço Médio por Ação | Ações (MM) |
ΔAções (%) |
Valor ($MM) |
ΔAções (%) |
Portfólio (%) |
ΔPortfólio (%) |
|
|---|---|---|---|---|---|---|---|---|---|
| IVV / iShares Trust - iShares Core S&P 500 ETF | 0.10 | -1.67 | 65.32 | 5.99 | 21.5824 | -0.6965 | |||
| VOO / Vanguard Index Funds - Vanguard S&P 500 ETF | 0.10 | 3.98 | 60.21 | 12.10 | 19.8944 | 0.4759 | |||
| PYLD / PIMCO ETF Trust - PIMCO Multisector Bond Active Exchange-Traded Fund | 1.12 | 3.22 | 30.18 | 4.39 | 9.9705 | -0.4800 | |||
| BOND / PIMCO ETF Trust - PIMCO Active Bond Exchange-Traded Fund | 0.19 | 2.87 | 17.30 | 4.18 | 5.7162 | -0.2874 | |||
| VWO / Vanguard International Equity Index Funds - Vanguard FTSE Emerging Markets ETF | 0.29 | 0.60 | 15.72 | 10.20 | 5.1949 | 0.0371 | |||
| VEA / Vanguard Tax-Managed Funds - Vanguard FTSE Developed Markets ETF | 0.25 | 1.69 | 15.01 | 6.88 | 4.9600 | -0.1176 | |||
| JPST / J.P. Morgan Exchange-Traded Fund Trust - JPMorgan Ultra-Short Income ETF | 0.23 | 2.53 | 11.92 | 2.63 | 3.9385 | -0.2602 | |||
| DFAT / Dimensional ETF Trust - Dimensional U.S. Targeted Value ETF | 0.19 | 1.57 | 11.03 | 9.57 | 3.6459 | 0.0053 | |||
| MUNI / PIMCO ETF Trust - PIMCO Intermediate Municipal Bond Active Exchange-Traded Fund | 0.18 | 1.68 | 9.62 | 3.51 | 3.1790 | -0.1817 | |||
| DFAR / Dimensional ETF Trust - Dimensional US Real Estate ETF | 0.33 | 1.01 | 7.93 | 2.69 | 2.6212 | -0.1716 | |||
| IJH / iShares Trust - iShares Core S&P Mid-Cap ETF | 0.11 | 1.02 | 7.40 | 6.29 | 2.4453 | -0.0716 | |||
| IJR / iShares Trust - iShares Core S&P Small-Cap ETF | 0.04 | 1.80 | 5.08 | 10.69 | 1.6794 | 0.0194 | |||
| IBDQ / iShares Trust - iShares iBonds Dec 2025 Term Corporate ETF | 0.07 | -0.81 | 1.85 | -0.75 | 0.6104 | -0.0627 | |||
| IBTF / iShares Trust - iShares iBonds Dec 2025 Term Treasury ETF | 0.08 | -0.82 | 1.83 | -0.81 | 0.6055 | -0.0623 | |||
| IWB / iShares Trust - iShares Russell 1000 ETF | 0.00 | 0.00 | 1.65 | 7.62 | 0.5461 | -0.0091 | |||
| GOOGL / Alphabet Inc. | 0.01 | 4.75 | 1.36 | 44.52 | 0.4485 | 0.1089 | |||
| VLO / Valero Energy Corporation | 0.01 | 1.29 | 0.4275 | 0.4275 | |||||
| GDXJ / VanEck ETF Trust - VanEck Junior Gold Miners ETF | 0.01 | -3.71 | 1.25 | 41.15 | 0.4139 | 0.0929 | |||
| MLI / Mueller Industries, Inc. | 0.01 | 7.90 | 1.06 | 37.27 | 0.3495 | 0.0710 | |||
| V / Visa Inc. | 0.00 | 5.30 | 1.00 | 1.31 | 0.3318 | -0.0268 | |||
| AAPL / Apple Inc. | 0.00 | 6.00 | 0.98 | 31.54 | 0.3240 | 0.0545 | |||
| SPGI / S&P Global Inc. | 0.00 | 12.78 | 0.92 | 4.18 | 0.3051 | -0.0156 | |||
| ITW / Illinois Tool Works Inc. | 0.00 | 13.24 | 0.92 | 19.56 | 0.3050 | 0.0256 | |||
| NDAQ / Nasdaq, Inc. | 0.01 | 4.63 | 0.90 | 3.45 | 0.2972 | -0.0170 | |||
| VRSN / VeriSign, Inc. | 0.00 | 4.76 | 0.90 | 1.35 | 0.2970 | -0.0234 | |||
| BRK.B / Berkshire Hathaway Inc. | 0.00 | 8.80 | 0.88 | 12.60 | 0.2895 | 0.0082 | |||
| DGX / Quest Diagnostics Incorporated | 0.00 | 6.08 | 0.83 | 12.55 | 0.2757 | 0.0077 | |||
| ICE / Intercontinental Exchange, Inc. | 0.00 | 10.30 | 0.83 | 1.22 | 0.2755 | -0.0221 | |||
| HD / The Home Depot, Inc. | 0.00 | 6.66 | 0.82 | 17.87 | 0.2703 | 0.0194 | |||
| AZO / AutoZone, Inc. | 0.00 | 5.62 | 0.81 | 22.12 | 0.2665 | 0.0276 | |||
| CVX / Chevron Corporation | 0.01 | 19.06 | 0.80 | 29.19 | 0.2648 | 0.0404 | |||
| NVDD / Direxion Shares ETF Trust - Direxion Daily NVDA Bear 1X Shares | 0.00 | -2.31 | 0.80 | 15.34 | 0.2636 | 0.0136 | |||
| MKL / Markel Group Inc. | 0.00 | 5.41 | 0.78 | 0.90 | 0.2583 | -0.0219 | |||
| LRCX / Lam Research Corporation | 0.01 | 12.32 | 0.76 | 54.58 | 0.2508 | 0.0732 | |||
| MA / Mastercard Incorporated | 0.00 | 13.94 | 0.76 | 15.40 | 0.2503 | 0.0129 | |||
| MCO / Moody's Corporation | 0.00 | 10.83 | 0.74 | 5.29 | 0.2432 | -0.0095 | |||
| AVGO / Broadcom Inc. | 0.00 | -5.28 | 0.72 | 13.47 | 0.2367 | 0.0082 | |||
| ADSK / Autodesk, Inc. | 0.00 | 15.30 | 0.69 | 18.38 | 0.2278 | 0.0171 | |||
| QCOM / QUALCOMM Incorporated | 0.00 | 22.45 | 0.68 | 27.74 | 0.2240 | 0.0324 | |||
| TH / Target Hospitality Corp. | 0.08 | -13.62 | 0.66 | 2.97 | 0.2178 | -0.0138 | |||
| IDXX / IDEXX Laboratories, Inc. | 0.00 | 13.44 | 0.66 | 35.39 | 0.2174 | 0.0414 | |||
| VRSK / Verisk Analytics, Inc. | 0.00 | 13.54 | 0.64 | -8.30 | 0.2118 | -0.0410 | |||
| NVR / NVR, Inc. | 0.00 | 11.27 | 0.63 | 20.99 | 0.2097 | 0.0202 | |||
| GDX / VanEck ETF Trust - VanEck Gold Miners ETF | 0.01 | -1.86 | 0.63 | 44.01 | 0.2068 | 0.0497 | |||
| ROP / Roper Technologies, Inc. | 0.00 | 10.25 | 0.61 | -3.04 | 0.2002 | -0.0256 | |||
| MSCI / MSCI Inc. | 0.00 | 10.74 | 0.57 | 9.04 | 0.1875 | -0.0008 | |||
| NEM / Newmont Corporation | 0.01 | 0.00 | 0.55 | 44.71 | 0.1810 | 0.0442 | |||
| SCHX / Schwab Strategic Trust - Schwab U.S. Large-Cap ETF | 0.02 | 4.50 | 0.55 | 12.81 | 0.1804 | 0.0051 | |||
| ADBE / Adobe Inc. | 0.00 | 25.52 | 0.53 | 14.57 | 0.1742 | 0.0077 | |||
| COP / ConocoPhillips | 0.01 | 0.00 | 0.53 | 5.41 | 0.1739 | -0.0066 | |||
| GLD / SPDR Gold Shares | 0.00 | 0.00 | 0.51 | 16.67 | 0.1689 | 0.0104 | |||
| RING / iShares, Inc. - iShares MSCI Global Gold Miners ETF | 0.01 | 0.00 | 0.47 | 47.63 | 0.1549 | 0.0402 | |||
| CAT / Caterpillar Inc. | 0.00 | 8.18 | 0.47 | 33.05 | 0.1543 | 0.0273 | |||
| PH / Parker-Hannifin Corporation | 0.00 | 7.43 | 0.46 | 16.75 | 0.1521 | 0.0094 | |||
| STEL / Stellar Bancorp, Inc. | 0.01 | -41.42 | 0.39 | -36.41 | 0.1276 | -0.0922 | |||
| SNA / Snap-on Incorporated | 0.00 | 9.47 | 0.36 | 22.03 | 0.1191 | 0.0122 | |||
| PKG / Packaging Corporation of America | 0.00 | 9.80 | 0.36 | 27.14 | 0.1178 | 0.0163 | |||
| GILD / Gilead Sciences, Inc. | 0.00 | 9.42 | 0.35 | 9.66 | 0.1163 | 0.0001 | |||
| TSLA / Tesla, Inc. | 0.00 | -0.77 | 0.34 | 38.87 | 0.1136 | 0.0241 | |||
| HAS / Hasbro, Inc. | 0.00 | 8.92 | 0.34 | 11.76 | 0.1133 | 0.0025 | |||
| EMR / Emerson Electric Co. | 0.00 | 9.45 | 0.34 | 7.64 | 0.1120 | -0.0018 | |||
| LMT / Lockheed Martin Corporation | 0.00 | 11.73 | 0.33 | 20.59 | 0.1084 | 0.0099 | |||
| STX / Seagate Technology Holdings plc | 0.00 | 0.33 | 0.1076 | 0.1076 | |||||
| RL / Ralph Lauren Corporation | 0.00 | 10.04 | 0.32 | 26.09 | 0.1056 | 0.0138 | |||
| GLW / Corning Incorporated | 0.00 | 0.31 | 0.1033 | 0.1033 | |||||
| PSA / Public Storage | 0.00 | 11.71 | 0.31 | 9.89 | 0.1029 | 0.0005 | |||
| EOG / EOG Resources, Inc. | 0.00 | 9.69 | 0.30 | 2.70 | 0.1007 | -0.0065 | |||
| AMGN / Amgen Inc. | 0.00 | 11.67 | 0.29 | 12.50 | 0.0955 | 0.0029 | |||
| GJR / Strats Trust For Procter & Gambel Security - Preferred Security | 0.00 | 12.00 | 0.28 | 8.02 | 0.0938 | -0.0012 | |||
| PRU / Prudential Financial, Inc. | 0.00 | 12.31 | 0.27 | 8.30 | 0.0907 | -0.0008 | |||
| GRMN / Garmin Ltd. | 0.00 | 12.73 | 0.27 | 33.33 | 0.0886 | 0.0157 | |||
| XOM / Exxon Mobil Corporation | 0.00 | 0.00 | 0.26 | 4.78 | 0.0870 | -0.0040 | |||
| NFLX / Netflix, Inc. | 0.00 | -5.33 | 0.26 | -15.28 | 0.0844 | -0.0245 | |||
| UAL / United Airlines Holdings, Inc. | 0.00 | 0.00 | 0.26 | 21.43 | 0.0843 | 0.0082 | |||
| GE / General Electric Company | 0.00 | 0.00 | 0.25 | 17.21 | 0.0834 | 0.0053 | |||
| XOP / SPDR Series Trust - State Street SPDR S&P Oil & Gas Exploration & Production ETF | 0.00 | 0.00 | 0.25 | 5.15 | 0.0811 | -0.0033 | |||
| CBRE / CBRE Group, Inc. | 0.00 | -1.35 | 0.24 | 11.01 | 0.0800 | 0.0011 | |||
| LYV / Live Nation Entertainment, Inc. | 0.00 | -0.55 | 0.24 | 7.24 | 0.0786 | -0.0015 | |||
| EBAY / eBay Inc. | 0.00 | 0.23 | 0.0774 | 0.0774 | |||||
| PSX / Phillips 66 | 0.00 | 0.00 | 0.23 | 13.86 | 0.0763 | 0.0031 | |||
| JPM / JPMorgan Chase & Co. | 0.00 | -1.09 | 0.23 | 7.55 | 0.0755 | -0.0013 | |||
| LYB / LyondellBasell Industries N.V. | 0.00 | 0.22 | 0.0743 | 0.0743 | |||||
| CMI / Cummins Inc. | 0.00 | 0.22 | 0.0734 | 0.0734 | |||||
| IBM / International Business Machines Corporation | 0.00 | 0.00 | 0.22 | -4.35 | 0.0729 | -0.0104 | |||
| ORLY / O'Reilly Automotive, Inc. | 0.00 | 0.22 | 0.0727 | 0.0727 | |||||
| META / Meta Platforms, Inc. | 0.00 | -8.83 | 0.21 | -9.01 | 0.0701 | -0.0145 | |||
| PWR / Quanta Services, Inc. | 0.00 | 0.21 | 0.0697 | 0.0697 | |||||
| UPS / United Parcel Service, Inc. | 0.00 | 22.38 | 0.21 | 0.97 | 0.0693 | -0.0056 | |||
| LHX / L3Harris Technologies, Inc. | 0.00 | 0.21 | 0.0690 | 0.0690 | |||||
| GD / General Dynamics Corporation | 0.00 | 0.21 | 0.0686 | 0.0686 | |||||
| TPL / Texas Pacific Land Corporation | 0.00 | 0.20 | 0.0666 | 0.0666 | |||||
| FTXP / Foothills Exploration, Inc. | 0.00 | 0.20 | 0.0663 | 0.0663 | |||||
| ABBV / AbbVie Inc. | 0.00 | 0.20 | 0.0661 | 0.0661 | |||||
| F / Ford Motor Company | 0.01 | 2.05 | 0.14 | 12.50 | 0.0446 | 0.0012 | |||
| EGY / VAALCO Energy, Inc. | 0.01 | 0.00 | 0.04 | 12.82 | 0.0146 | 0.0003 | |||
| RSG / Republic Services, Inc. | 0.00 | -100.00 | 0.00 | 0.0000 |