Estatísticas Básicas
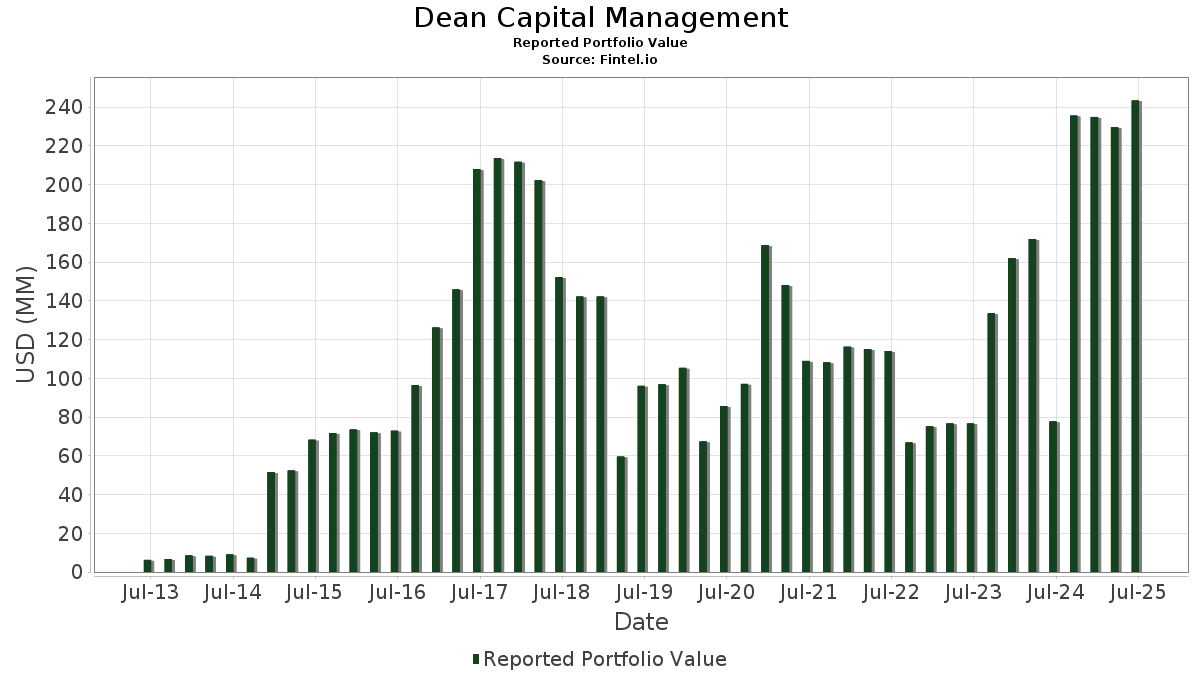
| Valor do Portfólio | $ 256,458,167 |
| Posições Atuais | 121 |
Últimas Participações, Desempenho, AUM (de 13F, 13D)
Dean Capital Management divulgou 121 participações totais em seus últimos arquivamentos da SEC. O valor mais recente da carteira é calculado como $ 256,458,167 USD. O Ativo Total Sob Gestão (AUM) é esse valor mais o caixa (que não é divulgado). As principais posições de Dean Capital Management são Littelfuse, Inc. (US:LFUS) , Advanced Energy Industries, Inc. (US:AEIS) , ESCO Technologies Inc. (US:ESE) , Bel Fuse Inc. (US:BELFB) , and Visteon Corporation (US:VC) . As novas posições de Dean Capital Management incluem LKQ Corporation (US:LKQ) , Synaptics Incorporated (US:SYNA) , Jefferies Financial Group Inc. (US:JEF) , Capri Holdings Limited (US:CPRI) , and Avantor, Inc. (US:AVTR) .
Maiores Aumentos Este Trimestre
Usamos a mudança na alocação do portfólio porque esta é a métrica mais significativa. As mudanças podem ser devido a operações ou mudanças nos preços das ações.
| Ativo | Ações (MM) |
Valor (MM$) |
% do Portfólio | Δ% do Portfólio |
|---|---|---|---|---|
| 0.04 | 4.26 | 1.6595 | 1.6595 | |
| 0.03 | 4.13 | 1.6105 | 1.0629 | |
| 0.11 | 2.57 | 0.9845 | 0.9845 | |
| 0.03 | 7.30 | 2.7970 | 0.7225 | |
| 0.04 | 3.49 | 1.3604 | 0.6610 | |
| 0.06 | 1.69 | 0.6591 | 0.6591 | |
| 0.02 | 1.66 | 0.6454 | 0.6454 | |
| 0.10 | 3.25 | 1.2465 | 0.6236 | |
| 0.02 | 1.57 | 0.6129 | 0.6129 | |
| 0.10 | 4.09 | 1.5653 | 0.6064 |
Maiores Diminuições Este Trimestre
Usamos a mudança na alocação do portfólio porque esta é a métrica mais significativa. As mudanças podem ser devido a operações ou mudanças nos preços das ações.
| Ativo | Ações (MM) |
Valor (MM$) |
% do Portfólio | Δ% do Portfólio |
|---|---|---|---|---|
| 0.01 | 1.39 | 0.5419 | -1.1272 | |
| 0.12 | 1.78 | 0.6817 | -0.7311 | |
| 0.00 | 0.00 | -0.6914 | ||
| 0.00 | 0.00 | -0.6887 | ||
| 0.05 | 1.33 | 0.5169 | -0.6759 | |
| 0.05 | 1.79 | 0.6974 | -0.5885 | |
| 0.08 | 0.66 | 0.2527 | -0.5571 | |
| 0.00 | 0.00 | -0.5302 | ||
| 0.03 | 1.63 | 0.6247 | -0.4970 | |
| 0.00 | 0.89 | 0.3452 | -0.4633 |
Arquivamentos 13F e Fundo
Este formulário foi arquivado em 2025-11-14 para o período de relatório 2025-09-30. Clique no ícone de link para ver o histórico completo da transação.
Atualize para desbloquear dados premium e exportar para Excel ![]() .
.
| Ativo | Tipo | Preço Médio por Ação | Ações (MM) |
ΔAções (%) |
Valor ($MM) |
ΔAções (%) |
Portfólio (%) |
ΔPortfólio (%) |
|
|---|---|---|---|---|---|---|---|---|---|
| LFUS / Littelfuse, Inc. | 0.03 | 26.64 | 7.30 | 44.68 | 2.7970 | 0.7225 | |||
| AEIS / Advanced Energy Industries, Inc. | 0.03 | -7.90 | 4.80 | 18.25 | 1.8727 | 0.2037 | |||
| ESE / ESCO Technologies Inc. | 0.02 | 7.33 | 4.58 | 18.11 | 1.7855 | 0.1920 | |||
| BELFB / Bel Fuse Inc. | 0.03 | -23.17 | 4.55 | 10.91 | 1.7414 | 0.0568 | |||
| VC / Visteon Corporation | 0.04 | 4.26 | 1.6595 | 1.6595 | |||||
| ASTE / Astec Industries, Inc. | 0.09 | 33.12 | 4.18 | 53.73 | 1.6023 | 0.4836 | |||
| KWR / Quaker Chemical Corporation | 0.03 | 163.37 | 4.13 | 210.06 | 1.6105 | 1.0629 | |||
| JOUT / Johnson Outdoors Inc. | 0.10 | 31.27 | 4.09 | 75.14 | 1.5653 | 0.6064 | |||
| INDB / Independent Bank Corp. | 0.05 | 19.75 | 3.78 | 31.70 | 1.4486 | 0.2686 | |||
| YETI / YETI Holdings, Inc. | 0.11 | 40.16 | 3.57 | 47.60 | 1.3670 | 0.3729 | |||
| MMS / Maximus, Inc. | 0.04 | 57.51 | 3.49 | 105.06 | 1.3604 | 0.6610 | |||
| BK / The Bank of New York Mellon Corporation | 0.03 | -8.57 | 3.40 | 9.32 | 1.3038 | 0.0244 | |||
| CATY / Cathay General Bancorp | 0.07 | 31.99 | 3.28 | 39.20 | 1.2568 | 0.2879 | |||
| MBUU / Malibu Boats, Inc. | 0.10 | 107.38 | 3.25 | 114.79 | 1.2465 | 0.6236 | |||
| SHOO / Steven Madden, Ltd. | 0.10 | -20.09 | 3.25 | 11.58 | 1.2441 | 0.0476 | |||
| THFF / First Financial Corporation | 0.06 | 16.65 | 3.14 | 21.48 | 1.2044 | 0.1408 | |||
| QCRH / QCR Holdings, Inc. | 0.04 | 32.33 | 3.11 | 47.42 | 1.2138 | 0.3460 | |||
| HP / Helmerich & Payne, Inc. | 0.13 | -28.10 | 2.96 | 4.77 | 1.1351 | -0.0273 | |||
| BNL / Broadstone Net Lease, Inc. | 0.16 | 22.54 | 2.90 | 36.48 | 1.1095 | 0.2370 | |||
| VRRM / Verra Mobility Corporation | 0.11 | 38.41 | 2.82 | 34.65 | 1.0809 | 0.2196 | |||
| HCSG / Healthcare Services Group, Inc. | 0.16 | 80.27 | 2.73 | 101.85 | 1.0627 | 0.5079 | |||
| LHX / L3Harris Technologies, Inc. | 0.01 | -12.61 | 2.71 | 6.37 | 1.0365 | -0.0087 | |||
| JAZZ / Jazz Pharmaceuticals plc | 0.02 | 0.00 | 2.70 | 24.23 | 1.0351 | 0.1409 | |||
| BWA / BorgWarner Inc. | 0.06 | 0.00 | 2.63 | 31.31 | 1.0273 | 0.2027 | |||
| AEE / Ameren Corporation | 0.03 | 0.00 | 2.61 | 8.70 | 1.0003 | 0.0128 | |||
| INVX / Innovex International, Inc. | 0.14 | -22.49 | 2.59 | -8.00 | 1.0096 | -0.1471 | |||
| COHU / Cohu, Inc. | 0.13 | 41.50 | 2.59 | 49.51 | 0.9915 | 0.2800 | |||
| REYN / Reynolds Consumer Products Inc. | 0.11 | 2.57 | 0.9845 | 0.9845 | |||||
| VIAV / Viavi Solutions Inc. | 0.20 | 23.76 | 2.55 | 55.97 | 0.9932 | 0.3220 | |||
| PRG / PROG Holdings, Inc. | 0.08 | 1.21 | 2.50 | 11.59 | 0.9594 | 0.0369 | |||
| BRC / Brady Corporation | 0.03 | 86.01 | 2.50 | 113.57 | 0.9591 | 0.4772 | |||
| SSNC / SS&C Technologies Holdings, Inc. | 0.03 | 0.00 | 2.48 | 7.17 | 0.9674 | 0.0163 | |||
| WRB / W. R. Berkley Corporation | 0.03 | 0.00 | 2.46 | 4.28 | 0.9437 | -0.0272 | |||
| EHC / Encompass Health Corporation | 0.02 | 0.00 | 2.43 | 3.58 | 0.9318 | -0.0334 | |||
| RUSHA / Rush Enterprises, Inc. | 0.04 | -8.63 | 2.38 | -5.14 | 0.9293 | -0.1034 | |||
| AIZ / Assurant, Inc. | 0.01 | 0.00 | 2.36 | 9.68 | 0.9193 | 0.0359 | |||
| RF / Regions Financial Corporation | 0.09 | 12.96 | 2.35 | 26.63 | 0.9181 | 0.1540 | |||
| PB / Prosperity Bancshares, Inc. | 0.03 | 11.21 | 2.32 | 5.07 | 0.9052 | -0.0030 | |||
| HIG / The Hartford Insurance Group, Inc. | 0.02 | 0.00 | 2.31 | 5.10 | 0.8995 | -0.0022 | |||
| DG / Dollar General Corporation | 0.02 | 0.00 | 2.31 | -9.64 | 0.8990 | -0.1496 | |||
| DGX / Quest Diagnostics Incorporated | 0.01 | 0.00 | 2.31 | 6.12 | 0.8989 | 0.0059 | |||
| ATO / Atmos Energy Corporation | 0.01 | 0.00 | 2.29 | 10.77 | 0.8789 | 0.0278 | |||
| JBSS / John B. Sanfilippo & Son, Inc. | 0.04 | 163.35 | 2.29 | 167.76 | 0.8779 | 0.5260 | |||
| GSBC / Great Southern Bancorp, Inc. | 0.04 | 17.72 | 2.28 | 22.66 | 0.8749 | 0.1096 | |||
| REG / Regency Centers Corporation | 0.03 | 12.08 | 2.23 | 14.68 | 0.8686 | 0.0705 | |||
| GTES / Gates Industrial Corporation plc | 0.09 | 0.00 | 2.22 | 7.77 | 0.8650 | 0.0191 | |||
| BKR / Baker Hughes Company | 0.04 | 11.05 | 2.17 | 41.13 | 0.8296 | 0.1989 | |||
| ITT / ITT Inc. | 0.01 | 0.00 | 2.11 | 13.97 | 0.8066 | 0.0473 | |||
| SMP / Standard Motor Products, Inc. | 0.05 | -32.65 | 2.10 | -10.49 | 0.8037 | -0.1599 | |||
| WCC / WESCO International, Inc. | 0.01 | 17.83 | 2.10 | 34.53 | 0.8175 | 0.1772 | |||
| SRCE / 1st Source Corporation | 0.03 | -19.48 | 2.09 | -20.14 | 0.8022 | -0.2757 | |||
| ARW / Arrow Electronics, Inc. | 0.02 | 0.00 | 2.09 | -5.04 | 0.8007 | -0.1041 | |||
| XEL / Xcel Energy Inc. | 0.03 | 0.00 | 2.09 | 18.42 | 0.8149 | 0.0897 | |||
| RGA / Reinsurance Group of America, Incorporated | 0.01 | 0.00 | 2.08 | -3.17 | 0.7959 | -0.0858 | |||
| AVB / AvalonBay Communities, Inc. | 0.01 | 18.12 | 2.07 | 12.11 | 0.7944 | 0.0342 | |||
| RJF / Raymond James Financial, Inc. | 0.01 | 0.00 | 2.06 | 12.56 | 0.8037 | 0.0510 | |||
| OGE / OGE Energy Corp. | 0.04 | 0.00 | 2.05 | 4.27 | 0.7867 | -0.0229 | |||
| OMC / Omnicom Group Inc. | 0.02 | 12.65 | 2.01 | 27.71 | 0.7716 | 0.1231 | |||
| PLOW / Douglas Dynamics, Inc. | 0.06 | -18.11 | 2.01 | -13.17 | 0.7703 | -0.1812 | |||
| CNP / CenterPoint Energy, Inc. | 0.05 | 0.00 | 2.01 | 5.57 | 0.7702 | -0.0123 | |||
| CBRE / CBRE Group, Inc. | 0.01 | 0.00 | 1.99 | 12.45 | 0.7750 | 0.0486 | |||
| USFD / US Foods Holding Corp. | 0.03 | 0.00 | 1.95 | -0.51 | 0.7472 | -0.0586 | |||
| PHM / PulteGroup, Inc. | 0.01 | 0.00 | 1.95 | 25.32 | 0.7584 | 0.1204 | |||
| RRX / Regal Rexnord Corporation | 0.01 | 0.00 | 1.93 | -1.03 | 0.7519 | -0.0490 | |||
| MCHP / Microchip Technology Incorporated | 0.03 | -14.56 | 1.90 | -22.04 | 0.7408 | -0.2606 | |||
| DOV / Dover Corporation | 0.01 | 0.00 | 1.89 | -8.96 | 0.7246 | -0.1293 | |||
| RSG / Republic Services, Inc. | 0.01 | 18.64 | 1.86 | 10.39 | 0.7128 | 0.0200 | |||
| AGCO / AGCO Corporation | 0.02 | 0.00 | 1.84 | 3.78 | 0.7182 | -0.0111 | |||
| AVY / Avery Dennison Corporation | 0.01 | 0.00 | 1.84 | -7.59 | 0.7171 | -0.1007 | |||
| WHD / Cactus, Inc. | 0.05 | -36.68 | 1.79 | -42.84 | 0.6974 | -0.5885 | |||
| VSH / Vishay Intertechnology, Inc. | 0.12 | -46.27 | 1.78 | -48.24 | 0.6817 | -0.7311 | |||
| WKC / World Kinect Corporation | 0.07 | -21.90 | 1.76 | -28.51 | 0.6855 | -0.3251 | |||
| BR / Broadridge Financial Solutions, Inc. | 0.01 | 0.00 | 1.75 | -2.01 | 0.6708 | -0.0636 | |||
| IFF / International Flavors & Fragrances Inc. | 0.03 | 11.89 | 1.74 | -6.34 | 0.6673 | -0.0975 | |||
| PR / Permian Resources Corporation | 0.14 | 0.00 | 1.74 | -6.01 | 0.6650 | -0.0942 | |||
| ZBH / Zimmer Biomet Holdings, Inc. | 0.02 | 0.00 | 1.73 | 7.99 | 0.6628 | 0.0043 | |||
| BJ / BJ's Wholesale Club Holdings, Inc. | 0.02 | 17.78 | 1.72 | 1.84 | 0.6572 | -0.0351 | |||
| EMN / Eastman Chemical Company | 0.03 | 26.09 | 1.71 | 6.46 | 0.6682 | 0.0068 | |||
| KNX / Knight-Swift Transportation Holdings Inc. | 0.04 | 10.75 | 1.71 | -1.10 | 0.6533 | -0.0552 | |||
| CSGS / CSG Systems International, Inc. | 0.03 | -27.42 | 1.70 | -28.46 | 0.6639 | -0.3142 | |||
| CTRA / Coterra Energy Inc. | 0.07 | 0.00 | 1.70 | -6.85 | 0.6511 | -0.0986 | |||
| LKQ / LKQ Corporation | 0.06 | 1.69 | 0.6591 | 0.6591 | |||||
| HAS / Hasbro, Inc. | 0.02 | 0.00 | 1.67 | 2.77 | 0.6393 | -0.0283 | |||
| LAD / Lithia Motors, Inc. | 0.01 | 0.00 | 1.66 | -6.42 | 0.6363 | -0.0936 | |||
| SYNA / Synaptics Incorporated | 0.02 | 1.66 | 0.6454 | 0.6454 | |||||
| STAG / STAG Industrial, Inc. | 0.05 | 0.00 | 1.65 | -2.76 | 0.6338 | -0.0653 | |||
| PRGO / Perrigo Company plc | 0.07 | -8.84 | 1.63 | -24.00 | 0.6248 | -0.2575 | |||
| PZZA / Papa John's International, Inc. | 0.03 | -39.26 | 1.63 | -40.23 | 0.6247 | -0.4970 | |||
| WY / Weyerhaeuser Company | 0.07 | 0.00 | 1.62 | -3.51 | 0.6331 | -0.0584 | |||
| FHI / Federated Hermes, Inc. | 0.03 | 17.81 | 1.62 | 38.11 | 0.6318 | 0.1494 | |||
| AIR / AAR Corp. | 0.02 | 1.57 | 0.6129 | 0.6129 | |||||
| JEF / Jefferies Financial Group Inc. | 0.02 | 1.52 | 0.5918 | 0.5918 | |||||
| FULT / Fulton Financial Corporation | 0.08 | 121.53 | 1.52 | 129.00 | 0.5914 | 0.3190 | |||
| GPN / Global Payments Inc. | 0.02 | 0.00 | 1.49 | 3.85 | 0.5791 | -0.0089 | |||
| CPB / The Campbell's Company | 0.05 | 0.00 | 1.47 | 3.09 | 0.5624 | -0.0233 | |||
| CPRI / Capri Holdings Limited | 0.07 | 1.47 | 0.5724 | 0.5724 | |||||
| MKSI / MKS Inc. | 0.01 | 65.91 | 1.45 | 106.70 | 0.5653 | 0.2770 | |||
| SCL / Stepan Company | 0.03 | -19.30 | 1.40 | -29.46 | 0.5375 | -0.2802 | |||
| ALG / Alamo Group Inc. | 0.01 | -60.86 | 1.39 | -65.80 | 0.5419 | -1.1272 | |||
| STBA / S&T Bancorp, Inc. | 0.04 | -16.36 | 1.38 | -16.88 | 0.5284 | -0.1536 | |||
| WERN / Werner Enterprises, Inc. | 0.05 | -52.52 | 1.33 | -54.34 | 0.5169 | -0.6759 | |||
| TTWO / Take-Two Interactive Software, Inc. | 0.01 | -38.73 | 1.32 | -34.80 | 0.5144 | -0.3174 | |||
| MTX / Minerals Technologies Inc. | 0.02 | -7.58 | 1.26 | 4.32 | 0.4808 | -0.0140 | |||
| DHIL / Diamond Hill Investment Group, Inc. | 0.01 | 15.21 | 1.25 | 11.03 | 0.4780 | 0.0160 | |||
| AVTR / Avantor, Inc. | 0.09 | 1.15 | 0.4494 | 0.4494 | |||||
| WGO / Winnebago Industries, Inc. | 0.03 | -39.56 | 1.14 | -30.32 | 0.4377 | -0.2362 | |||
| ATKR / Atkore Inc. | 0.02 | -25.27 | 1.14 | -33.55 | 0.4356 | -0.2676 | |||
| KMT / Kennametal Inc. | 0.05 | -41.36 | 1.12 | -46.56 | 0.4365 | -0.4241 | |||
| COLM / Columbia Sportswear Company | 0.02 | -39.14 | 1.02 | -47.93 | 0.3969 | -0.4058 | |||
| SFNC / Simmons First National Corporation | 0.05 | 173.44 | 1.01 | 176.78 | 0.3884 | 0.2376 | |||
| CSL / Carlisle Companies Incorporated | 0.00 | 0.99 | 0.3852 | 0.3852 | |||||
| HLIT / Harmonic Inc. | 0.09 | -49.01 | 0.89 | -45.21 | 0.3462 | -0.3195 | |||
| AMP / Ameriprise Financial, Inc. | 0.00 | -51.11 | 0.89 | -55.01 | 0.3452 | -0.4633 | |||
| CNMD / CONMED Corporation | 0.02 | -23.26 | 0.81 | -30.71 | 0.3160 | -0.1646 | |||
| CAC / Camden National Corporation | 0.02 | -50.26 | 0.73 | -52.74 | 0.2811 | -0.3566 | |||
| EIG / Employers Holdings, Inc. | 0.02 | -23.32 | 0.71 | -30.96 | 0.2759 | -0.1453 | |||
| HTLD / Heartland Express, Inc. | 0.08 | -65.47 | 0.66 | -66.55 | 0.2527 | -0.5571 | |||
| CUZ / Cousins Properties Incorporated | 0.02 | 0.00 | 0.65 | -3.73 | 0.2474 | -0.0280 | |||
| SLGN / Silgan Holdings Inc. | 0.01 | -54.72 | 0.47 | -64.07 | 0.1787 | -0.3547 | |||
| SAFT / Safety Insurance Group, Inc. | 0.01 | -51.68 | 0.45 | -56.95 | 0.1763 | -0.2556 | |||
| LEG / Leggett & Platt, Incorporated | 0.05 | -54.52 | 0.42 | -54.76 | 0.1622 | -0.2222 | |||
| FC / Franklin Covey Co. | 0.00 | -100.00 | 0.00 | 0.0000 | |||||
| HUN / Huntsman Corporation | 0.00 | -100.00 | 0.00 | 0.0000 | |||||
| SKX / Skechers U.S.A., Inc. | 0.00 | -100.00 | 0.00 | -100.00 | -0.5302 | ||||
| AZO / AutoZone, Inc. | 0.00 | -100.00 | 0.00 | 0.0000 | |||||
| CRI / Carter's, Inc. | 0.00 | -100.00 | 0.00 | 0.0000 | |||||
| CMCO / Columbus McKinnon Corporation | 0.00 | -100.00 | 0.00 | -100.00 | -0.4629 | ||||
| SPB / Spectrum Brands Holdings, Inc. | 0.00 | -100.00 | 0.00 | 0.0000 | |||||
| OEC / Orion S.A. | 0.00 | -100.00 | 0.00 | 0.0000 | |||||
| CAG / Conagra Brands, Inc. | 0.00 | -100.00 | 0.00 | 0.0000 | |||||
| HCKT / The Hackett Group, Inc. | 0.00 | -100.00 | 0.00 | -100.00 | -0.6914 | ||||
| MOH / Molina Healthcare, Inc. | 0.00 | -100.00 | 0.00 | -100.00 | -0.6887 | ||||
| TGNA / TEGNA Inc. | 0.00 | -100.00 | 0.00 | 0.0000 |