Estatísticas Básicas
| Valor do Portfólio | $ 107,797 |
| Posições Atuais | 81 |
Últimas Participações, Desempenho, AUM (de 13F, 13D)
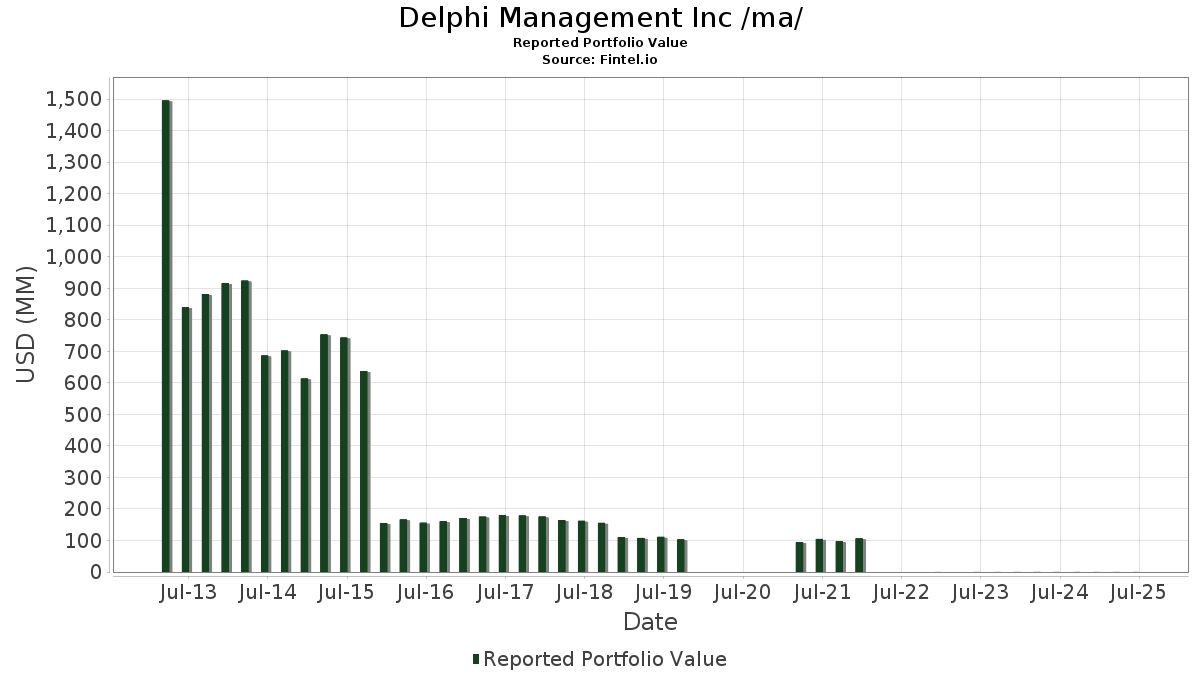
Delphi Management Inc /ma/ divulgou 81 participações totais em seus últimos arquivamentos da SEC. O valor mais recente da carteira é calculado como $ 107,797 USD. O Ativo Total Sob Gestão (AUM) é esse valor mais o caixa (que não é divulgado). As principais posições de Delphi Management Inc /ma/ são Berkshire Hathaway Inc. (US:BRK.B) , Apple Inc. (US:AAPL) , Foothills Exploration, Inc. (US:FTXP) , TD SYNNEX Corporation (US:SNX) , and Lam Research Corporation (US:LRCX) . As novas posições de Delphi Management Inc /ma/ incluem Bar Harbor Bankshares (US:BHB) , Titan America SA (US:TTAM) , Mach Natural Resources LP (US:MNR) , .
Maiores Aumentos Este Trimestre
Usamos a mudança na alocação do portfólio porque esta é a métrica mais significativa. As mudanças podem ser devido a operações ou mudanças nos preços das ações.
| Ativo | Ações (MM) |
Valor (MM$) |
% do Portfólio | Δ% do Portfólio |
|---|---|---|---|---|
| 0.04 | 0.00 | 1.2264 | 1.2264 | |
| 0.01 | 0.00 | 1.1819 | 1.1819 | |
| 0.01 | 0.00 | 1.4889 | 0.4831 | |
| 0.01 | 0.00 | 1.9871 | 0.3010 | |
| 0.02 | 0.00 | 0.2922 | 0.2922 | |
| 0.02 | 0.00 | 1.3238 | 0.2484 | |
| 0.00 | 0.00 | 1.5102 | 0.2368 | |
| 0.01 | 0.00 | 0.2161 | 0.2161 | |
| 0.01 | 0.00 | 1.1169 | 0.2106 | |
| 0.01 | 0.00 | 1.4277 | 0.1929 |
Maiores Diminuições Este Trimestre
Usamos a mudança na alocação do portfólio porque esta é a métrica mais significativa. As mudanças podem ser devido a operações ou mudanças nos preços das ações.
| Ativo | Ações (MM) |
Valor (MM$) |
% do Portfólio | Δ% do Portfólio |
|---|---|---|---|---|
| 0.00 | 0.00 | 0.0000 | -0.9111 | |
| 0.00 | 0.00 | 0.0000 | -0.5208 | |
| 0.02 | 0.00 | 0.8683 | -0.4419 | |
| 0.03 | 0.00 | 1.1642 | -0.4213 | |
| 0.02 | 0.00 | 1.1559 | -0.4190 | |
| 0.01 | 0.00 | 1.4221 | -0.2823 | |
| 0.01 | 0.00 | 2.4119 | -0.2239 | |
| 0.01 | 0.00 | 1.3182 | -0.2200 | |
| 0.05 | 0.00 | 1.1011 | -0.1965 | |
| 0.01 | 0.00 | 1.3201 | -0.1824 |
Arquivamentos 13F e Fundo
Este formulário foi arquivado em 2025-10-15 para o período de relatório 2025-09-30. Clique no ícone de link para ver o histórico completo da transação.
Atualize para desbloquear dados premium e exportar para Excel ![]() .
.
| Ativo | Tipo | Preço Médio por Ação | Ações (MM) |
ΔAções (%) |
Valor ($MM) |
ΔAções (%) |
Portfólio (%) |
ΔPortfólio (%) |
|
|---|---|---|---|---|---|---|---|---|---|
| BRK.B / Berkshire Hathaway Inc. | 0.01 | -7.92 | 0.00 | 0.00 | 2.4119 | -0.2239 | |||
| AAPL / Apple Inc. | 0.01 | -1.12 | 0.00 | 100.00 | 1.9871 | 0.3010 | |||
| FTXP / Foothills Exploration, Inc. | 0.00 | -8.31 | 0.00 | 0.00 | 1.6216 | 0.0911 | |||
| SNX / TD SYNNEX Corporation | 0.01 | -3.02 | 0.00 | 0.00 | 1.5928 | 0.1754 | |||
| LRCX / Lam Research Corporation | 0.01 | -24.90 | 0.00 | 0.00 | 1.5538 | -0.0133 | |||
| AMAT / Applied Materials, Inc. | 0.01 | -1.62 | 0.00 | 0.00 | 1.5427 | 0.0828 | |||
| GHC / Graham Holdings Company | 0.00 | -0.72 | 0.00 | 0.00 | 1.5102 | 0.2368 | |||
| GS / The Goldman Sachs Group, Inc. | 0.00 | -10.21 | 0.00 | 0.00 | 1.5075 | -0.0462 | |||
| NFG / National Fuel Gas Company | 0.02 | -0.85 | 0.00 | 0.00 | 1.4908 | 0.0550 | |||
| ABBV / AbbVie Inc. | 0.01 | 23.60 | 0.00 | 0.00 | 1.4889 | 0.4831 | |||
| LDOS / Leidos Holdings, Inc. | 0.01 | -9.69 | 0.00 | 0.00 | 1.4759 | 0.0556 | |||
| TPR / Tapestry, Inc. | 0.01 | -20.07 | 0.00 | 0.00 | 1.4722 | -0.0158 | |||
| MS / Morgan Stanley | 0.01 | -12.01 | 0.00 | 0.00 | 1.4685 | -0.0726 | |||
| JPM / JPMorgan Chase & Co. | 0.01 | -7.69 | 0.00 | 0.00 | 1.4657 | -0.0541 | |||
| FLEX / Flex Ltd. | 0.03 | -18.24 | 0.00 | 0.00 | 1.4639 | -0.1420 | |||
| RL / Ralph Lauren Corporation | 0.00 | -1.39 | 0.00 | 0.00 | 1.4453 | 0.1100 | |||
| AZZ / AZZ Inc. | 0.01 | -6.06 | 0.00 | 0.00 | 1.4397 | 0.0571 | |||
| NVS / Novartis AG - Depositary Receipt (Common Stock) | 0.01 | -0.68 | 0.00 | 0.00 | 1.4351 | 0.0148 | |||
| TXT / Textron Inc. | 0.02 | 4.33 | 0.00 | 0.00 | 1.4323 | 0.0729 | |||
| AXP / American Express Company | 0.00 | -0.90 | 0.00 | 0.00 | 1.4305 | -0.0131 | |||
| EXPE / Expedia Group, Inc. | 0.01 | -4.97 | 0.00 | 0.00 | 1.4277 | 0.1929 | |||
| JHG / Janus Henderson Group plc | 0.03 | -3.47 | 0.00 | 0.00 | 1.4277 | 0.0827 | |||
| SSNC / SS&C Technologies Holdings, Inc. | 0.02 | -0.32 | 0.00 | 0.00 | 1.4221 | 0.0356 | |||
| JBL / Jabil Inc. | 0.01 | -12.74 | 0.00 | 0.00 | 1.4221 | -0.2823 | |||
| WRB / W. R. Berkley Corporation | 0.02 | 0.18 | 0.00 | 0.00 | 1.4184 | 0.0048 | |||
| DELL / Dell Technologies Inc. | 0.01 | -8.03 | 0.00 | 0.00 | 1.4156 | 0.0291 | |||
| LH / Labcorp Holdings Inc. | 0.01 | -2.94 | 0.00 | 0.00 | 1.4147 | 0.0263 | |||
| DHI / D.R. Horton, Inc. | 0.01 | -9.39 | 0.00 | 0.00 | 1.4101 | 0.1762 | |||
| SANM / Sanmina Corporation | 0.01 | -17.72 | 0.00 | 0.00 | 1.4008 | -0.1065 | |||
| ASX / ASE Technology Holding Co., Ltd. - Depositary Receipt (Common Stock) | 0.13 | -0.30 | 0.00 | 0.00 | 1.3535 | 0.0365 | |||
| SDZNY / Sandoz Group AG - Depositary Receipt (Common Stock) | 0.02 | -0.23 | 0.00 | 0.00 | 1.3488 | 0.0580 | |||
| SF / Stifel Financial Corp. | 0.01 | -3.31 | 0.00 | 0.00 | 1.3488 | 0.0193 | |||
| DOX / Amdocs Limited | 0.02 | 15.64 | 0.00 | 0.00 | 1.3414 | -0.0016 | |||
| USB / U.S. Bancorp | 0.03 | -0.78 | 0.00 | 0.00 | 1.3414 | 0.0235 | |||
| FAF / First American Financial Corporation | 0.02 | 22.58 | 0.00 | 0.00 | 1.3238 | 0.2484 | |||
| DIS / The Walt Disney Company | 0.01 | -0.87 | 0.00 | 0.00 | 1.3201 | -0.1824 | |||
| ORCL / Oracle Corporation | 0.01 | -30.58 | 0.00 | 0.00 | 1.3182 | -0.2200 | |||
| UNTY / Unity Bancorp, Inc. | 0.03 | -5.10 | 0.00 | 0.00 | 1.3136 | -0.0749 | |||
| HTGC / Hercules Capital, Inc. | 0.07 | -2.30 | 0.00 | 0.00 | 1.3099 | -0.0409 | |||
| KBR / KBR, Inc. | 0.03 | 23.79 | 0.00 | 0.00 | 1.3089 | 0.1920 | |||
| TOL / Toll Brothers, Inc. | 0.01 | -0.93 | 0.00 | 0.00 | 1.3062 | 0.1709 | |||
| THG / The Hanover Insurance Group, Inc. | 0.01 | 0.01 | 0.00 | 0.00 | 1.2978 | 0.0340 | |||
| FI / Fiserv, Inc. | 0.01 | 30.64 | 0.00 | 0.00 | 1.2969 | -0.0858 | |||
| FR / First Industrial Realty Trust, Inc. | 0.03 | 6.92 | 0.00 | 0.00 | 1.2941 | 0.1153 | |||
| CAC / Camden National Corporation | 0.04 | 13.36 | 0.00 | 0.00 | 1.2904 | 0.0440 | |||
| PUBGY / Publicis Groupe S.A. - Depositary Receipt (Common Stock) | 0.06 | 16.62 | 0.00 | 0.00 | 1.2904 | -0.0140 | |||
| HIG / The Hartford Insurance Group, Inc. | 0.01 | 0.88 | 0.00 | 0.00 | 1.2820 | 0.0231 | |||
| STAG / STAG Industrial, Inc. | 0.04 | -0.10 | 0.00 | 0.00 | 1.2765 | -0.0917 | |||
| REVG / REV Group, Inc. | 0.02 | -11.94 | 0.00 | 0.00 | 1.2468 | 0.0081 | |||
| RNR / RenaissanceRe Holdings Ltd. | 0.01 | 2.11 | 0.00 | 0.00 | 1.2449 | 0.0304 | |||
| LEN / Lennar Corporation | 0.01 | -0.53 | 0.00 | 0.00 | 1.2403 | 0.1011 | |||
| BHB / Bar Harbor Bankshares | 0.04 | 0.00 | 1.2264 | 1.2264 | |||||
| NXST / Nexstar Media Group, Inc. | 0.01 | 0.11 | 0.00 | 0.00 | 1.2227 | 0.1106 | |||
| NICE / NICE Ltd. - Depositary Receipt (Common Stock) | 0.01 | 22.68 | 0.00 | 0.00 | 1.2171 | 0.0113 | |||
| ARCC / Ares Capital Corporation | 0.06 | 2.00 | 0.00 | 0.00 | 1.2106 | -0.1199 | |||
| ITRN / Ituran Location and Control Ltd. | 0.04 | 0.65 | 0.00 | 0.00 | 1.2032 | -0.1466 | |||
| SNA / Snap-on Incorporated | 0.00 | 0.27 | 0.00 | 0.00 | 1.1995 | 0.0806 | |||
| CB / Chubb Limited | 0.00 | 0.15 | 0.00 | 0.00 | 1.1985 | -0.0807 | |||
| NSIT / Insight Enterprises, Inc. | 0.01 | 0.00 | 1.1819 | 1.1819 | |||||
| BATRK / Atlanta Braves Holdings, Inc. | 0.03 | -13.99 | 0.00 | 0.00 | 1.1642 | -0.4213 | |||
| INGR / Ingredion Incorporated | 0.01 | 0.14 | 0.00 | 0.00 | 1.1587 | -0.1795 | |||
| CAKE / The Cheesecake Factory Incorporated | 0.02 | -12.33 | 0.00 | 0.00 | 1.1559 | -0.4190 | |||
| EXP / Eagle Materials Inc. | 0.01 | 0.19 | 0.00 | 0.00 | 1.1540 | 0.1144 | |||
| EG / Everest Group, Ltd. | 0.00 | 0.23 | 0.00 | 0.00 | 1.1262 | -0.0091 | |||
| OMC / Omnicom Group Inc. | 0.01 | 13.29 | 0.00 | 1.1169 | 0.2106 | ||||
| ARW / Arrow Electronics, Inc. | 0.01 | -1.24 | 0.00 | 0.00 | 1.1104 | -0.1234 | |||
| CBT / Cabot Corporation | 0.02 | 0.19 | 0.00 | 0.00 | 1.1086 | -0.0277 | |||
| BXSL / Blackstone Secured Lending Fund | 0.05 | 4.18 | 0.00 | 0.00 | 1.1011 | -0.1965 | |||
| AZO / AutoZone, Inc. | 0.00 | -15.91 | 0.00 | 0.00 | 1.0306 | -0.0737 | |||
| FANG / Diamondback Energy, Inc. | 0.01 | 0.18 | 0.00 | 0.00 | 1.0232 | 0.0019 | |||
| EOG / EOG Resources, Inc. | 0.01 | -0.06 | 0.00 | 0.00 | 1.0204 | -0.1149 | |||
| MTDR / Matador Resources Company | 0.02 | -0.54 | 0.00 | 0.00 | 0.9277 | -0.1042 | |||
| PRGS / Progress Software Corporation | 0.02 | 0.28 | 0.00 | -100.00 | 0.8683 | -0.4419 | |||
| INCY / Incyte Corporation | 0.01 | -0.65 | 0.00 | 0.5418 | 0.0857 | ||||
| ANF / Abercrombie & Fitch Co. | 0.01 | 0.15 | 0.00 | 0.5130 | -0.0039 | ||||
| GBDC / Golub Capital BDC, Inc. | 0.03 | 0.87 | 0.00 | 0.3831 | -0.0401 | ||||
| TTAM / Titan America SA | 0.02 | 0.00 | 0.2922 | 0.2922 | |||||
| URBN / Urban Outfitters, Inc. | 0.00 | -0.48 | 0.00 | 0.2764 | -0.0173 | ||||
| SMP / Standard Motor Products, Inc. | 0.01 | 0.00 | 0.2161 | 0.2161 | |||||
| STLD / Steel Dynamics, Inc. | 0.00 | 4.01 | 0.00 | 0.2115 | 0.0173 | ||||
| MNR / Mach Natural Resources LP | 0.01 | 0.00 | 0.1494 | 0.1494 | |||||
| BHRB / Burke & Herbert Financial Services Corp. | 0.00 | -100.00 | 0.00 | 0.0000 | |||||
| SLB / SLB N.V. | 0.00 | -100.00 | 0.00 | 0.0000 | -0.9111 | ||||
| IAS / Integral Ad Science Holding Corp. | 0.00 | -100.00 | 0.00 | 0.0000 | -0.5208 | ||||
| ASIX / AdvanSix Inc. | 0.00 | -100.00 | 0.00 | 0.0000 |