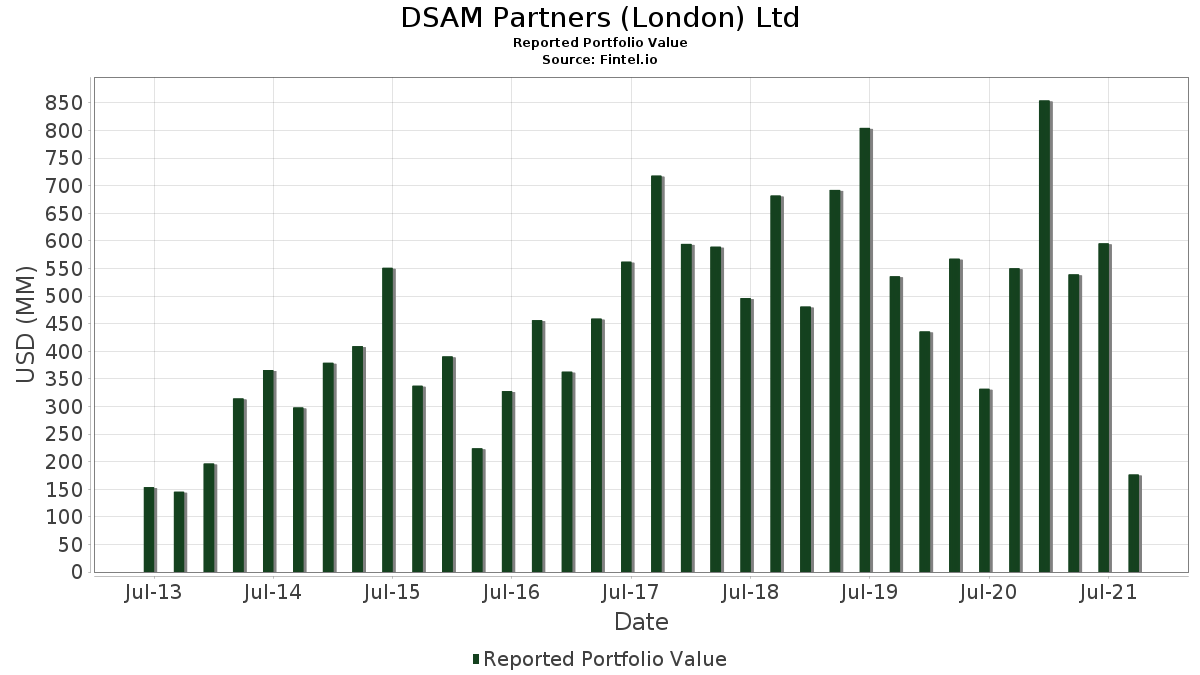
Estatísticas Básicas
| Valor do Portfólio | $ 176,484,000 |
| Posições Atuais | 18 |
Últimas Participações, Desempenho, AUM (de 13F, 13D)
DSAM Partners (London) Ltd divulgou 18 participações totais em seus últimos arquivamentos da SEC. O valor mais recente da carteira é calculado como $ 176,484,000 USD. O Ativo Total Sob Gestão (AUM) é esse valor mais o caixa (que não é divulgado). As principais posições de DSAM Partners (London) Ltd são GFL Environmental Inc. (US:GFL) , Microsoft Corporation (US:MSFT) , Alphabet Inc. (US:GOOGL) , Antero Resources Corporation (US:AR) , and Lucid Group, Inc. (US:LCID) . As novas posições de DSAM Partners (London) Ltd incluem GXO Logistics, Inc. (US:GXO) , Xos, Inc. (US:XOS) , Doma Holdings Inc. (US:DOMA) , .
Maiores Aumentos Este Trimestre
Usamos a mudança na alocação do portfólio porque esta é a métrica mais significativa. As mudanças podem ser devido a operações ou mudanças nos preços das ações.
| Ativo | Ações (MM) |
Valor (MM$) |
% do Portfólio | Δ% do Portfólio |
|---|---|---|---|---|
| 0.70 | 26.00 | 14.7350 | 8.0230 | |
| 0.15 | 11.61 | 6.5779 | 6.5779 | |
| 0.55 | 13.99 | 7.9254 | 6.3265 | |
| 0.01 | 17.67 | 10.0128 | 4.0712 | |
| 0.06 | 18.18 | 10.3035 | 3.8827 | |
| 0.91 | 17.09 | 9.6808 | 3.3599 | |
| 1.20 | 5.57 | 3.1561 | 3.1561 | |
| 0.20 | 10.40 | 5.8952 | 3.1532 | |
| 0.65 | 12.41 | 7.0346 | 2.8059 | |
| 0.68 | 5.85 | 3.3130 | 2.2419 |
Maiores Diminuições Este Trimestre
Usamos a mudança na alocação do portfólio porque esta é a métrica mais significativa. As mudanças podem ser devido a operações ou mudanças nos preços das ações.
| Ativo | Ações (MM) |
Valor (MM$) |
% do Portfólio | Δ% do Portfólio |
|---|---|---|---|---|
| 0.00 | 0.00 | -6.3239 | ||
| 0.00 | 0.00 | -5.0147 | ||
| 0.00 | 0.00 | -3.7960 | ||
| 0.00 | 0.00 | -3.7493 | ||
| 0.00 | 0.00 | -3.5811 | ||
| 0.00 | 0.00 | -2.6629 | ||
| 0.00 | 0.00 | -2.4845 | ||
| 0.00 | 0.00 | -2.1483 | ||
| 0.22 | 6.59 | 3.7357 | -2.0018 | |
| 0.00 | 0.00 | -1.6842 |
Arquivamentos 13F e Fundo
Este formulário foi arquivado em 2021-11-15 para o período de relatório 2021-09-30. Clique no ícone de link para ver o histórico completo da transação.
Atualize para desbloquear dados premium e exportar para Excel ![]() .
.
| Ativo | Tipo | Preço Médio por Ação | Ações (MM) |
ΔAções (%) |
Valor ($MM) |
ΔAções (%) |
Portfólio (%) |
ΔPortfólio (%) |
|
|---|---|---|---|---|---|---|---|---|---|
| GFL / GFL Environmental Inc. | 0.70 | -44.09 | 26.00 | -34.93 | 14.7350 | 8.0230 | |||
| MSFT / Microsoft Corporation | 0.06 | -54.29 | 18.18 | -52.44 | 10.3035 | 3.8827 | |||
| GOOGL / Alphabet Inc. | 0.01 | -53.03 | 17.67 | -50.05 | 10.0128 | 4.0712 | |||
| AR / Antero Resources Corporation | 0.91 | -63.73 | 17.09 | -54.60 | 9.6808 | 3.3599 | |||
| LCID / Lucid Group, Inc. | 0.55 | 66.84 | 13.99 | 46.92 | 7.9254 | 6.3265 | |||
| ACI09N1H7 / Fiat Chrysler Automobiles N.V | 0.65 | -49.12 | 12.41 | -50.69 | 7.0346 | 2.8059 | |||
| GXO / GXO Logistics, Inc. | 0.15 | 11.61 | 6.5779 | 6.5779 | |||||
| CARR / Carrier Global Corporation | 0.20 | -40.17 | 10.40 | -36.27 | 5.8952 | 3.1532 | |||
| STEM / Stem, Inc. | 0.37 | -57.95 | 8.85 | -72.10 | 5.0152 | -0.3131 | |||
| VNT / Vontier Corporation | 0.24 | -77.16 | 8.12 | -76.45 | 4.5999 | -1.1894 | |||
| OXY / Occidental Petroleum Corporation | 0.22 | -79.60 | 6.59 | -80.70 | 3.7357 | -2.0018 | |||
| XPO / XPO, Inc. | 0.08 | -45.72 | 6.52 | -69.12 | 3.6933 | 0.1481 | |||
| VLTA / Volta Inc - Class A | 0.68 | 6.29 | 5.85 | -8.33 | 3.3130 | 2.2419 | |||
| XOS / Xos, Inc. | 1.20 | 5.57 | 3.1561 | 3.1561 | |||||
| MKFG / Markforged Holding Corporation | 0.43 | -56.57 | 2.83 | -71.45 | 1.6041 | -0.0613 | |||
| HYZN / Hyzon Motors Inc. | 0.36 | -49.28 | 2.50 | -65.87 | 1.4154 | 0.1862 | |||
| ALLO / Allogene Therapeutics, Inc. | 0.05 | -62.50 | 1.39 | -63.05 | 0.7865 | 0.1556 | |||
| DOMA / Doma Holdings Inc. | 0.12 | 0.91 | 0.5156 | 0.5156 | |||||
| ARYD / ARYA Sciences Acquisition Corp IV | 0.00 | -100.00 | 0.00 | -100.00 | -0.0359 | ||||
| EXP / Eagle Materials Inc. | 0.00 | -100.00 | 0.00 | -100.00 | -0.2294 | ||||
| AFIB / Acutus Medical, Inc. | 0.00 | -100.00 | 0.00 | -100.00 | -0.2049 | ||||
| CVE / Cenovus Energy Inc. | 0.00 | -100.00 | 0.00 | -100.00 | -0.2751 | ||||
| CLDX / Celldex Therapeutics, Inc. | 0.00 | -100.00 | 0.00 | -100.00 | -0.7633 | ||||
| MU / Micron Technology, Inc. | 0.00 | -100.00 | 0.00 | -100.00 | -3.7960 | ||||
| KRYS / Krystal Biotech, Inc. | 0.00 | -100.00 | 0.00 | -100.00 | -0.8026 | ||||
| EXPE / Expedia Group, Inc. | 0.00 | -100.00 | 0.00 | -100.00 | -6.3239 | ||||
| MELI / MercadoLibre, Inc. | 0.00 | -100.00 | 0.00 | -100.00 | -0.6540 | ||||
| BBIO / BridgeBio Pharma, Inc. | 0.00 | -100.00 | 0.00 | -100.00 | -0.8230 | ||||
| AON / Aon plc | 0.00 | -100.00 | 0.00 | -100.00 | -1.6842 | ||||
| VMC / Vulcan Materials Company | 0.00 | -100.00 | 0.00 | -100.00 | -0.3697 | ||||
| PTON / Peloton Interactive, Inc. | 0.00 | -100.00 | 0.00 | -100.00 | -3.7493 | ||||
| INTU / Intuit Inc. | 0.00 | -100.00 | 0.00 | -100.00 | -3.5811 | ||||
| MLM / Martin Marietta Materials, Inc. | 0.00 | -100.00 | 0.00 | -100.00 | -0.4761 | ||||
| AMZN / Amazon.com, Inc. | 0.00 | -100.00 | 0.00 | -100.00 | -2.4845 | ||||
| EPAM / EPAM Systems, Inc. | 0.00 | -100.00 | 0.00 | -100.00 | -0.5578 | ||||
| IMTX / Immatics N.V. | 0.00 | -100.00 | 0.00 | -100.00 | -0.2983 | ||||
| DMYI.U / dMY Technology Group, Inc. III Units, each consisting of one share of Class A common stock and one-f | 0.00 | -100.00 | 0.00 | -100.00 | -0.7662 | ||||
| SUM / Summit Materials, Inc. | 0.00 | -100.00 | 0.00 | -100.00 | -0.2560 | ||||
| YNDX / Yandex N.V. | 0.00 | -100.00 | 0.00 | -100.00 | -0.6535 | ||||
| NCR / NCR Corp. | 0.00 | -100.00 | 0.00 | -100.00 | -5.0147 | ||||
| NEXI / NexImmune, Inc. | 0.00 | -100.00 | 0.00 | -100.00 | -0.2454 | ||||
| CSTM / Constellium SE | 0.00 | -100.00 | 0.00 | -100.00 | -2.1483 | ||||
| IOVA / Iovance Biotherapeutics, Inc. | 0.00 | -100.00 | 0.00 | -100.00 | -0.3567 | ||||
| RCKT / Rocket Pharmaceuticals, Inc. | 0.00 | -100.00 | 0.00 | -100.00 | -1.0435 | ||||
| OVV / Ovintiv Inc. | 0.00 | -100.00 | 0.00 | -100.00 | -0.2738 | ||||
| AEVA / Aeva Technologies, Inc. | 0.00 | -100.00 | 0.00 | -100.00 | -2.6629 | ||||
| OPCH / Option Care Health, Inc. | 0.00 | -100.00 | 0.00 | -100.00 | -0.2739 | ||||
| APLT / Applied Therapeutics, Inc. | 0.00 | -100.00 | 0.00 | -100.00 | -0.2343 |