Estatísticas Básicas
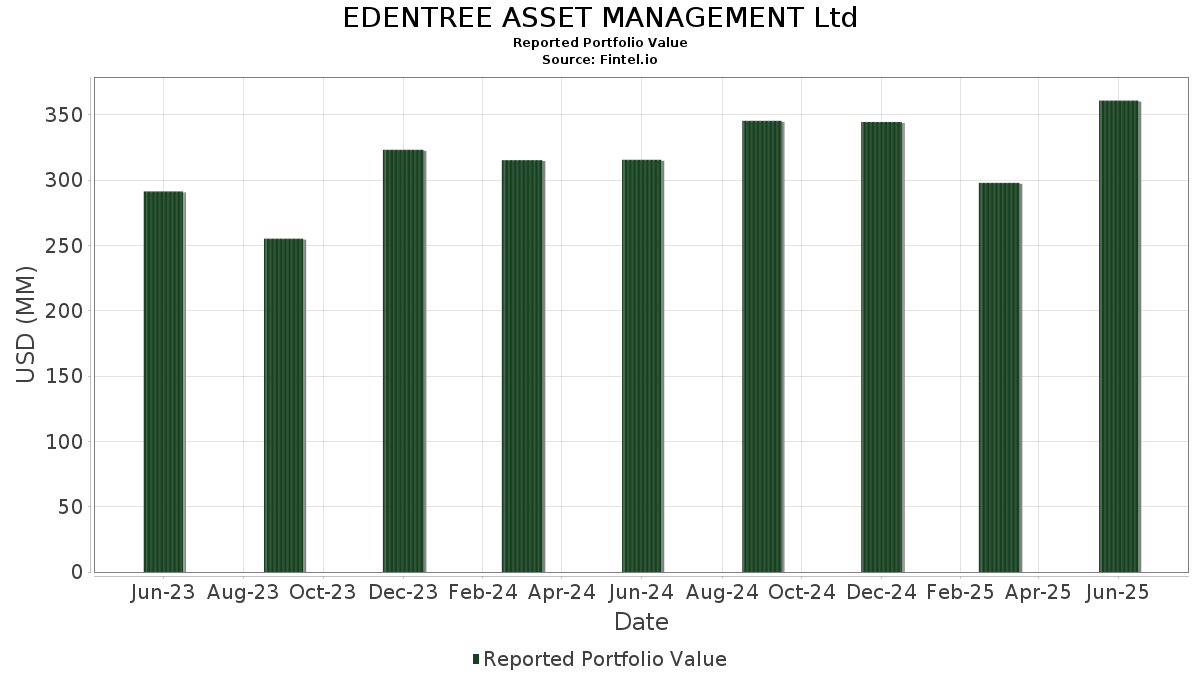
| Valor do Portfólio | $ 415,259,348 |
| Posições Atuais | 62 |
Últimas Participações, Desempenho, AUM (de 13F, 13D)
EDENTREE ASSET MANAGEMENT Ltd divulgou 62 participações totais em seus últimos arquivamentos da SEC. O valor mais recente da carteira é calculado como $ 415,259,348 USD. O Ativo Total Sob Gestão (AUM) é esse valor mais o caixa (que não é divulgado). As principais posições de EDENTREE ASSET MANAGEMENT Ltd são Microsoft Corporation (US:MSFT) , Alphabet Inc. (US:GOOGL) , Medtronic plc (US:MDT) , Xylem Inc. (US:XYL) , and NIKE, Inc. (US:NKE) . As novas posições de EDENTREE ASSET MANAGEMENT Ltd incluem IQVIA Holdings Inc. (US:IQV) , Carrier Global Corporation (US:CARR) , .
Maiores Aumentos Este Trimestre
Usamos a mudança na alocação do portfólio porque esta é a métrica mais significativa. As mudanças podem ser devido a operações ou mudanças nos preços das ações.
| Ativo | Ações (MM) |
Valor (MM$) |
% do Portfólio | Δ% do Portfólio |
|---|---|---|---|---|
| 0.04 | 7.37 | 1.7743 | 1.7743 | |
| 0.12 | 7.28 | 1.7539 | 1.7539 | |
| 0.22 | 6.67 | 1.6071 | 1.3714 | |
| 0.18 | 43.46 | 10.4655 | 1.0544 | |
| 0.18 | 14.95 | 3.6011 | 0.9517 | |
| 0.13 | 18.73 | 4.5107 | 0.5325 | |
| 0.25 | 23.49 | 5.6572 | 0.5269 | |
| 0.06 | 13.28 | 3.1971 | 0.4754 | |
| 0.07 | 14.39 | 3.4657 | 0.4013 | |
| 0.32 | 10.54 | 2.5372 | 0.2773 |
Maiores Diminuições Este Trimestre
Usamos a mudança na alocação do portfólio porque esta é a métrica mais significativa. As mudanças podem ser devido a operações ou mudanças nos preços das ações.
| Ativo | Ações (MM) |
Valor (MM$) |
% do Portfólio | Δ% do Portfólio |
|---|---|---|---|---|
| 0.00 | 0.00 | -2.2381 | ||
| 0.01 | 1.04 | 0.2496 | -1.9747 | |
| 0.07 | 4.10 | 0.9884 | -0.6106 | |
| 0.02 | 4.21 | 1.0139 | -0.5513 | |
| 0.03 | 7.06 | 1.7001 | -0.5218 | |
| 0.05 | 5.51 | 1.3258 | -0.4442 | |
| 0.07 | 6.63 | 1.5960 | -0.4247 | |
| 0.07 | 11.62 | 2.7993 | -0.3234 | |
| 0.08 | 10.04 | 2.4177 | -0.2297 | |
| 0.06 | 14.03 | 3.3794 | -0.2246 |
Arquivamentos 13F e Fundo
Este formulário foi arquivado em 2025-11-10 para o período de relatório 2025-09-30. Clique no ícone de link para ver o histórico completo da transação.
Atualize para desbloquear dados premium e exportar para Excel ![]() .
.
| Ativo | Tipo | Preço Médio por Ação | Ações (MM) |
ΔAções (%) |
Valor ($MM) |
ΔAções (%) |
Portfólio (%) |
ΔPortfólio (%) |
|
|---|---|---|---|---|---|---|---|---|---|
| MSFT / Microsoft Corporation | 0.09 | 11.46 | 45.09 | 16.13 | 10.8576 | 0.0980 | |||
| GOOGL / Alphabet Inc. | 0.18 | -7.24 | 43.46 | 27.97 | 10.4655 | 1.0544 | |||
| MDT / Medtronic plc | 0.25 | 16.19 | 23.49 | 26.90 | 5.6572 | 0.5269 | |||
| XYL / Xylem Inc. | 0.13 | 14.42 | 18.73 | 30.48 | 4.5107 | 0.5325 | |||
| NKE / NIKE, Inc. | 0.22 | 26.38 | 15.03 | 24.09 | 3.6191 | 0.2628 | |||
| MRK / Merck & Co., Inc. | 0.18 | 47.45 | 14.95 | 56.42 | 3.6011 | 0.9517 | |||
| PANW / Palo Alto Networks, Inc. | 0.07 | 30.78 | 14.39 | 30.15 | 3.4657 | 0.4013 | |||
| WCN / Waste Connections, Inc. | 0.08 | 31.91 | 14.36 | 24.21 | 3.4570 | 0.2543 | |||
| ADI / Analog Devices, Inc. | 0.06 | 4.57 | 14.03 | 7.90 | 3.3794 | -0.2246 | |||
| PFG / Principal Financial Group, Inc. | 0.17 | 13.46 | 13.97 | 18.39 | 3.3646 | 0.0941 | |||
| CRM / Salesforce, Inc. | 0.06 | 55.51 | 13.28 | 35.18 | 3.1971 | 0.4754 | |||
| BRKR / Bruker Corporation | 0.38 | 45.52 | 12.33 | 14.75 | 2.9704 | -0.0084 | |||
| MSA / MSA Safety Incorporated | 0.07 | 0.41 | 11.62 | 3.16 | 2.7993 | -0.3234 | |||
| WMS / Advanced Drainage Systems, Inc. | 0.08 | -3.33 | 11.43 | 16.72 | 2.7518 | 0.0385 | |||
| AVNT / Avient Corporation | 0.32 | 26.61 | 10.54 | 29.20 | 2.5372 | 0.2773 | |||
| HIG / The Hartford Insurance Group, Inc. | 0.08 | 0.00 | 10.04 | 5.09 | 2.4177 | -0.2297 | |||
| VMI / Valmont Industries, Inc. | 0.03 | 1.47 | 9.90 | 20.62 | 2.3847 | 0.1096 | |||
| SPOT / Spotify Technology S.A. | 0.01 | 44.12 | 8.55 | 31.13 | 2.0581 | 0.2521 | |||
| IQV / IQVIA Holdings Inc. | 0.04 | 7.37 | 1.7743 | 1.7743 | |||||
| CARR / Carrier Global Corporation | 0.12 | 7.28 | 1.7539 | 1.7539 | |||||
| CME / CME Group Inc. | 0.03 | -10.19 | 7.06 | -11.95 | 1.7001 | -0.5218 | |||
| HASI / HA Sustainable Infrastructure Capital, Inc. | 0.22 | 586.56 | 6.67 | 685.06 | 1.6071 | 1.3714 | |||
| BSX / Boston Scientific Corporation | 0.07 | 0.00 | 6.63 | -9.11 | 1.5960 | -0.4247 | |||
| BLDR / Builders FirstSource, Inc. | 0.05 | -17.08 | 5.51 | -13.81 | 1.3258 | -0.4442 | |||
| GOOG / Alphabet Inc. | 0.02 | 0.00 | 4.48 | 37.31 | 1.0787 | 0.1746 | |||
| TSM / Taiwan Semiconductor Manufacturing Company Limited - Depositary Receipt (Common Stock) | 0.02 | 0.00 | 4.31 | 23.37 | 1.0387 | 0.0697 | |||
| ACN / Accenture plc | 0.02 | -9.73 | 4.21 | -25.46 | 1.0139 | -0.5513 | |||
| V / Visa Inc. | 0.01 | 0.00 | 4.13 | -3.85 | 0.9937 | -0.1955 | |||
| ATKR / Atkore Inc. | 0.07 | -19.99 | 4.10 | -28.87 | 0.9884 | -0.6106 | |||
| AAPL / Apple Inc. | 0.01 | -8.60 | 2.82 | 13.44 | 0.6790 | -0.0097 | |||
| CLH / Clean Harbors, Inc. | 0.01 | 0.00 | 2.56 | 0.51 | 0.6154 | -0.0892 | |||
| AMAT / Applied Materials, Inc. | 0.01 | 6.97 | 2.36 | 19.64 | 0.5678 | 0.0217 | |||
| ICE / Intercontinental Exchange, Inc. | 0.01 | 0.00 | 2.27 | -8.16 | 0.5477 | -0.1386 | |||
| FSS / Federal Signal Corporation | 0.02 | -12.21 | 2.27 | -1.86 | 0.5458 | -0.0942 | |||
| CDNS / Cadence Design Systems, Inc. | 0.01 | 0.00 | 2.19 | 14.07 | 0.5272 | -0.0047 | |||
| LIN / Linde plc | 0.00 | 11.61 | 2.03 | 13.08 | 0.4891 | -0.0089 | |||
| FERG / Ferguson Enterprises Inc. | 0.01 | 0.00 | 1.93 | 3.05 | 0.4643 | -0.0542 | |||
| MWA / Mueller Water Products, Inc. | 0.07 | 0.00 | 1.87 | 6.21 | 0.4493 | -0.0376 | |||
| STN / Stantec Inc. | 0.02 | -12.94 | 1.85 | -14.00 | 0.4453 | -0.1506 | |||
| CSCO / Cisco Systems, Inc. | 0.03 | 0.00 | 1.77 | -1.34 | 0.4262 | -0.0709 | |||
| PNR / Pentair plc | 0.02 | 0.00 | 1.71 | 7.88 | 0.4122 | -0.0274 | |||
| AYI / Acuity Inc. | 0.00 | 0.00 | 1.69 | 15.44 | 0.4070 | 0.0013 | |||
| TMUS / T-Mobile US, Inc. | 0.01 | 0.00 | 1.59 | 0.44 | 0.3818 | -0.0556 | |||
| JXN / Jackson Financial Inc. | 0.01 | 0.00 | 1.52 | 13.96 | 0.3657 | -0.0035 | |||
| ADSK / Autodesk, Inc. | 0.00 | 0.00 | 1.49 | 2.61 | 0.3596 | -0.0436 | |||
| GJR / Strats Trust For Procter & Gambel Security - Preferred Security | 0.01 | 0.00 | 1.33 | -3.56 | 0.3202 | -0.0619 | |||
| PFE / Pfizer Inc. | 0.05 | 0.00 | 1.27 | 5.12 | 0.3067 | -0.0291 | |||
| EMR / Emerson Electric Co. | 0.01 | 0.00 | 1.27 | -1.63 | 0.3053 | -0.0517 | |||
| RRX / Regal Rexnord Corporation | 0.01 | 4.74 | 1.14 | 3.55 | 0.2745 | -0.0305 | |||
| BMY / Bristol-Myers Squibb Company | 0.03 | 0.00 | 1.13 | -2.59 | 0.2714 | -0.0493 | |||
| RYN / Rayonier Inc. | 0.04 | 20.31 | 1.11 | 44.21 | 0.2671 | 0.0538 | |||
| SW / Smurfit Westrock Plc | 0.03 | 0.00 | 1.06 | -1.30 | 0.2563 | -0.0425 | |||
| LSCC / Lattice Semiconductor Corporation | 0.01 | -91.37 | 1.04 | -87.09 | 0.2496 | -1.9747 | |||
| AOS / A. O. Smith Corporation | 0.01 | 7.22 | 1.04 | 20.07 | 0.2493 | 0.0104 | |||
| NXPI / NXP Semiconductors N.V. | 0.00 | 7.14 | 1.02 | 11.67 | 0.2468 | -0.0073 | |||
| IEX / IDEX Corporation | 0.01 | 16.81 | 0.96 | 8.24 | 0.2312 | -0.0146 | |||
| NVDD / Direxion Shares ETF Trust - Direxion Daily NVDA Bear 1X Shares | 0.00 | 1,355.88 | 0.92 | 1,641.51 | 0.2224 | 0.2075 | |||
| AVGO / Broadcom Inc. | 0.00 | 0.00 | 0.92 | 19.71 | 0.2223 | 0.0084 | |||
| ABBV / AbbVie Inc. | 0.00 | 0.00 | 0.65 | 24.86 | 0.1561 | 0.0121 | |||
| NOW / ServiceNow, Inc. | 0.00 | 0.00 | 0.55 | -10.55 | 0.1329 | -0.0379 | |||
| PAYX / Paychex, Inc. | 0.00 | 0.00 | 0.51 | -12.74 | 0.1221 | -0.0392 | |||
| AUTL / Autolus Therapeutics plc - Depositary Receipt (Common Stock) | 0.30 | 0.00 | 0.49 | -28.95 | 0.1170 | -0.0725 | |||
| ADBE / Adobe Inc. | 0.00 | -100.00 | 0.00 | -100.00 | -2.2381 | ||||
| BLD / TopBuild Corp. | 0.00 | -100.00 | 0.00 | 0.0000 |