Estatísticas Básicas
| Perfil do Insider | Electron Capital Partners, LLC |
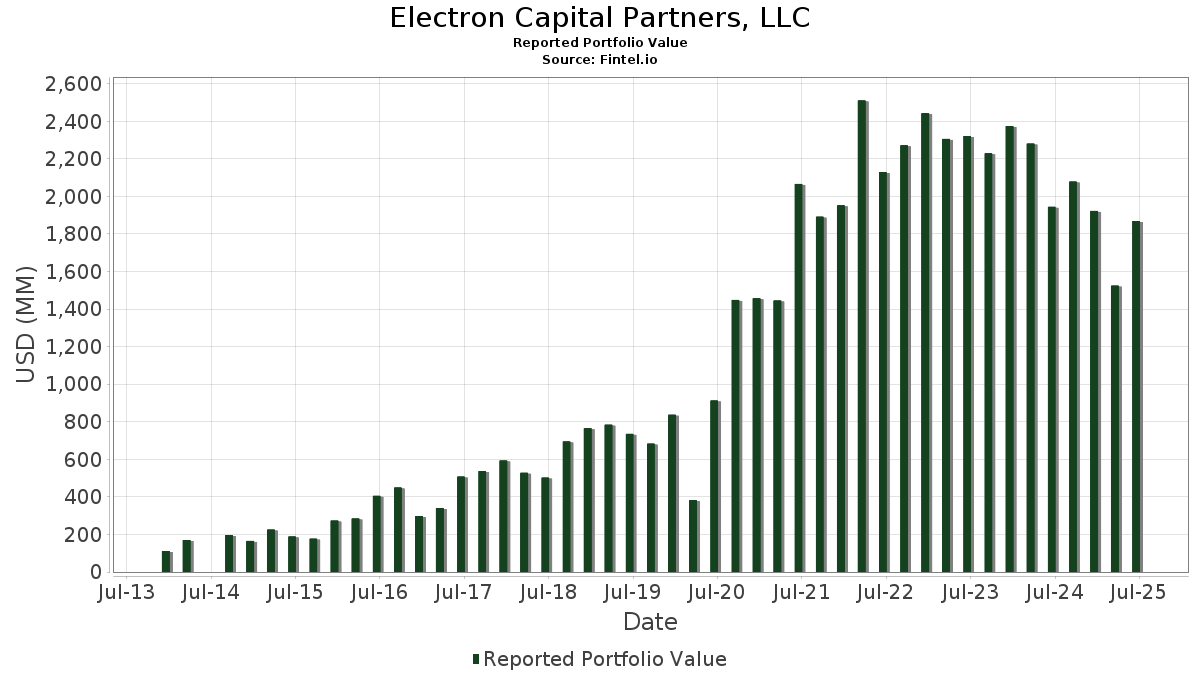
| Valor do Portfólio | $ 2,207,683,787 |
| Posições Atuais | 37 |
Últimas Participações, Desempenho, AUM (de 13F, 13D)
Electron Capital Partners, LLC divulgou 37 participações totais em seus últimos arquivamentos da SEC. O valor mais recente da carteira é calculado como $ 2,207,683,787 USD. O Ativo Total Sob Gestão (AUM) é esse valor mais o caixa (que não é divulgado). As principais posições de Electron Capital Partners, LLC são Constellation Energy Corporation (US:CEG) , MasTec, Inc. (US:MTZ) , NextEra Energy, Inc. (US:NEE) , Entergy Corporation (US:ETR) , and Xcel Energy Inc. (US:XEL) . As novas posições de Electron Capital Partners, LLC incluem BorgWarner Inc. (US:BWA) , WeRide Inc. - Depositary Receipt (Common Stock) (US:WRD) , .
Maiores Aumentos Este Trimestre
Usamos a mudança na alocação do portfólio porque esta é a métrica mais significativa. As mudanças podem ser devido a operações ou mudanças nos preços das ações.
| Ativo | Ações (MM) |
Valor (MM$) |
% do Portfólio | Δ% do Portfólio |
|---|---|---|---|---|
| 1.54 | 143.49 | 6.4994 | 4.3225 | |
| 0.59 | 56.84 | 2.5745 | 2.5745 | |
| 1.73 | 64.10 | 2.9037 | 1.9936 | |
| 0.57 | 41.91 | 1.8983 | 1.8205 | |
| 6.59 | 75.11 | 3.4024 | 1.4904 | |
| 0.72 | 31.82 | 1.4413 | 1.4413 | |
| 0.82 | 174.31 | 7.8956 | 1.0807 | |
| 1.28 | 18.05 | 0.8176 | 0.8176 | |
| 1.97 | 148.50 | 6.7267 | 0.6989 | |
| 1.39 | 62.78 | 2.8438 | 0.5736 |
Maiores Diminuições Este Trimestre
Usamos a mudança na alocação do portfólio porque esta é a métrica mais significativa. As mudanças podem ser devido a operações ou mudanças nos preços das ações.
| Ativo | Ações (MM) |
Valor (MM$) |
% do Portfólio | Δ% do Portfólio |
|---|---|---|---|---|
| 0.14 | 38.00 | 1.7211 | -5.3672 | |
| 1.07 | 117.66 | 5.3295 | -2.3181 | |
| 0.58 | 191.94 | 8.6942 | -1.8818 | |
| 0.80 | 123.72 | 5.6043 | -1.5305 | |
| 0.14 | 41.81 | 1.8939 | -1.3449 | |
| 0.56 | 23.76 | 1.0763 | -0.4787 | |
| 0.34 | 74.36 | 3.3682 | -0.4753 | |
| 0.32 | 2.35 | 0.1066 | -0.3429 | |
| 1.64 | 73.67 | 3.3372 | -0.3046 | |
| 8.04 | 80.14 | 3.6302 | -0.2793 |
Arquivamentos 13F e Fundo
Este formulário foi arquivado em 2025-11-14 para o período de relatório 2025-09-30. Clique no ícone de link para ver o histórico completo da transação.
Atualize para desbloquear dados premium e exportar para Excel ![]() .
.
| Ativo | Tipo | Preço Médio por Ação | Ações (MM) |
ΔAções (%) |
Valor ($MM) |
ΔAções (%) |
Portfólio (%) |
ΔPortfólio (%) |
|
|---|---|---|---|---|---|---|---|---|---|
| CEG / Constellation Energy Corporation | 0.58 | -4.76 | 191.94 | -2.89 | 8.6942 | -1.8818 | |||
| MTZ / MasTec, Inc. | 0.82 | 9.60 | 174.31 | 36.86 | 7.8956 | 1.0807 | |||
| NEE / NextEra Energy, Inc. | 1.97 | 21.22 | 148.50 | 31.82 | 6.7267 | 0.6989 | |||
| ETR / Entergy Corporation | 1.54 | 214.56 | 143.49 | 252.67 | 6.4994 | 4.3225 | |||
| XEL / Xcel Energy Inc. | 1.68 | -2.73 | 135.56 | 15.19 | 6.1403 | -0.1564 | |||
| MMM / 3M Company | 0.80 | -8.97 | 123.72 | -7.22 | 5.6043 | -1.5305 | |||
| GEV / GE Vernova Inc. | 0.19 | 1.72 | 119.63 | 18.20 | 5.4187 | 0.0034 | |||
| JCI / Johnson Controls International plc | 1.07 | -20.92 | 117.66 | -17.68 | 5.3295 | -2.3181 | |||
| PWR / Quanta Services, Inc. | 0.24 | 3.18 | 98.93 | 13.10 | 4.4813 | -0.1990 | |||
| PPL / PPL Corporation | 2.24 | 4.38 | 83.08 | 14.46 | 3.7631 | -0.1206 | |||
| ENVX / Enovix Corporation | 8.04 | 13.76 | 80.14 | 9.69 | 3.6302 | -0.2793 | |||
| EOSE / Eos Energy Enterprises, Inc. | 6.59 | -5.51 | 75.11 | 110.20 | 3.4024 | 1.4904 | |||
| BA / The Boeing Company | 0.34 | 0.50 | 74.36 | 3.52 | 3.3682 | -0.4753 | |||
| EXC / Exelon Corporation | 1.64 | 4.42 | 73.67 | 8.24 | 3.3372 | -0.3046 | |||
| SEDG / SolarEdge Technologies, Inc. | 1.73 | 107.80 | 64.10 | 276.90 | 2.9037 | 1.9936 | |||
| CGNX / Cognex Corporation | 1.39 | 3.61 | 62.78 | 47.98 | 2.8438 | 0.5736 | |||
| UAL / United Airlines Holdings, Inc. | 0.59 | 56.84 | 2.5745 | 2.5745 | |||||
| ULS / UL Solutions Inc. | 0.79 | 25.76 | 55.72 | 22.30 | 2.5239 | 0.0862 | |||
| NXT / Nextpower Inc. | 0.57 | 2,017.68 | 41.91 | 2,782.32 | 1.8983 | 1.8205 | |||
| ZBRA / Zebra Technologies Corporation | 0.14 | -28.32 | 41.81 | -30.93 | 1.8939 | -1.3449 | |||
| APD / Air Products and Chemicals, Inc. | 0.14 | -70.34 | 38.00 | -71.32 | 1.7211 | -5.3672 | |||
| EIX / Edison International | 0.67 | 3.84 | 37.00 | 11.24 | 1.6759 | -0.1037 | |||
| BWA / BorgWarner Inc. | 0.72 | 31.82 | 1.4413 | 1.4413 | |||||
| ARRY / Array Technologies, Inc. | 3.78 | 0.78 | 30.83 | 39.22 | 1.3966 | 0.2116 | |||
| PCG / PG&E Corporation | 1.99 | 3.77 | 30.01 | 12.25 | 1.3595 | -0.0711 | |||
| CE / Celanese Corporation | 0.56 | 7.51 | 23.76 | -18.24 | 1.0763 | -0.4787 | |||
| MBLY / Mobileye Global Inc. | 1.28 | 18.05 | 0.8176 | 0.8176 | |||||
| PLUG / Plug Power Inc. | 4.58 | 10.66 | 0.4830 | 0.4830 | |||||
| SGML / Sigma Lithium Corporation | 1.11 | 4.20 | 7.13 | 48.45 | 0.3231 | 0.0660 | |||
| VRT / Vertiv Holdings Co | 0.03 | -0.23 | 4.26 | 17.22 | 0.1931 | -0.0015 | |||
| OPAL / OPAL Fuels Inc. | 1.80 | 0.00 | 3.96 | -9.09 | 0.1794 | -0.0537 | |||
| GDS / GDS Holdings Limited - Depositary Receipt (Common Stock) | 0.07 | -0.23 | 2.68 | 26.34 | 0.1214 | 0.0079 | |||
| SHLS / Shoals Technologies Group, Inc. | 0.32 | -83.93 | 2.35 | -71.98 | 0.1066 | -0.3429 | |||
| HSAI / Hesai Group - Depositary Receipt (Common Stock) | 0.06 | -0.23 | 1.79 | 27.73 | 0.0810 | 0.0061 | |||
| WRD / WeRide Inc. - Depositary Receipt (Common Stock) | 0.14 | 1.39 | 0.0629 | 0.0629 | |||||
| EH / EHang Holdings Limited - Depositary Receipt (Common Stock) | 0.04 | -0.23 | 0.67 | 6.74 | 0.0301 | -0.0032 | |||
| SES.WS / SES AI Corporation - Equity Warrant | 0.24 | 0.00 | 0.04 | 64.00 | 0.0019 | 0.0005 | |||
| HTZ / Hertz Global Holdings, Inc. | 0.00 | -100.00 | 0.00 | 0.0000 | |||||
| NRG / NRG Energy, Inc. | 0.00 | -100.00 | 0.00 | 0.0000 | |||||
| CANG / Cango Inc. | 0.00 | -100.00 | 0.00 | 0.0000 | |||||
| HRI / Herc Holdings Inc. | 0.00 | -100.00 | 0.00 | 0.0000 |