Estatísticas Básicas
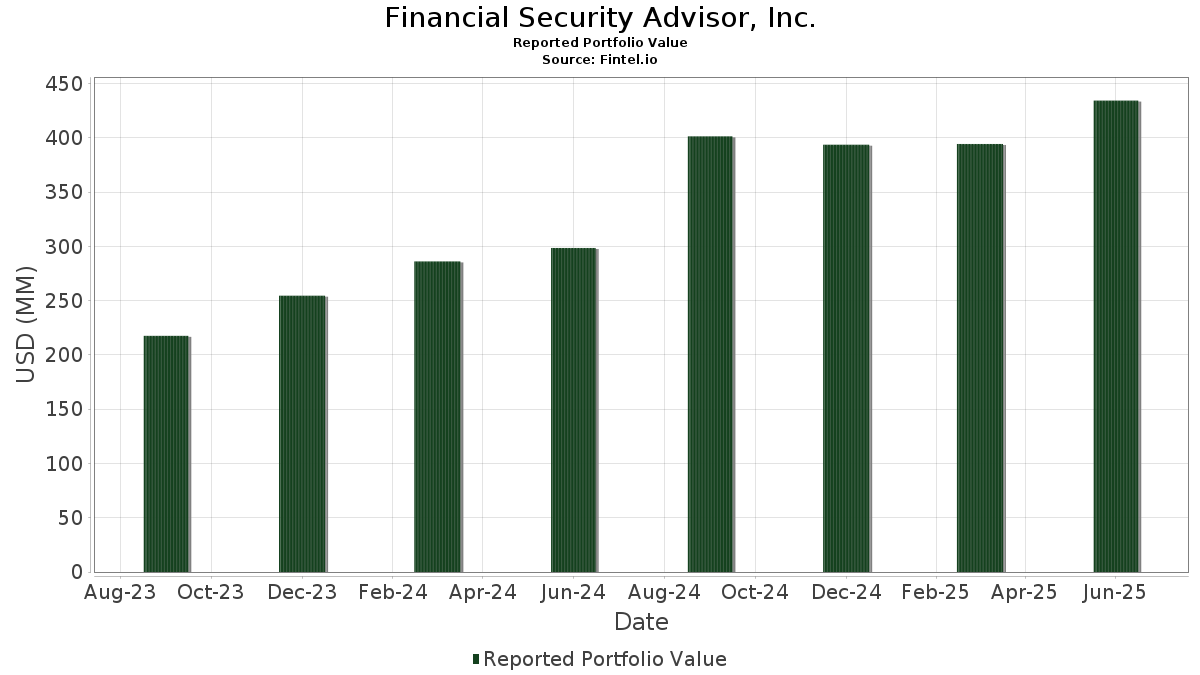
| Valor do Portfólio | $ 470,284,287 |
| Posições Atuais | 144 |
Últimas Participações, Desempenho, AUM (de 13F, 13D)
Financial Security Advisor, Inc. divulgou 144 participações totais em seus últimos arquivamentos da SEC. O valor mais recente da carteira é calculado como $ 470,284,287 USD. O Ativo Total Sob Gestão (AUM) é esse valor mais o caixa (que não é divulgado). As principais posições de Financial Security Advisor, Inc. são Capital Group Growth ETF (US:CGGR) , Invesco Exchange-Traded Fund Trust - Invesco S&P 500 Pure Growth ETF (US:RPG) , Berkshire Hathaway Inc. (US:BRK.B) , WisdomTree Trust - WisdomTree Floating Rate Treasury Fund (US:USFR) , and Microsoft Corporation (US:MSFT) . As novas posições de Financial Security Advisor, Inc. incluem Spinnaker ETF Series - Select STOXX Europe Aerospace & Defense ETF (US:EUAD) , SLB N.V. (US:SLB) , General Electric Company (US:GE) , Uber Technologies, Inc. (US:UBER) , and GE Vernova Inc. (US:GEV) .
Maiores Aumentos Este Trimestre
Usamos a mudança na alocação do portfólio porque esta é a métrica mais significativa. As mudanças podem ser devido a operações ou mudanças nos preços das ações.
| Ativo | Ações (MM) |
Valor (MM$) |
% do Portfólio | Δ% do Portfólio |
|---|---|---|---|---|
| 0.05 | 11.27 | 2.3962 | 0.5824 | |
| 0.05 | 13.52 | 2.8753 | 0.3378 | |
| 0.04 | 8.31 | 1.7675 | 0.2432 | |
| 0.07 | 3.71 | 0.7892 | 0.2121 | |
| 0.04 | 8.23 | 1.7490 | 0.1862 | |
| 2.14 | 93.95 | 19.9770 | 0.1690 | |
| 0.02 | 0.93 | 0.1971 | 0.1387 | |
| 0.11 | 1.41 | 0.3006 | 0.1226 | |
| 0.01 | 0.43 | 0.0914 | 0.0914 | |
| 0.00 | 1.75 | 0.3718 | 0.0910 |
Maiores Diminuições Este Trimestre
Usamos a mudança na alocação do portfólio porque esta é a métrica mais significativa. As mudanças podem ser devido a operações ou mudanças nos preços das ações.
| Ativo | Ações (MM) |
Valor (MM$) |
% do Portfólio | Δ% do Portfólio |
|---|---|---|---|---|
| 0.32 | 16.17 | 3.4383 | -0.3840 | |
| 0.70 | 33.18 | 7.0560 | -0.3688 | |
| 0.24 | 11.99 | 2.5492 | -0.3146 | |
| 0.04 | 21.24 | 4.5155 | -0.2805 | |
| 0.03 | 15.79 | 3.3567 | -0.1543 | |
| 0.31 | 14.43 | 3.0692 | -0.1276 | |
| 0.07 | 4.91 | 1.0437 | -0.1127 | |
| 0.02 | 2.99 | 0.6365 | -0.0887 | |
| 0.02 | 3.78 | 0.8034 | -0.0713 | |
| 0.00 | 3.07 | 0.6518 | -0.0648 |
Arquivamentos 13F e Fundo
Este formulário foi arquivado em 2025-11-03 para o período de relatório 2025-09-30. Clique no ícone de link para ver o histórico completo da transação.
Atualize para desbloquear dados premium e exportar para Excel ![]() .
.
| Ativo | Tipo | Preço Médio por Ação | Ações (MM) |
ΔAções (%) |
Valor ($MM) |
ΔAções (%) |
Portfólio (%) |
ΔPortfólio (%) |
|
|---|---|---|---|---|---|---|---|---|---|
| CGGR / Capital Group Growth ETF | 2.14 | 1.09 | 93.95 | 9.22 | 19.9770 | 0.1690 | |||
| NEOS Enhanced Income Credit Select ETF / Exchange Traded Fund (78433H659) | 1.44 | 72.83 | 0.0000 | ||||||
| RPG / Invesco Exchange-Traded Fund Trust - Invesco S&P 500 Pure Growth ETF | 0.70 | -1.29 | 33.18 | 2.92 | 7.0560 | -0.3688 | |||
| BRK.B / Berkshire Hathaway Inc. | 0.04 | -1.48 | 21.24 | 1.96 | 4.5155 | -0.2805 | |||
| USFR / WisdomTree Trust - WisdomTree Floating Rate Treasury Fund | 0.32 | -2.51 | 16.17 | -2.58 | 3.4383 | -0.3840 | |||
| MSFT / Microsoft Corporation | 0.03 | -0.57 | 15.79 | 3.54 | 3.3567 | -0.1543 | |||
| SPSM / SPDR Series Trust - State Street SPDR Portfolio S&P 600TM Small Cap ETF | 0.31 | -4.38 | 14.43 | 3.97 | 3.0692 | -0.1276 | |||
| AAPL / Apple Inc. | 0.05 | -1.12 | 13.52 | 22.72 | 2.8753 | 0.3378 | |||
| JPST / J.P. Morgan Exchange-Traded Fund Trust - JPMorgan Ultra-Short Income ETF | 0.24 | -3.70 | 11.99 | -3.60 | 2.5492 | -0.3146 | |||
| GOOGL / Alphabet Inc. | 0.05 | 3.71 | 11.27 | 43.07 | 2.3962 | 0.5824 | |||
| COWZ / Pacer Funds Trust - Pacer US Cash Cows 100 ETF | 0.19 | 2.50 | 10.87 | 6.90 | 2.3124 | -0.0299 | |||
| NVDD / Direxion Shares ETF Trust - Direxion Daily NVDA Bear 1X Shares | 0.04 | 6.33 | 8.31 | 25.58 | 1.7675 | 0.2432 | |||
| JNJ / Johnson & Johnson | 0.04 | -0.16 | 8.23 | 21.21 | 1.7490 | 0.1862 | |||
| MO / Altria Group, Inc. | 0.10 | -0.32 | 6.64 | 12.15 | 1.4111 | 0.0485 | |||
| TCAF / T. Rowe Price Exchange-Traded Funds, Inc. - T. Rowe Price Capital Appreciation Equity ETF | 0.17 | -0.27 | 6.49 | 6.56 | 1.3811 | -0.0223 | |||
| SLYG / SPDR Series Trust - State Street SPDR S&P 600 TM Small Cap Growth ETF | 0.06 | -2.02 | 5.75 | 4.11 | 1.2230 | -0.0491 | |||
| SPLG / SPDR Series Trust - SPDR Portfolio S&P 500 ETF | 0.06 | 0.13 | 5.08 | 7.90 | 1.0802 | -0.0038 | |||
| WMT / Walmart Inc. | 0.05 | -2.26 | 5.05 | 3.02 | 1.0746 | -0.0550 | |||
| CSCO / Cisco Systems, Inc. | 0.07 | -0.89 | 4.91 | -2.25 | 1.0437 | -0.1127 | |||
| XOM / Exxon Mobil Corporation | 0.04 | 0.17 | 4.61 | 4.77 | 0.9798 | -0.0329 | |||
| AMZN / Amazon.com, Inc. | 0.02 | 4.56 | 4.46 | 4.64 | 0.9487 | -0.0330 | |||
| MCD / McDonald's Corporation | 0.01 | -0.39 | 4.30 | 3.62 | 0.9139 | -0.0414 | |||
| PM / Philip Morris International Inc. | 0.02 | 12.51 | 3.78 | -0.53 | 0.8034 | -0.0713 | |||
| BTC / Grayscale Bitcoin Mini Trust | 0.07 | 39.66 | 3.71 | 48.08 | 0.7892 | 0.2121 | |||
| HCA / HCA Healthcare, Inc. | 0.01 | -1.28 | 3.22 | 9.82 | 0.6853 | 0.0096 | |||
| LLY / Eli Lilly and Company | 0.00 | 0.63 | 3.07 | -1.48 | 0.6518 | -0.0648 | |||
| AXP / American Express Company | 0.01 | -4.36 | 3.00 | -0.40 | 0.6384 | -0.0558 | |||
| GJR / Strats Trust For Procter & Gambel Security - Preferred Security | 0.02 | -1.44 | 2.99 | -4.95 | 0.6365 | -0.0887 | |||
| PH / Parker-Hannifin Corporation | 0.00 | -0.19 | 2.35 | 8.33 | 0.5007 | 0.0002 | |||
| GSCE / GS Connect S&P GSCI Enhanced Commodity Total Return ETN | 0.00 | -1.02 | 2.25 | 11.41 | 0.4776 | 0.0132 | |||
| ORCL / Oracle Corporation | 0.01 | -1.87 | 2.22 | 26.25 | 0.4726 | 0.0671 | |||
| D / Dominion Energy, Inc. | 0.04 | -2.97 | 2.17 | 4.98 | 0.4620 | -0.0144 | |||
| AVGO / Broadcom Inc. | 0.01 | 0.87 | 1.91 | 20.75 | 0.4060 | 0.0418 | |||
| TSLA / Tesla, Inc. | 0.00 | 2.42 | 1.75 | 43.40 | 0.3718 | 0.0910 | |||
| GOOGL / Alphabet Inc. | 0.01 | 2.69 | 1.73 | 41.06 | 0.3675 | 0.0852 | |||
| KO / The Coca-Cola Company | 0.02 | 0.82 | 1.58 | -5.46 | 0.3353 | -0.0487 | |||
| META / Meta Platforms, Inc. | 0.00 | 3.71 | 1.54 | 3.22 | 0.3278 | -0.0162 | |||
| SPY / SPDR S&P 500 ETF | 0.00 | -9.13 | 1.42 | -2.00 | 0.3015 | -0.0318 | |||
| UEC / Uranium Energy Corp. | 0.11 | -6.79 | 1.41 | 82.79 | 0.3006 | 0.1226 | |||
| VZ / Verizon Communications Inc. | 0.03 | -2.25 | 1.37 | -0.73 | 0.2912 | -0.0264 | |||
| TOWN / TowneBank | 0.04 | 0.17 | 1.29 | 1.34 | 0.2738 | -0.0189 | |||
| TXN / Texas Instruments Incorporated | 0.01 | 0.00 | 1.24 | -11.49 | 0.2637 | -0.0590 | |||
| SO / The Southern Company | 0.01 | 0.18 | 1.23 | 3.45 | 0.2612 | -0.0124 | |||
| CB / Chubb Limited | 0.00 | -0.15 | 1.14 | -2.73 | 0.2423 | -0.0274 | |||
| FCNCA / First Citizens BancShares, Inc. | 0.00 | 0.00 | 1.10 | -8.43 | 0.2333 | -0.0427 | |||
| NSC / Norfolk Southern Corporation | 0.00 | -5.42 | 1.08 | 11.00 | 0.2297 | 0.0056 | |||
| TFC / Truist Financial Corporation | 0.02 | 0.03 | 1.05 | 6.38 | 0.2235 | -0.0040 | |||
| LMT / Lockheed Martin Corporation | 0.00 | 0.24 | 1.02 | 8.04 | 0.2172 | -0.0005 | |||
| MGNR / American Beacon Select Funds - American Beacon GLG Natural Resources ETF | 0.02 | 200.21 | 0.93 | 266.01 | 0.1971 | 0.1387 | |||
| MAIN / Main Street Capital Corporation | 0.01 | 2.79 | 0.88 | 10.62 | 0.1861 | 0.0039 | |||
| DHR / Danaher Corporation | 0.00 | -2.89 | 0.85 | -2.52 | 0.1813 | -0.0202 | |||
| JPM / JPMorgan Chase & Co. | 0.00 | 0.64 | 0.85 | 9.42 | 0.1804 | 0.0020 | |||
| MKL / Markel Group Inc. | 0.00 | -1.34 | 0.84 | -5.59 | 0.1796 | -0.0264 | |||
| TMO / Thermo Fisher Scientific Inc. | 0.00 | 81.97 | 0.82 | 117.72 | 0.1750 | 0.0879 | |||
| MRK / Merck & Co., Inc. | 0.01 | 43.90 | 0.81 | 52.72 | 0.1731 | 0.0501 | |||
| BABA / Alibaba Group Holding Limited - Depositary Receipt (Common Stock) | 0.00 | 2.59 | 0.80 | 58.93 | 0.1703 | 0.0542 | |||
| HD / The Home Depot, Inc. | 0.00 | -1.21 | 0.79 | 9.10 | 0.1683 | 0.0013 | |||
| UNH / UnitedHealth Group Incorporated | 0.00 | -17.15 | 0.78 | -8.36 | 0.1656 | -0.0300 | |||
| DE / Deere & Company | 0.00 | 0.12 | 0.76 | -9.96 | 0.1615 | -0.0328 | |||
| COST / Costco Wholesale Corporation | 0.00 | 0.62 | 0.76 | -5.96 | 0.1610 | -0.0243 | |||
| ABBV / AbbVie Inc. | 0.00 | 0.82 | 0.74 | 25.81 | 0.1577 | 0.0219 | |||
| ELV / Elevance Health, Inc. | 0.00 | 1.98 | 0.73 | -15.26 | 0.1560 | -0.0434 | |||
| ACN / Accenture plc | 0.00 | -5.34 | 0.71 | -21.91 | 0.1516 | -0.0586 | |||
| TSM / Taiwan Semiconductor Manufacturing Company Limited - Depositary Receipt (Common Stock) | 0.00 | 6.99 | 0.71 | 31.91 | 0.1513 | 0.0270 | |||
| VTI / Vanguard Index Funds - Vanguard Total Stock Market ETF | 0.00 | 0.29 | 0.67 | 8.21 | 0.1430 | -0.0000 | |||
| TMSL / T. Rowe Price Exchange-Traded Funds, Inc. - T. Rowe Price Small-Mid Cap ETF | 0.02 | 0.04 | 0.63 | 7.28 | 0.1349 | -0.0013 | |||
| COF / Capital One Financial Corporation | 0.00 | 0.20 | 0.63 | 0.16 | 0.1335 | -0.0109 | |||
| IBM / International Business Machines Corporation | 0.00 | -8.40 | 0.62 | -12.36 | 0.1328 | -0.0312 | |||
| VUG / Vanguard Index Funds - Vanguard Growth ETF | 0.00 | -0.31 | 0.62 | 8.93 | 0.1324 | 0.0009 | |||
| DUK / Duke Energy Corporation | 0.00 | 0.29 | 0.61 | 5.03 | 0.1289 | -0.0038 | |||
| DIS / The Walt Disney Company | 0.01 | 26.03 | 0.59 | 16.44 | 0.1251 | 0.0087 | |||
| CGGO / Capital Group Global Growth Equity ETF | 0.02 | 1.88 | 0.58 | 7.95 | 0.1243 | -0.0005 | |||
| V / Visa Inc. | 0.00 | 3.28 | 0.58 | -0.68 | 0.1234 | -0.0112 | |||
| RY / Royal Bank of Canada | 0.00 | 0.00 | 0.57 | 12.08 | 0.1204 | 0.0040 | |||
| PLTR / Palantir Technologies Inc. | 0.00 | -5.81 | 0.52 | 26.02 | 0.1112 | 0.0157 | |||
| ANET / Arista Networks, Inc. | 0.00 | 4.09 | 0.50 | 48.67 | 0.1072 | 0.0289 | |||
| IVOG / Vanguard Admiral Funds - Vanguard S&P Mid-Cap 400 Growth ETF | 0.00 | 0.00 | 0.50 | 5.71 | 0.1064 | -0.0026 | |||
| IVV / iShares Trust - iShares Core S&P 500 ETF | 0.00 | 0.13 | 0.50 | 8.03 | 0.1061 | -0.0003 | |||
| BTCO / Invesco Galaxy Bitcoin ETF | 0.00 | 0.51 | 0.50 | 6.67 | 0.1055 | -0.0017 | |||
| ABT / Abbott Laboratories | 0.00 | 0.48 | 0.48 | -1.04 | 0.1014 | -0.0096 | |||
| BAC / Bank of America Corporation | 0.01 | -3.90 | 0.46 | 4.74 | 0.0988 | -0.0033 | |||
| RTX / RTX Corporation | 0.00 | 6.02 | 0.44 | 21.45 | 0.0928 | 0.0101 | |||
| CVX / Chevron Corporation | 0.00 | 12.08 | 0.43 | 21.63 | 0.0922 | 0.0100 | |||
| NFLX / Netflix, Inc. | 0.00 | 3.15 | 0.43 | -7.71 | 0.0918 | -0.0158 | |||
| EUAD / Spinnaker ETF Series - Select STOXX Europe Aerospace & Defense ETF | 0.01 | 0.43 | 0.0914 | 0.0914 | |||||
| MS / Morgan Stanley | 0.00 | 1.80 | 0.41 | 15.04 | 0.0878 | 0.0050 | |||
| SLB / SLB N.V. | 0.01 | 0.41 | 0.0864 | 0.0864 | |||||
| UTG / Reaves Utility Income Fund | 0.01 | 0.00 | 0.40 | 9.70 | 0.0842 | 0.0009 | |||
| AMGN / Amgen Inc. | 0.00 | 0.36 | 0.39 | 1.56 | 0.0832 | -0.0056 | |||
| PEP / PepsiCo, Inc. | 0.00 | -0.11 | 0.39 | 6.30 | 0.0825 | -0.0016 | |||
| COP / ConocoPhillips | 0.00 | 11.99 | 0.38 | 18.01 | 0.0810 | 0.0067 | |||
| WRB / W. R. Berkley Corporation | 0.00 | -4.00 | 0.38 | -0.52 | 0.0810 | -0.0072 | |||
| ADP / Automatic Data Processing, Inc. | 0.00 | 0.08 | 0.38 | -4.76 | 0.0809 | -0.0111 | |||
| GE / General Electric Company | 0.00 | 0.37 | 0.0796 | 0.0796 | |||||
| CII / BlackRock Enhanced Large Cap Core Fund, Inc. | 0.02 | 0.48 | 0.37 | 8.16 | 0.0790 | -0.0000 | |||
| VNLA / Janus Detroit Street Trust - Janus Henderson Short Duration Income ETF | 0.01 | -5.04 | 0.35 | -5.11 | 0.0753 | -0.0104 | |||
| ROK / Rockwell Automation, Inc. | 0.00 | 1.33 | 0.35 | 6.77 | 0.0738 | -0.0012 | |||
| VMC / Vulcan Materials Company | 0.00 | 0.09 | 0.35 | 18.15 | 0.0735 | 0.0061 | |||
| INTC / Intel Corporation | 0.01 | 5.15 | 0.34 | 57.80 | 0.0733 | 0.0229 | |||
| BKFOF / Brookfield Corporation - Preferred Stock | 0.00 | 0.00 | 0.34 | 11.04 | 0.0728 | 0.0017 | |||
| IBIT / iShares Bitcoin Trust ETF | 0.01 | 0.00 | 0.34 | 6.21 | 0.0728 | -0.0014 | |||
| MRVL / Marvell Technology, Inc. | 0.00 | 23.66 | 0.34 | 34.54 | 0.0714 | 0.0138 | |||
| QQQ / Invesco QQQ Trust, Series 1 | 0.00 | -2.34 | 0.33 | 6.54 | 0.0694 | -0.0012 | |||
| FNV / Franco-Nevada Corporation | 0.00 | 0.00 | 0.33 | 35.98 | 0.0692 | 0.0141 | |||
| WFC / Wells Fargo & Company | 0.00 | -4.89 | 0.31 | -0.64 | 0.0665 | -0.0059 | |||
| VFLO / Victory Portfolios II - VictoryShares Free Cash Flow ETF | 0.01 | 30.21 | 0.31 | 38.39 | 0.0661 | 0.0143 | |||
| AROC / Archrock, Inc. | 0.01 | 0.89 | 0.31 | 6.99 | 0.0652 | -0.0008 | |||
| GLD / SPDR Gold Shares | 0.00 | -16.44 | 0.30 | -2.28 | 0.0638 | -0.0071 | |||
| MDLZ / Mondelez International, Inc. | 0.00 | 0.28 | 0.30 | -6.94 | 0.0628 | -0.0103 | |||
| TOL / Toll Brothers, Inc. | 0.00 | -1.57 | 0.29 | 19.11 | 0.0624 | 0.0057 | |||
| EVT / Eaton Vance Tax-Advantaged Dividend Income Fund | 0.01 | 0.00 | 0.29 | 1.38 | 0.0624 | -0.0042 | |||
| HOLX / Hologic, Inc. | 0.00 | -1.88 | 0.29 | 1.74 | 0.0623 | -0.0041 | |||
| NVS / Novartis AG - Depositary Receipt (Common Stock) | 0.00 | 0.00 | 0.29 | 5.86 | 0.0616 | -0.0013 | |||
| UBER / Uber Technologies, Inc. | 0.00 | 0.28 | 0.0602 | 0.0602 | |||||
| ITW / Illinois Tool Works Inc. | 0.00 | 0.09 | 0.28 | 5.64 | 0.0599 | -0.0016 | |||
| VGT / Vanguard World Fund - Vanguard Information Technology ETF | 0.00 | 0.27 | 0.28 | 12.45 | 0.0597 | 0.0023 | |||
| SETM / Sprott Funds Trust - Sprott Critical Materials ETF | 0.01 | 0.00 | 0.28 | 44.79 | 0.0593 | 0.0151 | |||
| AMD / Advanced Micro Devices, Inc. | 0.00 | 17.63 | 0.27 | 34.48 | 0.0581 | 0.0112 | |||
| LDOS / Leidos Holdings, Inc. | 0.00 | -4.10 | 0.27 | 14.72 | 0.0564 | 0.0032 | |||
| GEV / GE Vernova Inc. | 0.00 | 0.26 | 0.0560 | 0.0560 | |||||
| NBIS / Nebius Group N.V. | 0.00 | 0.25 | 0.0529 | 0.0529 | |||||
| AMAT / Applied Materials, Inc. | 0.00 | 1.43 | 0.25 | 13.30 | 0.0526 | 0.0024 | |||
| VICI / VICI Properties Inc. | 0.01 | 1.66 | 0.25 | 2.08 | 0.0521 | -0.0034 | |||
| MA / Mastercard Incorporated | 0.00 | 3.37 | 0.24 | 4.72 | 0.0520 | -0.0018 | |||
| WY / Weyerhaeuser Company | 0.01 | -1.49 | 0.24 | -5.12 | 0.0514 | -0.0072 | |||
| CAT / Caterpillar Inc. | 0.00 | 0.24 | 0.0514 | 0.0514 | |||||
| VOO / Vanguard Index Funds - Vanguard S&P 500 ETF | 0.00 | 0.00 | 0.24 | 7.62 | 0.0512 | -0.0002 | |||
| AEM / Agnico Eagle Mines Limited | 0.00 | 0.23 | 0.0497 | 0.0497 | |||||
| ATO / Atmos Energy Corporation | 0.00 | 0.44 | 0.23 | 11.48 | 0.0497 | 0.0013 | |||
| SII / Sprott Inc. | 0.00 | 0.23 | 0.0488 | 0.0488 | |||||
| GILD / Gilead Sciences, Inc. | 0.00 | 2.23 | 0.22 | 2.28 | 0.0477 | -0.0028 | |||
| ETN / Eaton Corporation plc | 0.00 | 0.00 | 0.22 | 5.26 | 0.0468 | -0.0015 | |||
| EW / Edwards Lifesciences Corporation | 0.00 | 0.00 | 0.22 | -0.46 | 0.0460 | -0.0041 | |||
| BMY / Bristol-Myers Squibb Company | 0.00 | 0.49 | 0.21 | -2.28 | 0.0457 | -0.0048 | |||
| PBR / Petróleo Brasileiro S.A. - Petrobras - Depositary Receipt (Common Stock) | 0.02 | -5.62 | 0.21 | -4.50 | 0.0452 | -0.0061 | |||
| CMI / Cummins Inc. | 0.00 | 0.21 | 0.0449 | 0.0449 | |||||
| NEE / NextEra Energy, Inc. | 0.00 | 0.21 | 0.0449 | 0.0449 | |||||
| GPC / Genuine Parts Company | 0.00 | 0.21 | 0.0447 | 0.0447 | |||||
| GD / General Dynamics Corporation | 0.00 | 0.21 | 0.0447 | 0.0447 | |||||
| SU / Suncor Energy Inc. | 0.01 | 0.21 | 0.0445 | 0.0445 | |||||
| TJX / The TJX Companies, Inc. | 0.00 | 0.21 | 0.0445 | 0.0445 | |||||
| NXE / NexGen Energy Ltd. | 0.01 | 0.00 | 0.09 | 28.57 | 0.0193 | 0.0031 | |||
| WRAP / Wrap Technologies, Inc. | 0.03 | -24.50 | 0.07 | 4.29 | 0.0156 | -0.0005 | |||
| GLDG / GoldMining Inc. | 0.02 | 17.82 | 0.02 | 100.00 | 0.0052 | 0.0024 | |||
| EOG / EOG Resources, Inc. | 0.00 | -100.00 | 0.00 | -100.00 | -0.0485 | ||||
| SWTX / SpringWorks Therapeutics, Inc. | 0.00 | -100.00 | 0.00 | 0.0000 | |||||
| WM / Waste Management, Inc. | 0.00 | -100.00 | 0.00 | 0.0000 |