Estatísticas Básicas
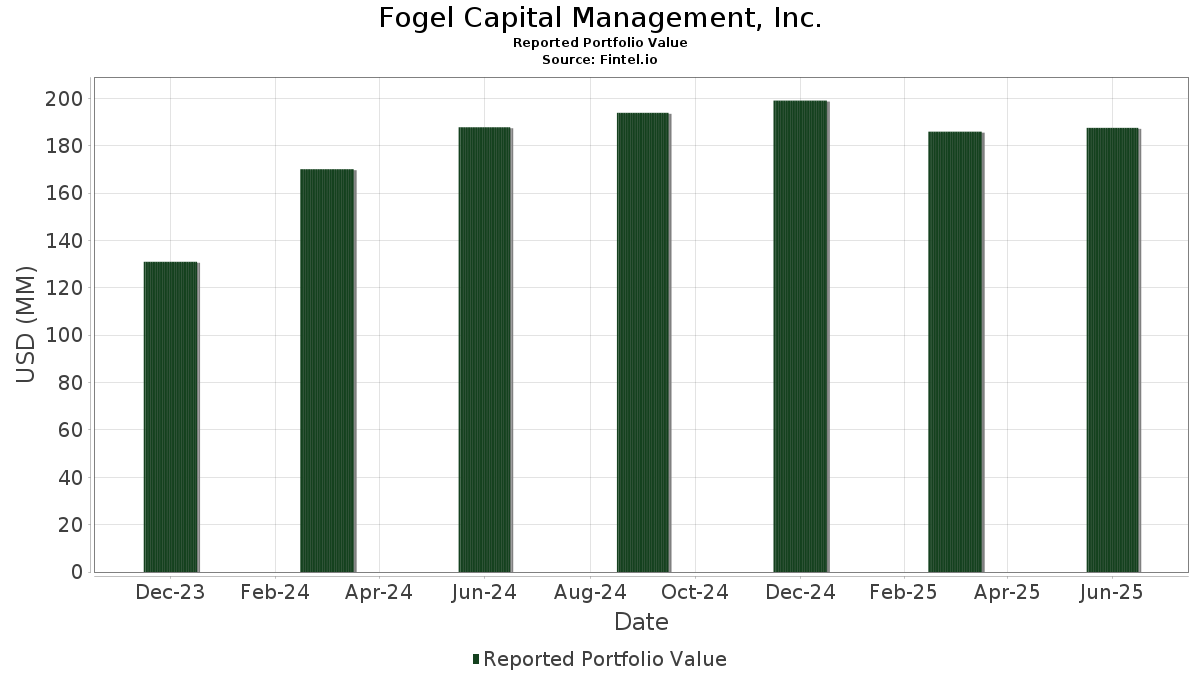
| Valor do Portfólio | $ 216,101,938 |
| Posições Atuais | 55 |
Últimas Participações, Desempenho, AUM (de 13F, 13D)
Fogel Capital Management, Inc. divulgou 55 participações totais em seus últimos arquivamentos da SEC. O valor mais recente da carteira é calculado como $ 216,101,938 USD. O Ativo Total Sob Gestão (AUM) é esse valor mais o caixa (que não é divulgado). As principais posições de Fogel Capital Management, Inc. são Alphabet Inc. (US:GOOGL) , Microsoft Corporation (US:MSFT) , Berkshire Hathaway Inc. (US:BRK.B) , Chubb Limited (US:CB) , and Kratos Defense & Security Solutions, Inc. (US:KTOS) . As novas posições de Fogel Capital Management, Inc. incluem The Boeing Company (US:BA) , Sea Limited - Depositary Receipt (Common Stock) (US:SE) , .
Maiores Aumentos Este Trimestre
Usamos a mudança na alocação do portfólio porque esta é a métrica mais significativa. As mudanças podem ser devido a operações ou mudanças nos preços das ações.
| Ativo | Ações (MM) |
Valor (MM$) |
% do Portfólio | Δ% do Portfólio |
|---|---|---|---|---|
| 0.14 | 12.82 | 5.9324 | 2.4212 | |
| 0.12 | 28.74 | 13.2997 | 2.2235 | |
| 0.01 | 2.61 | 1.2101 | 1.2101 | |
| 0.04 | 12.03 | 5.5686 | 0.2537 | |
| 0.00 | 0.50 | 0.2303 | 0.2303 | |
| 0.04 | 2.39 | 1.1052 | 0.2057 | |
| 0.04 | 6.80 | 3.1470 | 0.1511 | |
| 0.01 | 6.34 | 2.9316 | 0.1183 | |
| 0.00 | 0.23 | 0.1063 | 0.1063 | |
| 0.01 | 1.90 | 0.8802 | 0.0842 |
Maiores Diminuições Este Trimestre
Usamos a mudança na alocação do portfólio porque esta é a métrica mais significativa. As mudanças podem ser devido a operações ou mudanças nos preços das ações.
| Ativo | Ações (MM) |
Valor (MM$) |
% do Portfólio | Δ% do Portfólio |
|---|---|---|---|---|
| 0.05 | 24.62 | 11.3940 | -1.2311 | |
| 0.05 | 13.77 | 6.3702 | -1.1514 | |
| 0.03 | 15.13 | 7.0004 | -0.7913 | |
| 0.00 | 6.95 | 3.2161 | -0.7783 | |
| 0.36 | 11.31 | 5.2344 | -0.6416 | |
| 0.01 | 5.32 | 2.4629 | -0.4994 | |
| 0.49 | 8.46 | 3.9152 | -0.3543 | |
| 0.01 | 2.76 | 1.2780 | -0.3394 | |
| 0.06 | 5.53 | 2.5599 | -0.2527 | |
| 0.04 | 3.26 | 1.5099 | -0.2202 |
Arquivamentos 13F e Fundo
Este formulário foi arquivado em 2025-10-21 para o período de relatório 2025-09-30. Clique no ícone de link para ver o histórico completo da transação.
Atualize para desbloquear dados premium e exportar para Excel ![]() .
.
| Ativo | Tipo | Preço Médio por Ação | Ações (MM) |
ΔAções (%) |
Valor ($MM) |
ΔAções (%) |
Portfólio (%) |
ΔPortfólio (%) |
|
|---|---|---|---|---|---|---|---|---|---|
| GOOGL / Alphabet Inc. | 0.12 | 0.31 | 28.74 | 38.37 | 13.2997 | 2.2235 | |||
| MSFT / Microsoft Corporation | 0.05 | -0.12 | 24.62 | 4.00 | 11.3940 | -1.2311 | |||
| BRK.B / Berkshire Hathaway Inc. | 0.03 | 0.04 | 15.13 | 3.53 | 7.0004 | -0.7913 | |||
| CB / Chubb Limited | 0.05 | 0.18 | 13.77 | -2.40 | 6.3702 | -1.1514 | |||
| KTOS / Kratos Defense & Security Solutions, Inc. | 0.14 | -1.02 | 12.82 | 94.71 | 5.9324 | 2.4212 | |||
| AVGO / Broadcom Inc. | 0.04 | 0.88 | 12.03 | 20.74 | 5.5686 | 0.2537 | |||
| EPD / Enterprise Products Partners L.P. - Limited Partnership | 0.36 | 1.80 | 11.31 | 2.65 | 5.2344 | -0.6416 | |||
| ET / Energy Transfer LP - Limited Partnership | 0.49 | 11.65 | 8.46 | 5.67 | 3.9152 | -0.3543 | |||
| MELI / MercadoLibre, Inc. | 0.00 | 3.77 | 6.95 | -7.21 | 3.2161 | -0.7783 | |||
| JNJ / Johnson & Johnson | 0.04 | -0.28 | 6.80 | 21.04 | 3.1470 | 0.1511 | |||
| ESLT / Elbit Systems Ltd. | 0.01 | 5.88 | 6.34 | 20.09 | 2.9316 | 0.1183 | |||
| SPY / SPDR S&P 500 ETF | 0.01 | 0.04 | 5.98 | 7.87 | 2.7670 | -0.1889 | |||
| COP / ConocoPhillips | 0.06 | -0.49 | 5.53 | 4.87 | 2.5599 | -0.2527 | |||
| MCO / Moody's Corporation | 0.01 | 0.86 | 5.32 | -4.19 | 2.4629 | -0.4994 | |||
| AAPL / Apple Inc. | 0.02 | -4.10 | 4.90 | 19.03 | 2.2668 | 0.0721 | |||
| TDY / Teledyne Technologies Incorporated | 0.01 | 2.77 | 4.41 | 17.54 | 2.0407 | 0.0404 | |||
| VO / Vanguard Index Funds - Vanguard Mid-Cap ETF | 0.01 | 0.35 | 4.22 | 5.32 | 1.9527 | -0.1835 | |||
| AMZN / Amazon.com, Inc. | 0.02 | 10.87 | 4.19 | 10.98 | 1.9403 | -0.0747 | |||
| ACGL / Arch Capital Group Ltd. | 0.04 | 0.93 | 3.26 | 0.59 | 1.5099 | -0.2202 | |||
| BRK.A / Berkshire Hathaway Inc. | 0.00 | 0.00 | 3.02 | 3.46 | 1.3960 | -0.1585 | |||
| DE / Deere & Company | 0.01 | 1.26 | 2.76 | -8.97 | 1.2780 | -0.3394 | |||
| BA / The Boeing Company | 0.01 | 2.61 | 1.2101 | 1.2101 | |||||
| EQT / EQT Corporation | 0.04 | 51.70 | 2.39 | 41.64 | 1.1052 | 0.2057 | |||
| EEM / iShares, Inc. - iShares MSCI Emerging Markets ETF | 0.04 | 3.63 | 2.32 | 14.69 | 1.0736 | -0.0049 | |||
| NVDA / NVIDIA Corporation | 0.01 | 7.90 | 1.90 | 27.48 | 0.8802 | 0.0842 | |||
| CVX / Chevron Corporation | 0.01 | 1.55 | 1.63 | 10.13 | 0.7548 | -0.0350 | |||
| IWM / iShares Trust - iShares Russell 2000 ETF | 0.01 | 14.65 | 1.61 | 28.51 | 0.7449 | 0.0771 | |||
| VST / Vistra Corp. | 0.01 | 0.13 | 1.55 | 1.24 | 0.7169 | -0.0993 | |||
| PFF / iShares Trust - iShares Preferred and Income Securities ETF | 0.05 | 17.56 | 1.54 | 21.16 | 0.7130 | 0.0349 | |||
| HON / Honeywell International Inc. | 0.01 | 33.10 | 1.08 | 20.29 | 0.4994 | 0.0211 | |||
| BFB / Brown-Forman Corp. - Class B | 0.04 | -0.51 | 1.05 | 0.10 | 0.4862 | -0.0734 | |||
| DIA / SPDR Dow Jones Industrial Average ETF Trust | 0.00 | -1.65 | 0.75 | 3.61 | 0.3457 | -0.0392 | |||
| MMC / Marsh & McLennan Companies, Inc. | 0.00 | 0.00 | 0.53 | -7.88 | 0.2438 | -0.0610 | |||
| SE / Sea Limited - Depositary Receipt (Common Stock) | 0.00 | 0.50 | 0.2303 | 0.2303 | |||||
| BAC / Bank of America Corporation | 0.01 | -9.39 | 0.48 | -1.24 | 0.2213 | -0.0369 | |||
| IVV / iShares Trust - iShares Core S&P 500 ETF | 0.00 | 0.00 | 0.47 | 8.01 | 0.2185 | -0.0150 | |||
| V / Visa Inc. | 0.00 | 70.87 | 0.45 | 64.10 | 0.2076 | 0.0620 | |||
| PLTR / Palantir Technologies Inc. | 0.00 | 0.68 | 0.41 | 34.44 | 0.1883 | 0.0272 | |||
| UNH / UnitedHealth Group Incorporated | 0.00 | -0.77 | 0.35 | 9.60 | 0.1643 | -0.0081 | |||
| TSLA / Tesla, Inc. | 0.00 | 0.00 | 0.35 | 40.08 | 0.1605 | 0.0284 | |||
| GOOG / Alphabet Inc. | 0.00 | 0.00 | 0.35 | 37.30 | 0.1603 | 0.0257 | |||
| DVY / iShares Trust - iShares Select Dividend ETF | 0.00 | 0.00 | 0.33 | 7.07 | 0.1542 | -0.0119 | |||
| ENB / Enbridge Inc. | 0.01 | 0.00 | 0.33 | 11.49 | 0.1529 | -0.0053 | |||
| ARKB / ARK 21Shares Bitcoin ETF | 0.01 | 0.00 | 0.30 | 6.34 | 0.1399 | -0.0119 | |||
| XOM / Exxon Mobil Corporation | 0.00 | -10.23 | 0.30 | -6.23 | 0.1396 | -0.0318 | |||
| META / Meta Platforms, Inc. | 0.00 | 0.00 | 0.28 | -0.36 | 0.1274 | -0.0202 | |||
| SPLV / Invesco Exchange-Traded Fund Trust II - Invesco S&P 500 Low Volatility ETF | 0.00 | 0.00 | 0.27 | 1.13 | 0.1241 | -0.0176 | |||
| RSP / Invesco Exchange-Traded Fund Trust - Invesco S&P 500 Equal Weight ETF | 0.00 | 0.00 | 0.25 | 4.60 | 0.1158 | -0.0120 | |||
| VOO / Vanguard Index Funds - Vanguard S&P 500 ETF | 0.00 | -2.02 | 0.24 | 5.80 | 0.1100 | -0.0099 | |||
| IWF / iShares Trust - iShares Russell 1000 Growth ETF | 0.00 | 0.00 | 0.24 | 10.28 | 0.1095 | -0.0049 | |||
| ACWX / iShares Trust - iShares MSCI ACWI ex U.S. ETF | 0.00 | 0.23 | 0.1063 | 0.1063 | |||||
| IJH / iShares Trust - iShares Core S&P Mid-Cap ETF | 0.00 | 0.00 | 0.23 | 5.58 | 0.1051 | -0.0100 | |||
| AXP / American Express Company | 0.00 | 4.75 | 0.22 | 8.96 | 0.1016 | -0.0057 | |||
| ORGN / Origin Materials, Inc. | 0.02 | 0.00 | 0.01 | 0.00 | 0.0046 | -0.0003 | |||
| ORGNW / Origin Materials, Inc. - Equity Warrant | 0.06 | 0.00 | 0.00 | -100.00 | 0.0004 | -0.0002 | |||
| PRME / Prime Medicine, Inc. | 0.00 | -100.00 | 0.00 | -100.00 | -0.0132 |