Estatísticas Básicas
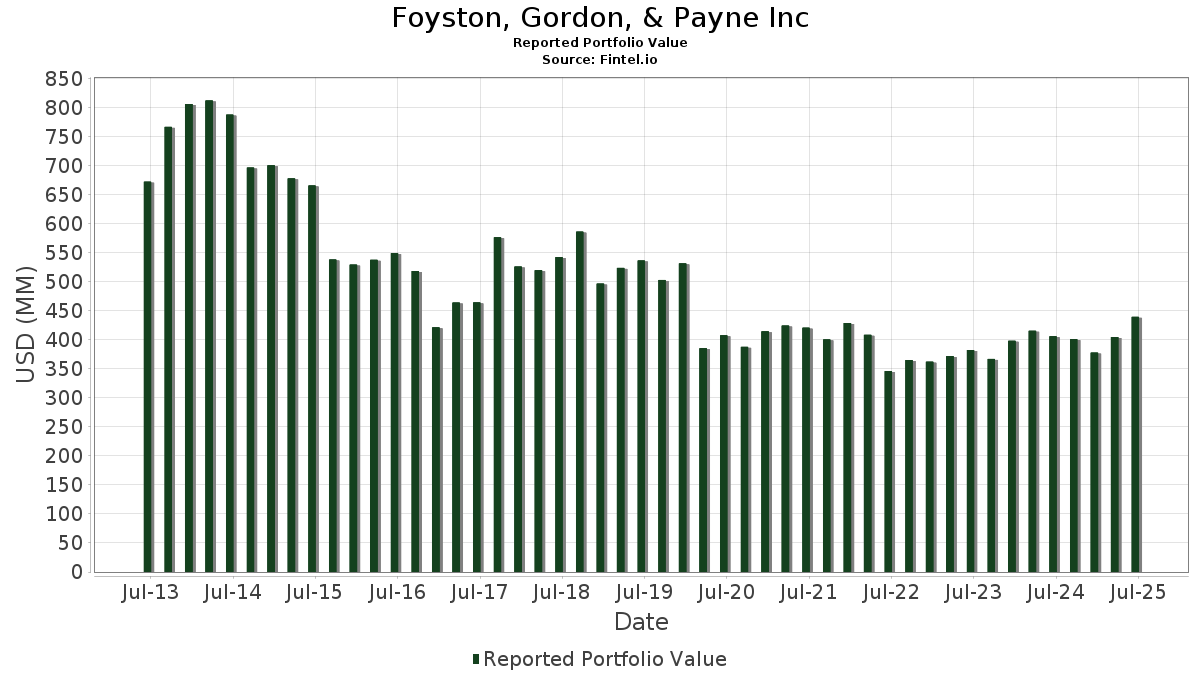
| Valor do Portfólio | $ 457,530,221 |
| Posições Atuais | 55 |
Últimas Participações, Desempenho, AUM (de 13F, 13D)
Foyston, Gordon, & Payne Inc divulgou 55 participações totais em seus últimos arquivamentos da SEC. O valor mais recente da carteira é calculado como $ 457,530,221 USD. O Ativo Total Sob Gestão (AUM) é esse valor mais o caixa (que não é divulgado). As principais posições de Foyston, Gordon, & Payne Inc são Microsoft Corporation (US:MSFT) , Alphabet Inc. (US:GOOGL) , Broadcom Inc. (US:AVGO) , Philip Morris International Inc. (US:PM) , and Meta Platforms, Inc. (US:META) . As novas posições de Foyston, Gordon, & Payne Inc incluem Gartner, Inc. (US:IT) , Salesforce, Inc. (US:CRM) , ExlService Holdings, Inc. (US:EXLS) , .
Maiores Aumentos Este Trimestre
Usamos a mudança na alocação do portfólio porque esta é a métrica mais significativa. As mudanças podem ser devido a operações ou mudanças nos preços das ações.
| Ativo | Ações (MM) |
Valor (MM$) |
% do Portfólio | Δ% do Portfólio |
|---|---|---|---|---|
| 0.03 | 8.43 | 1.8428 | 1.8428 | |
| 0.12 | 30.27 | 6.6169 | 1.7092 | |
| 0.02 | 4.13 | 0.9022 | 0.9022 | |
| 0.11 | 9.79 | 2.1391 | 0.8579 | |
| 0.07 | 3.00 | 0.6549 | 0.6549 | |
| 0.01 | 2.49 | 0.5438 | 0.5438 | |
| 0.08 | 14.47 | 3.1626 | 0.5393 | |
| 0.02 | 6.86 | 1.4994 | 0.4203 | |
| 0.09 | 29.94 | 6.5443 | 0.3814 | |
| 0.06 | 10.32 | 2.2558 | 0.2814 |
Maiores Diminuições Este Trimestre
Usamos a mudança na alocação do portfólio porque esta é a métrica mais significativa. As mudanças podem ser devido a operações ou mudanças nos preços das ações.
| Ativo | Ações (MM) |
Valor (MM$) |
% do Portfólio | Δ% do Portfólio |
|---|---|---|---|---|
| 0.04 | 3.22 | 0.7041 | -1.6880 | |
| 0.13 | 16.44 | 3.5926 | -1.3333 | |
| 0.03 | 24.20 | 5.2899 | -1.2481 | |
| 0.18 | 29.14 | 6.3687 | -0.9926 | |
| 0.07 | 4.59 | 1.0029 | -0.8903 | |
| 0.04 | 12.78 | 2.7925 | -0.6669 | |
| 0.04 | 16.49 | 3.6038 | -0.5867 | |
| 0.00 | 14.18 | 3.0989 | -0.3045 | |
| 0.06 | 11.92 | 2.6057 | -0.2426 | |
| 0.11 | 7.08 | 1.5483 | -0.2252 |
Arquivamentos 13F e Fundo
Este formulário foi arquivado em 2025-11-12 para o período de relatório 2025-09-30. Clique no ícone de link para ver o histórico completo da transação.
Atualize para desbloquear dados premium e exportar para Excel ![]() .
.
| Ativo | Tipo | Preço Médio por Ação | Ações (MM) |
ΔAções (%) |
Valor ($MM) |
ΔAções (%) |
Portfólio (%) |
ΔPortfólio (%) |
|
|---|---|---|---|---|---|---|---|---|---|
| MSFT / Microsoft Corporation | 0.08 | 0.99 | 39.06 | 5.16 | 8.5364 | 0.0798 | |||
| GOOGL / Alphabet Inc. | 0.12 | 1.82 | 30.27 | 40.46 | 6.6169 | 1.7092 | |||
| AVGO / Broadcom Inc. | 0.09 | -7.57 | 29.94 | 10.62 | 6.5443 | 0.3814 | |||
| PM / Philip Morris International Inc. | 0.18 | 1.20 | 29.14 | -9.87 | 6.3687 | -0.9926 | |||
| META / Meta Platforms, Inc. | 0.03 | -15.29 | 24.20 | -15.72 | 5.2899 | -1.2481 | |||
| AEC1 / American Express Company | 0.06 | 1.55 | 18.44 | 5.75 | 4.0304 | 0.0600 | |||
| MSI / Motorola Solutions, Inc. | 0.04 | -17.63 | 16.49 | -10.41 | 3.6038 | -0.5867 | |||
| FI / Fiserv, Inc. | 0.13 | 1.60 | 16.44 | -24.02 | 3.5926 | -1.3333 | |||
| ALLE / Allegion plc | 0.08 | 2.06 | 14.47 | 25.59 | 3.1626 | 0.5393 | |||
| BKNG / Booking Holdings Inc. | 0.00 | 1.70 | 14.18 | -5.14 | 3.0989 | -0.3045 | |||
| SEIC / SEI Investments Company | 0.16 | 2.66 | 13.20 | -3.06 | 2.8840 | -0.2152 | |||
| UNH / UnitedHealth Group Incorporated | 0.04 | -24.03 | 12.78 | -15.91 | 2.7925 | -0.6669 | |||
| MMC / Marsh & McLennan Companies, Inc. | 0.06 | 3.39 | 11.92 | -4.70 | 2.6057 | -0.2426 | |||
| KEYS / Keysight Technologies, Inc. | 0.06 | 2.63 | 11.23 | 9.55 | 2.4536 | 0.1205 | |||
| BDX / Becton, Dickinson and Company | 0.06 | 1.41 | 10.93 | 10.19 | 2.3893 | 0.1305 | |||
| ICLR / ICON Public Limited Company | 0.06 | -1.08 | 10.32 | 19.02 | 2.2558 | 0.2814 | |||
| OTIS / Otis Worldwide Corporation | 0.11 | 88.37 | 9.79 | 73.94 | 2.1391 | 0.8579 | |||
| IT / Gartner, Inc. | 0.03 | 8.43 | 1.8428 | 1.8428 | |||||
| CDW / CDW Corporation | 0.05 | 30.93 | 8.40 | 16.78 | 1.8358 | 0.1980 | |||
| BRK.B / Berkshire Hathaway Inc. | 0.02 | 0.00 | 8.21 | 3.49 | 1.7936 | -0.0118 | |||
| JNJ / Johnson & Johnson | 0.04 | 0.10 | 7.50 | 21.52 | 1.6389 | 0.2339 | |||
| MDLZ / Mondelez International, Inc. | 0.11 | -1.82 | 7.08 | -9.05 | 1.5483 | -0.2252 | |||
| WTW / Willis Towers Watson Public Limited Company | 0.02 | 28.43 | 6.86 | 44.76 | 1.4994 | 0.4203 | |||
| GWW / W.W. Grainger, Inc. | 0.01 | -0.23 | 6.71 | -8.60 | 1.4676 | -0.2050 | |||
| ROST / Ross Stores, Inc. | 0.04 | 0.31 | 6.70 | 19.82 | 1.4650 | 0.1913 | |||
| EA / Electronic Arts Inc. | 0.03 | 2.70 | 6.42 | 29.72 | 1.4036 | 0.2764 | |||
| KO / The Coca-Cola Company | 0.09 | 0.00 | 6.22 | -6.26 | 1.3585 | -0.1512 | |||
| WMT / Walmart Inc. | 0.06 | 0.00 | 6.17 | 5.40 | 1.3481 | 0.0157 | |||
| V / Visa Inc. | 0.02 | -3.68 | 5.63 | -7.39 | 1.2298 | -0.1535 | |||
| G / Genpact Limited | 0.12 | -3.75 | 4.86 | -8.37 | 1.0625 | -0.1456 | |||
| HSIC / Henry Schein, Inc. | 0.07 | -39.26 | 4.59 | -44.82 | 1.0029 | -0.8903 | |||
| LRCX / Lam Research Corporation | 0.03 | -1.77 | 4.40 | 35.12 | 0.9614 | 0.2202 | |||
| AOS / A. O. Smith Corporation | 0.06 | -3.08 | 4.40 | 8.51 | 0.9612 | 0.0384 | |||
| LHX / L3Harris Technologies, Inc. | 0.01 | -2.58 | 4.35 | 18.62 | 0.9510 | 0.1158 | |||
| CRM / Salesforce, Inc. | 0.02 | 4.13 | 0.9022 | 0.9022 | |||||
| CME / CME Group Inc. | 0.01 | -3.81 | 4.00 | -5.70 | 0.8744 | -0.0916 | |||
| WEX / WEX Inc. | 0.02 | -1.90 | 3.44 | 5.23 | 0.7517 | 0.0074 | |||
| ALSN / Allison Transmission Holdings, Inc. | 0.04 | -65.69 | 3.22 | -69.34 | 0.7041 | -1.6880 | |||
| EXLS / ExlService Holdings, Inc. | 0.07 | 3.00 | 0.6549 | 0.6549 | |||||
| ABBV / AbbVie Inc. | 0.01 | 0.00 | 2.82 | 24.73 | 0.6174 | 0.1018 | |||
| EXPE / Expedia Group, Inc. | 0.01 | -0.41 | 2.69 | 26.22 | 0.5872 | 0.1025 | |||
| RTX / RTX Corporation | 0.01 | 2.49 | 0.5438 | 0.5438 | |||||
| SONY / Sony Group Corporation - Depositary Receipt (Common Stock) | 0.09 | -1.21 | 2.46 | 9.31 | 0.5366 | 0.0250 | |||
| UNP / Union Pacific Corporation | 0.01 | -3.88 | 2.30 | -1.24 | 0.5030 | -0.0276 | |||
| ABT / Abbott Laboratories | 0.01 | 0.00 | 1.63 | -1.51 | 0.3571 | -0.0207 | |||
| NVS / Novartis AG - Depositary Receipt (Common Stock) | 0.01 | -1.42 | 1.36 | 4.47 | 0.2965 | 0.0009 | |||
| KVUE / Kenvue Inc. | 0.06 | -10.79 | 0.91 | -30.79 | 0.1980 | -0.1002 | |||
| LECO / Lincoln Electric Holdings, Inc. | 0.00 | 8.67 | 0.66 | 23.64 | 0.1441 | 0.0227 | |||
| GJR / Strats Trust For Procter & Gambel Security - Preferred Security | 0.00 | 0.00 | 0.54 | -3.56 | 0.1186 | -0.0095 | |||
| EXP / Eagle Materials Inc. | 0.00 | 8.64 | 0.50 | 25.12 | 0.1101 | 0.0185 | |||
| KHC / The Kraft Heinz Company | 0.02 | 0.00 | 0.48 | 0.84 | 0.1048 | -0.0035 | |||
| AX / Axos Financial, Inc. | 0.00 | 4.93 | 0.40 | 16.81 | 0.0882 | 0.0095 | |||
| XOM / Exxon Mobil Corporation | 0.00 | 0.00 | 0.36 | 4.37 | 0.0784 | 0.0003 | |||
| SNY / Sanofi - Depositary Receipt (Common Stock) | 0.01 | -6.88 | 0.25 | -8.89 | 0.0538 | -0.0078 | |||
| HL / Hecla Mining Company | 0.02 | -91.73 | 0.18 | -83.38 | 0.0402 | -0.2106 | |||
| RTX / RTX Corporation | 0.00 | -100.00 | 0.00 | 0.0000 | |||||
| SPNS / Sapiens International Corporation N.V. | 0.00 | -100.00 | 0.00 | -100.00 | -0.0759 |