Estatísticas Básicas
| Valor do Portfólio | $ 648,039 |
| Posições Atuais | 72 |
Últimas Participações, Desempenho, AUM (de 13F, 13D)
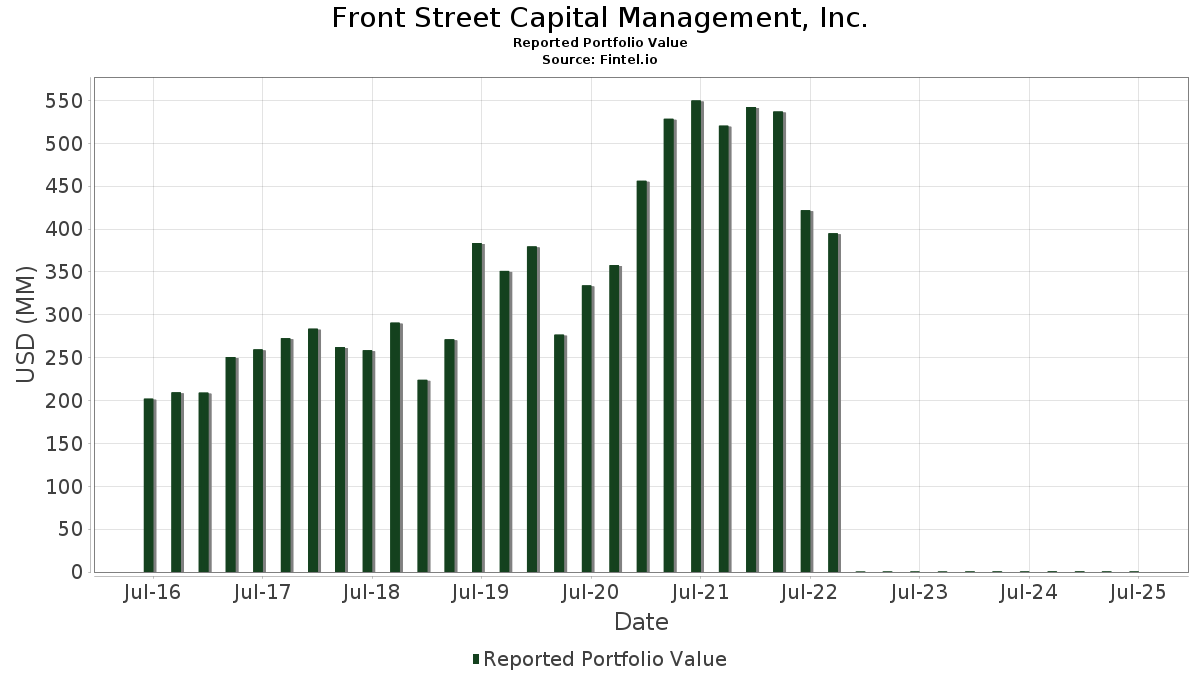
Front Street Capital Management, Inc. divulgou 72 participações totais em seus últimos arquivamentos da SEC. O valor mais recente da carteira é calculado como $ 648,039 USD. O Ativo Total Sob Gestão (AUM) é esse valor mais o caixa (que não é divulgado). As principais posições de Front Street Capital Management, Inc. são Lumen Technologies, Inc. (US:LUMN) , The Hershey Company (US:HSY) , Cognex Corporation (US:CGNX) , Vanguard Index Funds - Vanguard S&P 500 ETF (US:VOO) , and GE Vernova Inc. (US:GEV) . As novas posições de Front Street Capital Management, Inc. incluem Baxter International Inc. (US:BAX) , SPDR Series Trust - State Street SPDR Bloomberg 1-3 Month T-Bill ETF (US:BIL) , .
Maiores Aumentos Este Trimestre
Usamos a mudança na alocação do portfólio porque esta é a métrica mais significativa. As mudanças podem ser devido a operações ou mudanças nos preços das ações.
| Ativo | Ações (MM) |
Valor (MM$) |
% do Portfólio | Δ% do Portfólio |
|---|---|---|---|---|
| 0.07 | 0.04 | 6.5502 | 5.7929 | |
| 12.17 | 0.07 | 11.4414 | 1.3973 | |
| 0.01 | 0.01 | 1.0831 | 1.0831 | |
| 1.29 | 0.06 | 9.0578 | 1.0063 | |
| 0.26 | 0.01 | 0.9081 | 0.9081 | |
| 0.25 | 0.01 | 1.1078 | 0.7507 | |
| 0.11 | 0.02 | 2.6461 | 0.6622 | |
| 0.10 | 0.01 | 2.1994 | 0.6366 | |
| 0.21 | 0.02 | 2.6457 | 0.4537 | |
| 0.01 | 0.00 | 0.3455 | 0.3455 |
Maiores Diminuições Este Trimestre
Usamos a mudança na alocação do portfólio porque esta é a métrica mais significativa. As mudanças podem ser devido a operações ou mudanças nos preços das ações.
| Ativo | Ações (MM) |
Valor (MM$) |
% do Portfólio | Δ% do Portfólio |
|---|---|---|---|---|
| 3.28 | 0.03 | 5.0556 | -2.4907 | |
| 0.02 | 0.02 | 3.1710 | -1.7497 | |
| 0.07 | 0.03 | 5.1057 | -1.5287 | |
| 0.22 | 0.07 | 10.1829 | -1.2789 | |
| 0.12 | 0.02 | 3.7488 | -0.9273 | |
| 0.16 | 0.02 | 2.6724 | -0.9121 | |
| 0.65 | 0.01 | 1.7689 | -0.6473 | |
| 0.34 | 0.02 | 2.5636 | -0.6364 | |
| 0.29 | 0.01 | 1.1715 | -0.6241 | |
| 0.06 | 0.03 | 5.2350 | -0.4740 |
Arquivamentos 13F e Fundo
Este formulário foi arquivado em 2025-11-14 para o período de relatório 2025-09-30. Clique no ícone de link para ver o histórico completo da transação.
Atualize para desbloquear dados premium e exportar para Excel ![]() .
.
| Ativo | Tipo | Preço Médio por Ação | Ações (MM) |
ΔAções (%) |
Valor ($MM) |
ΔAções (%) |
Portfólio (%) |
ΔPortfólio (%) |
|
|---|---|---|---|---|---|---|---|---|---|
| LUMN / Lumen Technologies, Inc. | 12.17 | 1.65 | 0.07 | 42.31 | 11.4414 | 1.3973 | |||
| HSY / The Hershey Company | 0.22 | -5.57 | 0.07 | 10.17 | 10.1829 | -1.2789 | |||
| CGNX / Cognex Corporation | 1.29 | -2.25 | 0.06 | 38.10 | 9.0578 | 1.0063 | |||
| VOO / Vanguard Index Funds - Vanguard S&P 500 ETF | 0.07 | 896.38 | 0.04 | 1,300.00 | 6.5502 | 5.7929 | |||
| GEV / GE Vernova Inc. | 0.06 | -1.98 | 0.03 | 13.79 | 5.2350 | -0.4740 | |||
| BRK.B / Berkshire Hathaway Inc. | 0.07 | -7.42 | 0.03 | -2.94 | 5.1057 | -1.5287 | |||
| MTW / The Manitowoc Company, Inc. | 3.28 | -0.02 | 0.03 | -17.95 | 5.0556 | -2.4907 | |||
| DHR / Danaher Corporation | 0.12 | -0.67 | 0.02 | 0.00 | 3.7488 | -0.9273 | |||
| COST / Costco Wholesale Corporation | 0.02 | -14.38 | 0.02 | -20.00 | 3.1710 | -1.7497 | |||
| ESAB / ESAB Corporation | 0.16 | -0.10 | 0.02 | -5.56 | 2.6724 | -0.9121 | |||
| LITE / Lumentum Holdings Inc. | 0.11 | -3.25 | 0.02 | 70.00 | 2.6461 | 0.6622 | |||
| GLW / Corning Incorporated | 0.21 | -3.83 | 0.02 | 54.55 | 2.6457 | 0.4537 | |||
| JOE / The St. Joe Company | 0.34 | -4.11 | 0.02 | 0.00 | 2.5636 | -0.6364 | |||
| CIEN / Ciena Corporation | 0.10 | -2.42 | 0.01 | 75.00 | 2.1994 | 0.6366 | |||
| TEX / Terex Corporation | 0.26 | -0.60 | 0.01 | 8.33 | 2.0428 | -0.2795 | |||
| COHR / Coherent Corp. | 0.12 | -0.26 | 0.01 | 20.00 | 1.9829 | -0.0612 | |||
| NUE / Nucor Corporation | 0.09 | -0.07 | 0.01 | 0.00 | 1.8092 | -0.3403 | |||
| MLKN / MillerKnoll, Inc. | 0.65 | -0.50 | 0.01 | -8.33 | 1.7689 | -0.6473 | |||
| MOD / Modine Manufacturing Company | 0.08 | -1.19 | 0.01 | 42.86 | 1.6889 | 0.2183 | |||
| VNT / Vontier Corporation | 0.19 | -4.02 | 0.01 | 0.00 | 1.2081 | -0.1660 | |||
| AAPL / Apple Inc. | 0.03 | -1.09 | 0.01 | 16.67 | 1.1972 | -0.0143 | |||
| ATS / ATS Corporation | 0.29 | -1.43 | 0.01 | -22.22 | 1.1715 | -0.6241 | |||
| AZTA / Azenta, Inc. | 0.25 | 312.74 | 0.01 | 600.00 | 1.1078 | 0.7507 | |||
| US9229087104 / VANGUARD 500 INDEX FUND VANGUARD 500 INDEX ADM | 0.01 | 0.01 | 1.0831 | 1.0831 | |||||
| PH / Parker-Hannifin Corporation | 0.01 | -1.25 | 0.01 | 0.00 | 1.0189 | -0.1613 | |||
| ENOV / Enovis Corporation | 0.21 | -0.89 | 0.01 | 0.00 | 0.9637 | -0.2844 | |||
| BAX / Baxter International Inc. | 0.26 | 0.01 | 0.9081 | 0.9081 | |||||
| GEHC / GE HealthCare Technologies Inc. | 0.07 | 0.11 | 0.01 | 0.00 | 0.8103 | -0.1816 | |||
| MSFT / Microsoft Corporation | 0.01 | 6.00 | 0.01 | 25.00 | 0.8006 | -0.1018 | |||
| GPN / Global Payments Inc. | 0.06 | -0.03 | 0.01 | 25.00 | 0.7895 | -0.1543 | |||
| IP / International Paper Company | 0.10 | 48.79 | 0.00 | 33.33 | 0.7409 | 0.1170 | |||
| VLTO / Veralto Corporation | 0.04 | -0.03 | 0.00 | 0.00 | 0.6802 | -0.1201 | |||
| CMCO / Columbus McKinnon Corporation | 0.21 | -16.56 | 0.00 | -33.33 | 0.4622 | -0.2701 | |||
| TILE / Interface, Inc. | 0.10 | -0.03 | 0.00 | 0.00 | 0.4316 | 0.0440 | |||
| MCD / McDonald's Corporation | 0.01 | -7.87 | 0.00 | 0.00 | 0.4163 | -0.1245 | |||
| Vanguard FTSE Social Index Admiral / TR UNIT (921910717) | 0.04 | 0.00 | 0.0000 | ||||||
| AMD / Advanced Micro Devices, Inc. | 0.01 | 0.00 | 0.3455 | 0.3455 | |||||
| SWPPX / Schwab Capital Trust - Schwab S&P 500 Index Fund | 0.13 | 0.00 | 0.3435 | 0.3435 | |||||
| FFH / Fairfax Financial Holdings Limited | 0.00 | 0.00 | 0.00 | 0.00 | 0.2765 | -0.0783 | |||
| MKL / Markel Group Inc. | 0.00 | 2.17 | 0.00 | 0.00 | 0.2625 | -0.0728 | |||
| GJR / Strats Trust For Procter & Gambel Security - Preferred Security | 0.01 | 0.00 | 0.00 | 0.00 | 0.2571 | -0.0742 | |||
| NVDD / Direxion Shares ETF Trust - Direxion Daily NVDA Bear 1X Shares | 0.01 | -0.79 | 0.00 | 0.00 | 0.2221 | -0.0151 | |||
| EXPD / Expeditors International of Washington, Inc. | 0.01 | -34.54 | 0.00 | 0.00 | 0.1984 | -0.1526 | |||
| GOOG / Alphabet Inc. | 0.00 | 49.76 | 0.00 | 0.1793 | 0.0718 | ||||
| VTI / Vanguard Index Funds - Vanguard Total Stock Market ETF | 0.00 | -0.16 | 0.00 | 0.1546 | -0.0234 | ||||
| SPY / SPDR S&P 500 ETF | 0.00 | 4.77 | 0.00 | 0.1512 | -0.0151 | ||||
| GOOGL / Alphabet Inc. | 0.00 | 0.53 | 0.00 | 0.1486 | 0.0149 | ||||
| GBCI / Glacier Bancorp, Inc. | 0.02 | -2.66 | 0.00 | 0.1437 | -0.0184 | ||||
| AMAT / Applied Materials, Inc. | 0.00 | -0.24 | 0.00 | 0.1295 | -0.0144 | ||||
| SBUX / Starbucks Corporation | 0.01 | 0.20 | 0.00 | 0.1068 | -0.0350 | ||||
| AMZN / Amazon.com, Inc. | 0.00 | -0.71 | 0.00 | 0.1046 | -0.0253 | ||||
| JPM / JPMorgan Chase & Co. | 0.00 | 102.67 | 0.00 | 0.0961 | 0.0421 | ||||
| BAC / Bank of America Corporation | 0.01 | -11.18 | 0.00 | 0.0949 | -0.0268 | ||||
| PYPL / PayPal Holdings, Inc. | 0.01 | -2.76 | 0.00 | 0.0858 | -0.0311 | ||||
| CVX / Chevron Corporation | 0.00 | -0.29 | 0.00 | 0.0815 | -0.0120 | ||||
| ROL / Rollins, Inc. | 0.01 | -14.84 | 0.00 | 0.0789 | -0.0317 | ||||
| KO / The Coca-Cola Company | 0.01 | -0.01 | 0.00 | 0.0718 | -0.0233 | ||||
| TSLA / Tesla, Inc. | 0.00 | 0.00 | 0.00 | 0.0670 | 0.0076 | ||||
| BIL / SPDR Series Trust - State Street SPDR Bloomberg 1-3 Month T-Bill ETF | 0.00 | 0.00 | 0.0634 | 0.0634 | |||||
| CL / Colgate-Palmolive Company | 0.01 | 0.00 | 0.00 | 0.0631 | -0.0258 | ||||
| NOC / Northrop Grumman Corporation | 0.00 | 0.00 | 0.00 | 0.0591 | -0.0011 | ||||
| CSCO / Cisco Systems, Inc. | 0.01 | 0.00 | 0.0542 | 0.0542 | |||||
| ETN / Eaton Corporation plc | 0.00 | 0.00 | 0.00 | 0.0500 | -0.0092 | ||||
| IWM / iShares Trust - iShares Russell 2000 ETF | 0.00 | 0.00 | 0.0475 | 0.0475 | |||||
| JNJ / Johnson & Johnson | 0.00 | 0.00 | 0.00 | 0.0474 | -0.0015 | ||||
| WFC / Wells Fargo & Company | 0.00 | -8.80 | 0.00 | 0.0449 | -0.0135 | ||||
| ROG / Rogers Corporation | 0.00 | 22.48 | 0.00 | 0.0446 | 0.0061 | ||||
| META / Meta Platforms, Inc. | 0.00 | 0.00 | 0.00 | 0.0397 | -0.0094 | ||||
| VZ / Verizon Communications Inc. | 0.01 | -23.40 | 0.00 | 0.0373 | -0.0222 | ||||
| QCOM / QUALCOMM Incorporated | 0.00 | -19.65 | 0.00 | 0.0341 | -0.0163 | ||||
| AXP / American Express Company | 0.00 | 0.00 | 0.00 | 0.0333 | -0.0063 | ||||
| LAB / Standard BioTools Inc. | 0.15 | 27.14 | 0.00 | 0.0307 | 0.0029 | ||||
| ITW / Illinois Tool Works Inc. | 0.00 | -100.00 | 0.00 | 0.0000 | |||||
| KE / Kimball Electronics, Inc. | 0.00 | -100.00 | 0.00 | 0.0000 | |||||
| CR / Crane Company | 0.00 | -100.00 | 0.00 | 0.0000 | |||||
| ADBE / Adobe Inc. | 0.00 | -100.00 | 0.00 | 0.0000 | -0.0400 | ||||
| RTX / RTX Corporation | 0.00 | -100.00 | 0.00 | 0.0000 | -0.0391 | ||||
| XOM / Exxon Mobil Corporation | 0.00 | -100.00 | 0.00 | 0.0000 |