Estatísticas Básicas
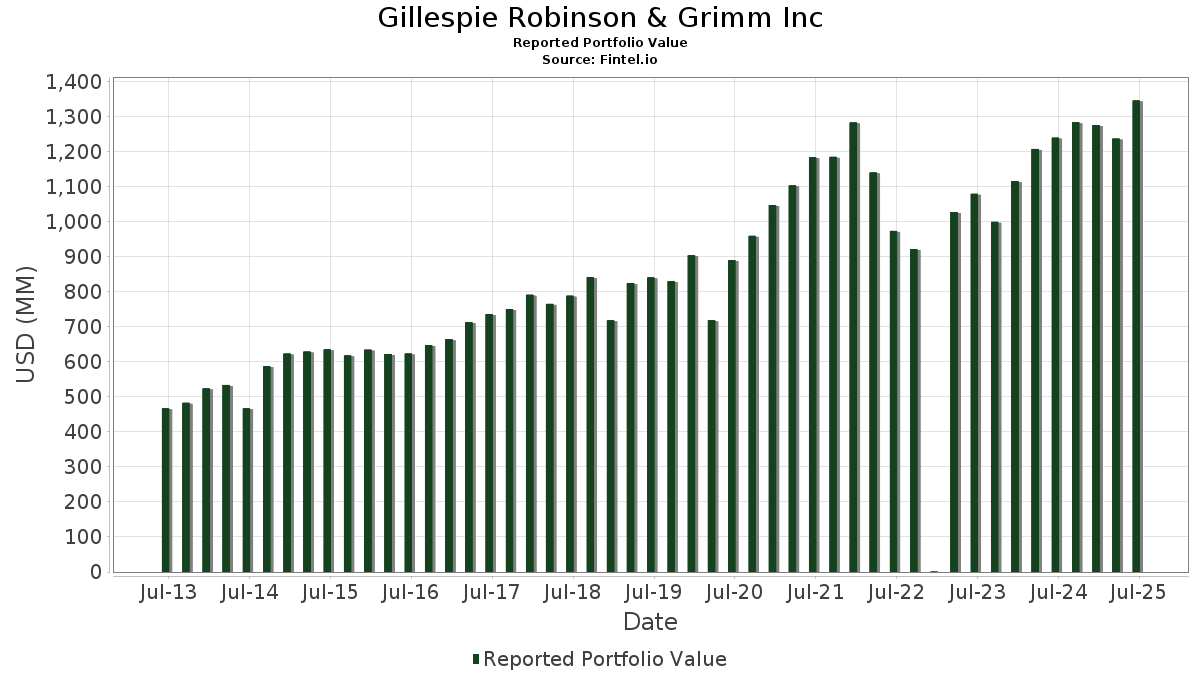
| Valor do Portfólio | $ 1,424,475,425 |
| Posições Atuais | 108 |
Últimas Participações, Desempenho, AUM (de 13F, 13D)
Gillespie Robinson & Grimm Inc divulgou 108 participações totais em seus últimos arquivamentos da SEC. O valor mais recente da carteira é calculado como $ 1,424,475,425 USD. O Ativo Total Sob Gestão (AUM) é esse valor mais o caixa (que não é divulgado). As principais posições de Gillespie Robinson & Grimm Inc são Apple Inc. (US:AAPL) , Amphenol Corporation (US:APH) , Microsoft Corporation (US:MSFT) , Meta Platforms, Inc. (US:META) , and Amazon.com, Inc. (US:AMZN) . As novas posições de Gillespie Robinson & Grimm Inc incluem Boston Scientific Corporation (US:BSX) , QXO, Inc. (US:QXO) , Stellantis N.V. (US:STLA) , .
Maiores Aumentos Este Trimestre
Usamos a mudança na alocação do portfólio porque esta é a métrica mais significativa. As mudanças podem ser devido a operações ou mudanças nos preços das ações.
| Ativo | Ações (MM) |
Valor (MM$) |
% do Portfólio | Δ% do Portfólio |
|---|---|---|---|---|
| 0.16 | 15.87 | 1.1139 | 1.1139 | |
| 0.32 | 80.35 | 5.6409 | 0.8151 | |
| 0.07 | 25.40 | 1.7832 | 0.7947 | |
| 0.20 | 47.63 | 3.3437 | 0.7382 | |
| 0.07 | 9.99 | 0.7013 | 0.4686 | |
| 0.25 | 46.97 | 3.2975 | 0.4115 | |
| 0.03 | 15.49 | 1.0875 | 0.3496 | |
| 0.30 | 56.22 | 3.9469 | 0.3255 | |
| 0.04 | 20.82 | 1.4619 | 0.2811 | |
| 0.11 | 10.53 | 0.7394 | 0.2773 |
Maiores Diminuições Este Trimestre
Usamos a mudança na alocação do portfólio porque esta é a métrica mais significativa. As mudanças podem ser devido a operações ou mudanças nos preços das ações.
| Ativo | Ações (MM) |
Valor (MM$) |
% do Portfólio | Δ% do Portfólio |
|---|---|---|---|---|
| 0.08 | 20.79 | 1.4592 | -0.8962 | |
| 0.07 | 20.71 | 1.4536 | -0.7477 | |
| 0.05 | 44.06 | 3.0933 | -0.6395 | |
| 0.01 | 0.77 | 0.0543 | -0.6227 | |
| 0.19 | 35.72 | 2.5077 | -0.5414 | |
| 0.09 | 64.52 | 4.5294 | -0.4721 | |
| 0.44 | 26.50 | 1.8605 | -0.4537 | |
| 0.14 | 46.72 | 3.2798 | -0.4281 | |
| 0.27 | 59.04 | 4.1447 | -0.4131 | |
| 0.21 | 41.41 | 2.9068 | -0.3624 |
Arquivamentos 13F e Fundo
Este formulário foi arquivado em 2025-11-19 para o período de relatório 2025-09-30. Clique no ícone de link para ver o histórico completo da transação.
Atualize para desbloquear dados premium e exportar para Excel ![]() .
.
| Ativo | Tipo | Preço Médio por Ação | Ações (MM) |
ΔAções (%) |
Valor ($MM) |
ΔAções (%) |
Portfólio (%) |
ΔPortfólio (%) |
|
|---|---|---|---|---|---|---|---|---|---|
| AAPL / Apple Inc. | 0.32 | -0.35 | 80.35 | 23.68 | 5.6409 | 0.8151 | |||
| APH / Amphenol Corporation | 0.55 | -14.88 | 68.34 | 6.67 | 4.7977 | 0.0389 | |||
| MSFT / Microsoft Corporation | 0.13 | -2.43 | 65.27 | 1.59 | 4.5820 | -0.1900 | |||
| META / Meta Platforms, Inc. | 0.09 | -3.70 | 64.52 | -4.18 | 4.5294 | -0.4721 | |||
| AMZN / Amazon.com, Inc. | 0.27 | -3.86 | 59.04 | -3.78 | 4.1447 | -0.4131 | |||
| NVDA / NVIDIA Corporation | 0.30 | -2.35 | 56.22 | 15.32 | 3.9469 | 0.3255 | |||
| GOOG / Alphabet Inc. | 0.20 | -1.10 | 47.63 | 35.78 | 3.3437 | 0.7382 | |||
| JNJ / Johnson & Johnson | 0.25 | -0.41 | 46.97 | 20.89 | 3.2975 | 0.4115 | |||
| V / Visa Inc. | 0.14 | -2.66 | 46.72 | -6.41 | 3.2798 | -0.4281 | |||
| AMAT / Applied Materials, Inc. | 0.22 | 1.08 | 45.70 | 13.04 | 3.2082 | 0.2053 | |||
| RTX / RTX Corporation | 0.27 | -4.42 | 45.67 | 9.53 | 3.2061 | 0.1090 | |||
| TJX / The TJX Companies, Inc. | 0.31 | -5.60 | 45.32 | 10.49 | 3.1814 | 0.1350 | |||
| NOW / ServiceNow, Inc. | 0.05 | -2.05 | 44.06 | -12.32 | 3.0933 | -0.6395 | |||
| MMC / Marsh & McLennan Companies, Inc. | 0.21 | 2.07 | 41.41 | -5.92 | 2.9068 | -0.3624 | |||
| PG / The Procter & Gamble Company | 0.26 | 0.54 | 40.09 | -3.04 | 2.8141 | -0.2568 | |||
| ECL / Ecolab Inc. | 0.14 | -1.57 | 38.91 | 0.04 | 2.7316 | -0.1575 | |||
| PANW / Palo Alto Networks, Inc. | 0.19 | 4.64 | 38.71 | 4.12 | 2.7176 | -0.0441 | |||
| NEE / NextEra Energy, Inc. | 0.48 | -6.09 | 35.91 | 2.12 | 2.5208 | -0.0910 | |||
| TXN / Texas Instruments Incorporated | 0.19 | -1.67 | 35.72 | -12.98 | 2.5077 | -0.5414 | |||
| JPM / JPMorgan Chase & Co. | 0.10 | -2.01 | 30.97 | 6.61 | 2.1743 | 0.0164 | |||
| CVX / Chevron Corporation | 0.19 | 0.29 | 29.83 | 8.76 | 2.0941 | 0.0569 | |||
| BDX / Becton, Dickinson and Company | 0.16 | 4.70 | 29.61 | 13.78 | 2.0784 | 0.1455 | |||
| MELI / MercadoLibre, Inc. | 0.01 | 4.16 | 29.59 | -6.87 | 2.0770 | -0.2826 | |||
| CARR / Carrier Global Corporation | 0.44 | 4.29 | 26.50 | -14.94 | 1.8605 | -0.4537 | |||
| ETN / Eaton Corporation plc | 0.07 | 82.07 | 25.40 | 90.87 | 1.7832 | 0.7947 | |||
| RJF / Raymond James Financial, Inc. | 0.14 | -8.29 | 24.96 | 3.20 | 1.7524 | -0.0442 | |||
| BRK.B / Berkshire Hathaway Inc. | 0.04 | -4.39 | 21.82 | -1.05 | 1.5318 | -0.1062 | |||
| TMO / Thermo Fisher Scientific Inc. | 0.04 | 9.51 | 20.82 | 31.00 | 1.4619 | 0.2811 | |||
| ACN / Accenture plc | 0.08 | -20.55 | 20.79 | -34.45 | 1.4592 | -0.8962 | |||
| AMGN / Amgen Inc. | 0.07 | -30.87 | 20.71 | -30.13 | 1.4536 | -0.7477 | |||
| UBER / Uber Technologies, Inc. | 0.17 | -4.49 | 16.37 | 0.29 | 1.1494 | -0.0632 | |||
| BSX / Boston Scientific Corporation | 0.16 | 15.87 | 1.1139 | 1.1139 | |||||
| VOO / Vanguard Index Funds - Vanguard S&P 500 ETF | 0.03 | 44.65 | 15.49 | 55.94 | 1.0875 | 0.3496 | |||
| TFC / Truist Financial Corporation | 0.31 | -1.46 | 14.12 | 4.80 | 0.9913 | -0.0095 | |||
| ORCL / Oracle Corporation | 0.05 | -12.52 | 13.33 | 12.53 | 0.9361 | 0.0559 | |||
| GOOGL / Alphabet Inc. | 0.05 | -5.93 | 12.61 | 29.78 | 0.8851 | 0.1634 | |||
| EFA / iShares Trust - iShares MSCI EAFE ETF | 0.11 | 62.09 | 10.53 | 69.32 | 0.7394 | 0.2773 | |||
| ODFL / Old Dominion Freight Line, Inc. | 0.07 | 267.59 | 9.99 | 218.83 | 0.7013 | 0.4686 | |||
| SPY / SPDR S&P 500 ETF | 0.01 | -0.13 | 8.04 | 7.69 | 0.5646 | 0.0098 | |||
| IWF / iShares Trust - iShares Russell 1000 Growth ETF | 0.02 | 12.68 | 7.69 | 24.31 | 0.5395 | 0.0803 | |||
| VIG / Vanguard Specialized Funds - Vanguard Dividend Appreciation ETF | 0.03 | 212.69 | 5.67 | 229.78 | 0.3980 | 0.2703 | |||
| FLRN / SPDR Series Trust - State Street SPDR Bloomberg Investment Grade Floating Rate ETF | 0.16 | 11.87 | 4.91 | 11.96 | 0.3450 | 0.0190 | |||
| HON / Honeywell International Inc. | 0.01 | -1.35 | 3.09 | -10.85 | 0.2171 | -0.0405 | |||
| KO / The Coca-Cola Company | 0.04 | -0.32 | 2.97 | -6.54 | 0.2088 | -0.0276 | |||
| SCHG / Schwab Strategic Trust - Schwab U.S. Large-Cap Growth ETF | 0.09 | 75.78 | 2.76 | 92.07 | 0.1940 | 0.0871 | |||
| HD / The Home Depot, Inc. | 0.01 | -6.28 | 2.73 | 3.60 | 0.1919 | -0.0041 | |||
| LOW / Lowe's Companies, Inc. | 0.01 | 0.00 | 2.39 | 13.27 | 0.1678 | 0.0111 | |||
| PEP / PepsiCo, Inc. | 0.02 | -8.19 | 2.36 | -2.36 | 0.1659 | -0.0138 | |||
| GS / The Goldman Sachs Group, Inc. | 0.00 | -1.03 | 2.31 | 11.35 | 0.1618 | 0.0081 | |||
| UNP / Union Pacific Corporation | 0.01 | -3.08 | 2.20 | -0.45 | 0.1541 | -0.0097 | |||
| XOM / Exxon Mobil Corporation | 0.02 | 0.00 | 2.17 | 4.58 | 0.1522 | -0.0018 | |||
| NFLX / Netflix, Inc. | 0.00 | 0.06 | 1.99 | -10.40 | 0.1398 | -0.0253 | |||
| BX / Blackstone Inc. | 0.01 | 0.00 | 1.98 | 14.26 | 0.1389 | 0.0102 | |||
| ABT / Abbott Laboratories | 0.01 | -1.16 | 1.89 | -2.68 | 0.1324 | -0.0115 | |||
| SCHV / Schwab Strategic Trust - Schwab U.S. Large-Cap Value ETF | 0.06 | 45.10 | 1.75 | 52.71 | 0.1227 | 0.0376 | |||
| BAC / Bank of America Corporation | 0.03 | -11.68 | 1.73 | -3.72 | 0.1217 | -0.0120 | |||
| VWO / Vanguard International Equity Index Funds - Vanguard FTSE Emerging Markets ETF | 0.03 | 1.65 | 0.1158 | 0.1158 | |||||
| MRK / Merck & Co., Inc. | 0.02 | 0.00 | 1.54 | 6.04 | 0.1084 | 0.0002 | |||
| NTRS / Northern Trust Corporation | 0.01 | 0.00 | 1.35 | 6.24 | 0.0945 | 0.0003 | |||
| GE / General Electric Company | 0.00 | 0.00 | 1.30 | 16.95 | 0.0915 | 0.0087 | |||
| AES / The AES Corporation | 0.09 | -2.78 | 1.15 | 21.67 | 0.0808 | 0.0105 | |||
| IBM / International Business Machines Corporation | 0.00 | 5.49 | 1.08 | 0.93 | 0.0762 | -0.0036 | |||
| IWB / iShares Trust - iShares Russell 1000 ETF | 0.00 | -0.04 | 1.01 | 7.57 | 0.0709 | 0.0012 | |||
| LLY / Eli Lilly and Company | 0.00 | -1.87 | 1.00 | -3.93 | 0.0704 | -0.0072 | |||
| AVGO / Broadcom Inc. | 0.00 | -1.73 | 0.94 | 17.54 | 0.0659 | 0.0066 | |||
| EMR / Emerson Electric Co. | 0.01 | 0.00 | 0.87 | -1.59 | 0.0608 | -0.0046 | |||
| CPRT / Copart, Inc. | 0.02 | 0.00 | 0.85 | -8.35 | 0.0594 | -0.0092 | |||
| AEP / American Electric Power Company, Inc. | 0.01 | 41.96 | 0.82 | 54.05 | 0.0574 | 0.0180 | |||
| GEHC / GE HealthCare Technologies Inc. | 0.01 | -91.63 | 0.77 | -91.52 | 0.0543 | -0.6227 | |||
| ABBV / AbbVie Inc. | 0.00 | -5.47 | 0.77 | 17.86 | 0.0542 | 0.0056 | |||
| DIS / The Walt Disney Company | 0.01 | -1.58 | 0.71 | -9.18 | 0.0500 | -0.0082 | |||
| PM / Philip Morris International Inc. | 0.00 | -2.33 | 0.68 | -13.06 | 0.0477 | -0.0103 | |||
| CAT / Caterpillar Inc. | 0.00 | -1.07 | 0.66 | 21.55 | 0.0464 | 0.0060 | |||
| DELL / Dell Technologies Inc. | 0.00 | -4.91 | 0.62 | 9.96 | 0.0434 | 0.0016 | |||
| NNI / Nelnet, Inc. | 0.00 | -4.07 | 0.60 | -0.66 | 0.0423 | -0.0028 | |||
| IVV / iShares Trust - iShares Core S&P 500 ETF | 0.00 | 2.28 | 0.60 | 10.28 | 0.0422 | 0.0017 | |||
| MCD / McDonald's Corporation | 0.00 | 0.00 | 0.58 | 3.96 | 0.0406 | -0.0007 | |||
| GEV / GE Vernova Inc. | 0.00 | 0.00 | 0.57 | 16.23 | 0.0402 | 0.0036 | |||
| MAR / Marriott International, Inc. | 0.00 | 0.00 | 0.56 | -4.77 | 0.0393 | -0.0043 | |||
| SPOT / Spotify Technology S.A. | 0.00 | -0.64 | 0.54 | -9.50 | 0.0381 | -0.0065 | |||
| GWW / W.W. Grainger, Inc. | 0.00 | 0.00 | 0.50 | -8.42 | 0.0351 | -0.0054 | |||
| MA / Mastercard Incorporated | 0.00 | 0.00 | 0.50 | 1.22 | 0.0349 | -0.0016 | |||
| OKTA / Okta, Inc. | 0.01 | 0.00 | 0.50 | -8.30 | 0.0349 | -0.0054 | |||
| VGK / Vanguard International Equity Index Funds - Vanguard FTSE Europe ETF | 0.01 | -6.15 | 0.49 | -3.38 | 0.0342 | -0.0032 | |||
| COST / Costco Wholesale Corporation | 0.00 | -1.02 | 0.45 | -7.61 | 0.0316 | -0.0045 | |||
| WMT / Walmart Inc. | 0.00 | -12.20 | 0.41 | -7.50 | 0.0286 | -0.0041 | |||
| MDY / SPDR S&P MidCap 400 ETF Trust | 0.00 | 0.00 | 0.38 | 5.21 | 0.0270 | -0.0002 | |||
| SCHA / Schwab Strategic Trust - Schwab U.S. Small-Cap ETF | 0.01 | 51.41 | 0.35 | 67.14 | 0.0247 | 0.0090 | |||
| MTD / Mettler-Toledo International Inc. | 0.00 | -21.13 | 0.34 | -17.75 | 0.0241 | -0.0068 | |||
| DOV / Dover Corporation | 0.00 | -2.39 | 0.34 | -11.23 | 0.0239 | -0.0046 | |||
| WFC / Wells Fargo & Company | 0.00 | -8.76 | 0.32 | -4.44 | 0.0227 | -0.0025 | |||
| SCHF / Schwab Strategic Trust - Schwab International Equity ETF | 0.01 | 0.00 | 0.32 | 5.59 | 0.0226 | -0.0001 | |||
| CRWD / CrowdStrike Holdings, Inc. | 0.00 | -14.29 | 0.29 | -17.42 | 0.0207 | -0.0058 | |||
| ADP / Automatic Data Processing, Inc. | 0.00 | 0.00 | 0.29 | -4.89 | 0.0205 | -0.0023 | |||
| SHEL / Shell plc - Depositary Receipt (Common Stock) | 0.00 | 0.00 | 0.29 | 1.79 | 0.0200 | -0.0008 | |||
| CNMD / CONMED Corporation | 0.01 | 31.02 | 0.28 | 18.53 | 0.0193 | 0.0020 | |||
| CMG / Chipotle Mexican Grill, Inc. | 0.01 | -75.79 | 0.27 | -83.15 | 0.0193 | -0.1015 | |||
| TSLA / Tesla, Inc. | 0.00 | -7.92 | 0.26 | 29.00 | 0.0181 | 0.0033 | |||
| SAP / SAP SE - Depositary Receipt (Common Stock) | 0.00 | 0.00 | 0.26 | -12.07 | 0.0179 | -0.0037 | |||
| CRVS / Corvus Pharmaceuticals, Inc. | 0.03 | 0.00 | 0.24 | 84.62 | 0.0169 | 0.0072 | |||
| QXO / QXO, Inc. | 0.01 | 0.23 | 0.0163 | 0.0163 | |||||
| CSCO / Cisco Systems, Inc. | 0.00 | 0.00 | 0.23 | -1.28 | 0.0163 | -0.0012 | |||
| SCHW / The Charles Schwab Corporation | 0.00 | 9.09 | 0.23 | 14.50 | 0.0161 | 0.0012 | |||
| DE / Deere & Company | 0.00 | 0.00 | 0.22 | -10.33 | 0.0153 | -0.0027 | |||
| STE / STERIS plc | 0.00 | 0.00 | 0.22 | 2.86 | 0.0152 | -0.0004 | |||
| CTVA / Corteva, Inc. | 0.00 | 0.00 | 0.21 | -9.05 | 0.0148 | -0.0025 | |||
| HBAN / Huntington Bancshares Incorporated | 0.01 | 0.00 | 0.17 | 2.99 | 0.0121 | -0.0003 | |||
| STLA / Stellantis N.V. | 0.01 | 0.13 | 0.0090 | 0.0090 | |||||
| IVW / iShares Trust - iShares S&P 500 Growth ETF | 0.00 | -100.00 | 0.00 | 0.0000 | |||||
| DGX / Quest Diagnostics Incorporated | 0.00 | -100.00 | 0.00 | 0.0000 | |||||
| DKNG / DraftKings Inc. | 0.00 | -100.00 | 0.00 | -100.00 | -0.0192 | ||||
| ZS / Zscaler, Inc. | 0.00 | -100.00 | 0.00 | -100.00 | -0.0169 |