Estatísticas Básicas
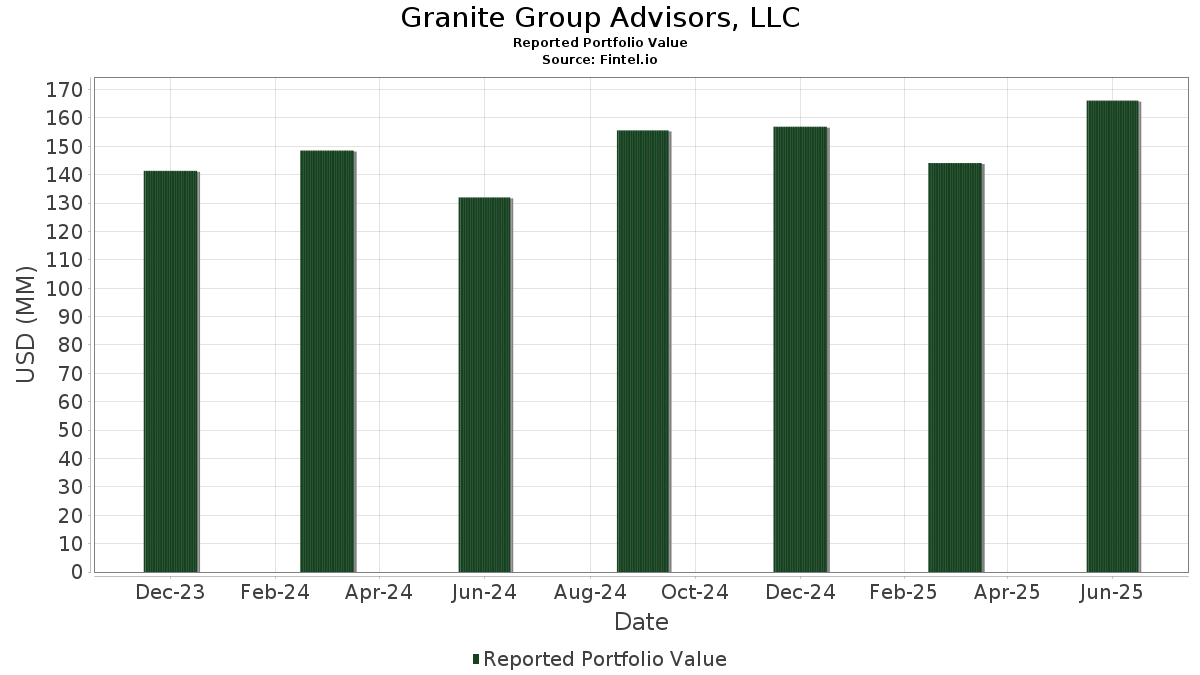
| Valor do Portfólio | $ 165,133,759 |
| Posições Atuais | 79 |
Últimas Participações, Desempenho, AUM (de 13F, 13D)
Granite Group Advisors, LLC divulgou 79 participações totais em seus últimos arquivamentos da SEC. O valor mais recente da carteira é calculado como $ 165,133,759 USD. O Ativo Total Sob Gestão (AUM) é esse valor mais o caixa (que não é divulgado). As principais posições de Granite Group Advisors, LLC são The Walt Disney Company (US:DIS) , Microsoft Corporation (US:MSFT) , Apple Inc. (US:AAPL) , JPMorgan Chase & Co. (US:JPM) , and The PNC Financial Services Group, Inc. (US:PNC) . As novas posições de Granite Group Advisors, LLC incluem Lockheed Martin Corporation (US:LMT) , Tyson Foods, Inc. (US:TSN) , Constellation Brands, Inc. (US:STZ) , Seagate Technology Holdings plc (US:STX) , and TC Energy Corporation (MX:TRP N) .
Maiores Aumentos Este Trimestre
Usamos a mudança na alocação do portfólio porque esta é a métrica mais significativa. As mudanças podem ser devido a operações ou mudanças nos preços das ações.
| Ativo | Ações (MM) |
Valor (MM$) |
% do Portfólio | Δ% do Portfólio |
|---|---|---|---|---|
| 0.00 | 1.59 | 0.9638 | 0.9638 | |
| 0.02 | 1.10 | 0.6687 | 0.6687 | |
| 0.02 | 4.06 | 2.4576 | 0.5590 | |
| 0.01 | 0.76 | 0.4591 | 0.4591 | |
| 0.01 | 2.30 | 1.3932 | 0.3911 | |
| 0.01 | 6.79 | 4.1126 | 0.2360 | |
| 0.02 | 2.89 | 1.7501 | 0.2087 | |
| 0.00 | 0.31 | 0.1871 | 0.1871 | |
| 0.04 | 2.90 | 1.7551 | 0.1850 | |
| 0.02 | 2.83 | 1.7154 | 0.1786 |
Maiores Diminuições Este Trimestre
Usamos a mudança na alocação do portfólio porque esta é a métrica mais significativa. As mudanças podem ser devido a operações ou mudanças nos preços das ações.
| Ativo | Ações (MM) |
Valor (MM$) |
% do Portfólio | Δ% do Portfólio |
|---|---|---|---|---|
| 0.68 | 77.36 | 46.8484 | -3.5847 | |
| 0.02 | 2.79 | 1.6872 | -0.3614 | |
| 0.01 | 2.57 | 1.5591 | -0.1911 | |
| 0.00 | 0.25 | 0.1503 | -0.1310 | |
| 0.00 | 0.00 | -0.1272 | ||
| 0.01 | 0.76 | 0.4595 | -0.1026 | |
| 0.06 | 1.95 | 1.1783 | -0.0733 | |
| 0.01 | 0.53 | 0.3211 | -0.0480 | |
| 0.03 | 1.20 | 0.7245 | -0.0429 | |
| 0.00 | 1.51 | 0.9121 | -0.0399 |
Arquivamentos 13F e Fundo
Este formulário foi arquivado em 2025-10-23 para o período de relatório 2025-09-30. Clique no ícone de link para ver o histórico completo da transação.
Atualize para desbloquear dados premium e exportar para Excel ![]() .
.
| Ativo | Tipo | Preço Médio por Ação | Ações (MM) |
ΔAções (%) |
Valor ($MM) |
ΔAções (%) |
Portfólio (%) |
ΔPortfólio (%) |
|
|---|---|---|---|---|---|---|---|---|---|
| DIS / The Walt Disney Company | 0.68 | 0.00 | 77.36 | -7.67 | 46.8484 | -3.5847 | |||
| MSFT / Microsoft Corporation | 0.01 | 1.27 | 6.79 | 5.45 | 4.1126 | 0.2360 | |||
| AAPL / Apple Inc. | 0.02 | 3.67 | 4.06 | 28.66 | 2.4576 | 0.5590 | |||
| JPM / JPMorgan Chase & Co. | 0.01 | 0.33 | 3.25 | 9.20 | 1.9699 | 0.1762 | |||
| PNC / The PNC Financial Services Group, Inc. | 0.02 | -0.03 | 3.13 | 7.76 | 1.8935 | 0.1469 | |||
| AEP / American Electric Power Company, Inc. | 0.03 | -0.09 | 2.99 | 8.33 | 1.8122 | 0.1493 | |||
| NEE / NextEra Energy, Inc. | 0.04 | 2.18 | 2.90 | 11.12 | 1.7551 | 0.1850 | |||
| MS / Morgan Stanley | 0.02 | 0.01 | 2.89 | 12.89 | 1.7501 | 0.2087 | |||
| QCOM / QUALCOMM Incorporated | 0.02 | 6.21 | 2.83 | 10.93 | 1.7154 | 0.1786 | |||
| PEP / PepsiCo, Inc. | 0.02 | -23.04 | 2.79 | -18.13 | 1.6872 | -0.3614 | |||
| USB / U.S. Bancorp | 0.06 | -0.08 | 2.72 | 6.70 | 1.6501 | 0.1133 | |||
| MDT / Medtronic plc | 0.03 | 0.02 | 2.71 | 9.27 | 1.6414 | 0.1485 | |||
| HD / The Home Depot, Inc. | 0.01 | 0.18 | 2.65 | 10.74 | 1.6055 | 0.1642 | |||
| SBUX / Starbucks Corporation | 0.03 | 7.20 | 2.64 | -1.01 | 1.5996 | -0.0068 | |||
| AMGN / Amgen Inc. | 0.01 | 0.44 | 2.59 | 1.53 | 1.5684 | 0.0327 | |||
| TXN / Texas Instruments Incorporated | 0.01 | 0.06 | 2.57 | -11.46 | 1.5591 | -0.1911 | |||
| MTB / M&T Bank Corporation | 0.01 | 0.22 | 2.32 | 2.12 | 1.4028 | 0.0371 | |||
| GOOGL / Alphabet Inc. | 0.01 | 0.18 | 2.30 | 38.22 | 1.3932 | 0.3911 | |||
| TGT / Target Corporation | 0.03 | 8.41 | 2.26 | -1.44 | 1.3714 | -0.0115 | |||
| BK / The Bank of New York Mellon Corporation | 0.02 | -5.36 | 2.19 | 13.21 | 1.3287 | 0.1619 | |||
| CMCSA / Comcast Corporation | 0.06 | 6.29 | 1.95 | -6.45 | 1.1783 | -0.0733 | |||
| LMT / Lockheed Martin Corporation | 0.00 | 1.59 | 0.9638 | 0.9638 | |||||
| AMZN / Amazon.com, Inc. | 0.01 | -0.46 | 1.58 | -0.32 | 0.9556 | 0.0022 | |||
| GD / General Dynamics Corporation | 0.00 | -18.55 | 1.51 | -4.74 | 0.9121 | -0.0399 | |||
| META / Meta Platforms, Inc. | 0.00 | 2.77 | 1.28 | 2.24 | 0.7747 | 0.0217 | |||
| AMLP / ALPS ETF Trust - Alerian MLP ETF | 0.03 | -2.30 | 1.20 | -6.12 | 0.7245 | -0.0429 | |||
| TSN / Tyson Foods, Inc. | 0.02 | 1.10 | 0.6687 | 0.6687 | |||||
| NVDA / NVIDIA Corporation | 0.01 | 2.01 | 0.98 | 20.47 | 0.5919 | 0.1035 | |||
| ABBV / AbbVie Inc. | 0.00 | 0.20 | 0.91 | 25.00 | 0.5485 | 0.1123 | |||
| ORCL / Oracle Corporation | 0.00 | 0.15 | 0.77 | 28.91 | 0.4649 | 0.1062 | |||
| CSCO / Cisco Systems, Inc. | 0.01 | -17.60 | 0.76 | -18.76 | 0.4595 | -0.1026 | |||
| STZ / Constellation Brands, Inc. | 0.01 | 0.76 | 0.4591 | 0.4591 | |||||
| TSM / Taiwan Semiconductor Manufacturing Company Limited - Depositary Receipt (Common Stock) | 0.00 | 0.00 | 0.72 | 23.28 | 0.4331 | 0.0840 | |||
| SE / Sea Limited - Depositary Receipt (Common Stock) | 0.00 | 0.00 | 0.66 | 11.77 | 0.3969 | 0.0439 | |||
| AVGO / Broadcom Inc. | 0.00 | -1.05 | 0.62 | 18.48 | 0.3772 | 0.0606 | |||
| PM / Philip Morris International Inc. | 0.00 | 8.96 | 0.59 | -2.96 | 0.3584 | -0.0087 | |||
| WMB / The Williams Companies, Inc. | 0.01 | 0.00 | 0.56 | 0.90 | 0.3380 | 0.0049 | |||
| IWS / iShares Trust - iShares Russell Mid-Cap Value ETF | 0.00 | 0.00 | 0.53 | 5.58 | 0.3214 | 0.0192 | |||
| MPLX / MPLX LP - Limited Partnership | 0.01 | -10.82 | 0.53 | -13.54 | 0.3211 | -0.0480 | |||
| SPOT / Spotify Technology S.A. | 0.00 | 2.58 | 0.53 | -6.73 | 0.3196 | -0.0208 | |||
| BRK.B / Berkshire Hathaway Inc. | 0.00 | 0.58 | 0.52 | 4.19 | 0.3163 | 0.0143 | |||
| IWF / iShares Trust - iShares Russell 1000 Growth ETF | 0.00 | 0.00 | 0.50 | 10.33 | 0.3044 | 0.0302 | |||
| XOM / Exxon Mobil Corporation | 0.00 | 22.17 | 0.45 | 27.56 | 0.2724 | 0.0605 | |||
| PKB / Invesco Exchange-Traded Fund Trust - Invesco Building & Construction ETF | 0.00 | 53.38 | 0.43 | 60.45 | 0.2608 | 0.0989 | |||
| ASML / ASML Holding N.V. - Depositary Receipt (Common Stock) | 0.00 | 19.09 | 0.43 | 43.62 | 0.2597 | 0.0803 | |||
| PSX / Phillips 66 | 0.00 | 1.94 | 0.43 | 16.30 | 0.2592 | 0.0375 | |||
| OKE / ONEOK, Inc. | 0.01 | 3.73 | 0.41 | -7.21 | 0.2495 | -0.0180 | |||
| GOOG / Alphabet Inc. | 0.00 | -4.74 | 0.40 | 31.05 | 0.2429 | 0.0583 | |||
| SAP / SAP SE - Depositary Receipt (Common Stock) | 0.00 | 0.00 | 0.38 | -12.18 | 0.2319 | -0.0304 | |||
| COST / Costco Wholesale Corporation | 0.00 | -0.50 | 0.37 | -6.84 | 0.2231 | -0.0153 | |||
| NOW / ServiceNow, Inc. | 0.00 | 1.55 | 0.36 | -9.05 | 0.2196 | -0.0205 | |||
| ANET / Arista Networks Inc | 0.00 | 0.04 | 0.35 | 42.45 | 0.2119 | 0.0641 | |||
| CPNG / Coupang, Inc. | 0.01 | 0.00 | 0.34 | 7.57 | 0.2068 | 0.0155 | |||
| LIN / Linde plc | 0.00 | 0.87 | 0.33 | 2.18 | 0.1991 | 0.0053 | |||
| STX / Seagate Technology Holdings plc | 0.00 | 0.31 | 0.1871 | 0.1871 | |||||
| ENB / Enbridge Inc. | 0.01 | 0.00 | 0.31 | 11.19 | 0.1870 | 0.0201 | |||
| EPD / Enterprise Products Partners L.P. - Limited Partnership | 0.01 | 2.63 | 0.31 | 3.72 | 0.1860 | 0.0074 | |||
| ORLY / O'Reilly Automotive, Inc. | 0.00 | 0.14 | 0.30 | 19.92 | 0.1824 | 0.0311 | |||
| ACGL / Arch Capital Group Ltd. | 0.00 | 0.00 | 0.27 | 0.00 | 0.1659 | 0.0004 | |||
| CQP / Cheniere Energy Partners, L.P. - Limited Partnership | 0.01 | 2.60 | 0.27 | -1.45 | 0.1648 | -0.0015 | |||
| ET / Energy Transfer LP - Limited Partnership | 0.02 | 2.67 | 0.27 | -2.87 | 0.1643 | -0.0038 | |||
| FANG / Diamondback Energy, Inc. | 0.00 | 0.00 | 0.27 | 4.26 | 0.1630 | 0.0074 | |||
| CP / Canadian Pacific Kansas City Limited | 0.00 | 0.00 | 0.27 | -6.01 | 0.1615 | -0.0093 | |||
| PBA / Pembina Pipeline Corporation | 0.01 | 2.58 | 0.27 | 10.88 | 0.1606 | 0.0163 | |||
| UBS / UBS Group AG | 0.01 | 0.00 | 0.26 | 21.20 | 0.1598 | 0.0288 | |||
| PWR / Quanta Services, Inc. | 0.00 | 0.00 | 0.26 | 9.58 | 0.1594 | 0.0149 | |||
| NFLX / Netflix, Inc. | 0.00 | -40.69 | 0.25 | -46.90 | 0.1503 | -0.1310 | |||
| NU / Nu Holdings Ltd. | 0.02 | 0.00 | 0.25 | 17.06 | 0.1496 | 0.0222 | |||
| AON / Aon plc | 0.00 | 0.00 | 0.25 | 0.00 | 0.1488 | 0.0008 | |||
| PH / Parker-Hannifin Corporation | 0.00 | 1.90 | 0.24 | 10.91 | 0.1478 | 0.0150 | |||
| MELI / MercadoLibre, Inc. | 0.00 | -4.63 | 0.24 | -14.89 | 0.1458 | -0.0241 | |||
| HESM / Hess Midstream LP | 0.01 | 2.78 | 0.24 | -7.72 | 0.1447 | -0.0113 | |||
| LLY / Eli Lilly and Company | 0.00 | 1.00 | 0.23 | -1.29 | 0.1395 | -0.0008 | |||
| IBN / ICICI Bank Limited - Depositary Receipt (Common Stock) | 0.01 | 0.00 | 0.22 | -10.08 | 0.1352 | -0.0143 | |||
| AZN / AstraZeneca PLC - Depositary Receipt (Common Stock) | 0.00 | 0.22 | 0.1329 | 0.1329 | |||||
| TRP N / TC Energy Corporation | 0.00 | 0.22 | 0.1324 | 0.1324 | |||||
| AIQ / Global X Funds - Global X Artificial Intelligence & Technology ETF | 0.00 | -8.33 | 0.22 | 3.83 | 0.1316 | 0.0054 | |||
| RACE / Ferrari N.V. | 0.00 | 0.00 | 0.21 | -0.93 | 0.1299 | -0.0007 | |||
| ISRG / Intuitive Surgical, Inc. | 0.00 | 3.43 | 0.20 | -14.77 | 0.1224 | -0.0205 | |||
| CRM / Salesforce, Inc. | 0.00 | -100.00 | 0.00 | 0.0000 | |||||
| MNDY / monday.com Ltd. | 0.00 | -100.00 | 0.00 | 0.0000 | |||||
| MA / Mastercard Incorporated | 0.00 | -100.00 | 0.00 | -100.00 | -0.1272 | ||||
| UNP / Union Pacific Corporation | 0.00 | -100.00 | 0.00 | 0.0000 |