Estatísticas Básicas
| Valor do Portfólio | $ 169,259,022 |
| Posições Atuais | 61 |
Últimas Participações, Desempenho, AUM (de 13F, 13D)
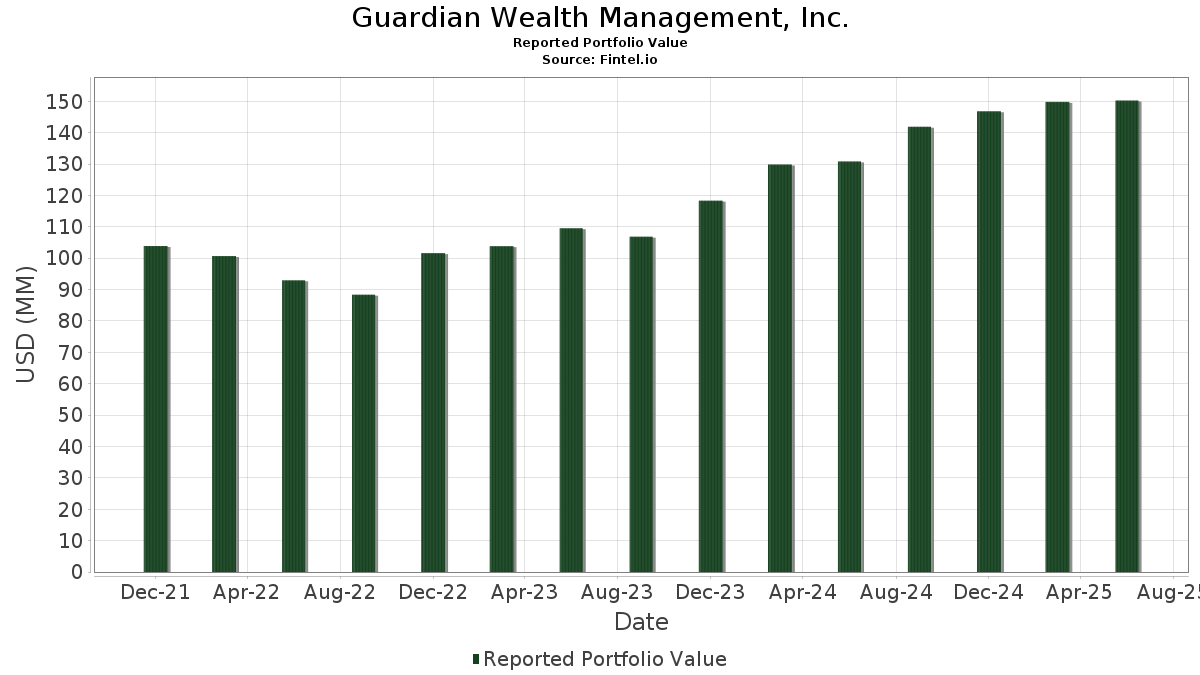
Guardian Wealth Management, Inc. divulgou 61 participações totais em seus últimos arquivamentos da SEC. O valor mais recente da carteira é calculado como $ 169,259,022 USD. O Ativo Total Sob Gestão (AUM) é esse valor mais o caixa (que não é divulgado). As principais posições de Guardian Wealth Management, Inc. são Sterling Infrastructure, Inc. (US:STRL) , Arista Networks, Inc. (US:ANET) , AutoZone, Inc. (US:AZO) , AbbVie Inc. (US:ABBV) , and Nelnet, Inc. (US:NNI) . As novas posições de Guardian Wealth Management, Inc. incluem Viper Energy, Inc. (US:VNOM) , .
Maiores Aumentos Este Trimestre
Usamos a mudança na alocação do portfólio porque esta é a métrica mais significativa. As mudanças podem ser devido a operações ou mudanças nos preços das ações.
| Ativo | Ações (MM) |
Valor (MM$) |
% do Portfólio | Δ% do Portfólio |
|---|---|---|---|---|
| 0.13 | 5.12 | 3.0230 | 3.0230 | |
| 0.00 | 3.64 | 2.1488 | 2.1488 | |
| 0.04 | 3.00 | 1.7729 | 1.7729 | |
| 0.07 | 9.98 | 5.8976 | 1.2555 | |
| 0.16 | 4.86 | 2.8725 | 0.8532 | |
| 0.36 | 3.87 | 2.2861 | 0.6478 | |
| 0.03 | 6.98 | 4.1215 | 0.4889 | |
| 0.06 | 1.12 | 0.6634 | 0.2268 | |
| 0.03 | 3.84 | 2.2688 | 0.2146 | |
| 0.00 | 8.61 | 5.0846 | 0.2062 |
Maiores Diminuições Este Trimestre
Usamos a mudança na alocação do portfólio porque esta é a métrica mais significativa. As mudanças podem ser devido a operações ou mudanças nos preços das ações.
| Ativo | Ações (MM) |
Valor (MM$) |
% do Portfólio | Δ% do Portfólio |
|---|---|---|---|---|
| 0.03 | 11.55 | 6.8219 | -0.9678 | |
| 0.05 | 6.02 | 3.5557 | -0.5553 | |
| 0.14 | 4.63 | 2.7373 | -0.4696 | |
| 0.01 | 5.45 | 3.2191 | -0.4326 | |
| 0.03 | 4.06 | 2.3986 | -0.4044 | |
| 0.11 | 2.73 | 1.6130 | -0.3621 | |
| 0.03 | 3.74 | 2.2096 | -0.3076 | |
| 0.02 | 3.37 | 1.9907 | -0.3003 | |
| 0.24 | 1.96 | 1.1606 | -0.2387 | |
| 0.02 | 2.52 | 1.4912 | -0.2181 |
Arquivamentos 13F e Fundo
Este formulário foi arquivado em 2025-11-14 para o período de relatório 2025-09-30. Clique no ícone de link para ver o histórico completo da transação.
Atualize para desbloquear dados premium e exportar para Excel ![]() .
.
| Ativo | Tipo | Preço Médio por Ação | Ações (MM) |
ΔAções (%) |
Valor ($MM) |
ΔAções (%) |
Portfólio (%) |
ΔPortfólio (%) |
|
|---|---|---|---|---|---|---|---|---|---|
| STRL / Sterling Infrastructure, Inc. | 0.03 | -32.97 | 11.55 | -1.32 | 6.8219 | -0.9678 | |||
| ANET / Arista Networks, Inc. | 0.07 | 0.52 | 9.98 | 43.15 | 5.8976 | 1.2555 | |||
| AZO / AutoZone, Inc. | 0.00 | 1.62 | 8.61 | 17.46 | 5.0846 | 0.2062 | |||
| ABBV / AbbVie Inc. | 0.03 | 2.49 | 6.98 | 27.84 | 4.1215 | 0.4889 | |||
| NNI / Nelnet, Inc. | 0.05 | 3.73 | 6.21 | 7.37 | 3.6665 | -0.1812 | |||
| APO / Apollo Global Management, Inc. | 0.05 | 3.75 | 6.02 | -2.54 | 3.5557 | -0.5553 | |||
| LLY / Eli Lilly and Company | 0.01 | 1.48 | 5.45 | -0.67 | 3.2191 | -0.4326 | |||
| VNOM / Viper Energy, Inc. | 0.13 | 5.12 | 3.0230 | 3.0230 | |||||
| SSNC / SS&C Technologies Holdings, Inc. | 0.06 | 2.67 | 5.10 | 10.05 | 3.0159 | -0.0719 | |||
| OXY / Occidental Petroleum Corporation | 0.11 | 1.26 | 4.98 | 13.91 | 2.9425 | 0.0314 | |||
| LKQ / LKQ Corporation | 0.16 | 94.25 | 4.86 | 60.27 | 2.8725 | 0.8532 | |||
| UTI / Universal Technical Institute, Inc. | 0.14 | 0.14 | 4.63 | -3.82 | 2.7373 | -0.4696 | |||
| BN / Brookfield Corporation | 0.06 | 0.60 | 4.23 | 11.56 | 2.4982 | -0.0253 | |||
| KKR / KKR & Co. Inc. | 0.03 | -1.29 | 4.06 | -3.59 | 2.3986 | -0.4044 | |||
| PX / P10, Inc. | 0.36 | 47.70 | 3.87 | 57.28 | 2.2861 | 0.6478 | |||
| NICE / NICE Ltd. - Depositary Receipt (Common Stock) | 0.03 | 45.19 | 3.84 | 24.47 | 2.2688 | 0.2146 | |||
| ABT / Abbott Laboratories | 0.03 | 0.44 | 3.74 | -1.08 | 2.2096 | -0.3076 | |||
| ASML / ASML Holding N.V. - Depositary Receipt (Common Stock) | 0.00 | 3.64 | 2.1488 | 2.1488 | |||||
| AYI / Acuity Inc. | 0.01 | 3.50 | 3.38 | 19.48 | 1.9964 | 0.1134 | |||
| WM / Waste Management, Inc. | 0.02 | 1.46 | 3.37 | -2.09 | 1.9907 | -0.3003 | |||
| COP / ConocoPhillips | 0.03 | 5.06 | 3.07 | 10.75 | 1.8138 | -0.0318 | |||
| NPK / National Presto Industries, Inc. | 0.03 | 3.32 | 3.06 | 18.30 | 1.8063 | 0.0857 | |||
| VCSH / Vanguard Scottsdale Funds - Vanguard Short-Term Corporate Bond ETF | 0.04 | 18.33 | 3.00 | 18.99 | 1.7731 | 0.0938 | |||
| CASH / Pathward Financial, Inc. | 0.04 | 3.00 | 1.7729 | 1.7729 | |||||
| VCIT / Vanguard Scottsdale Funds - Vanguard Intermediate-Term Corporate Bond ETF | 0.03 | 20.46 | 2.84 | 22.22 | 1.6804 | 0.1308 | |||
| FRPH / FRP Holdings, Inc. | 0.11 | 1.58 | 2.73 | -7.96 | 1.6130 | -0.3621 | |||
| JNJ / Johnson & Johnson | 0.01 | 1.60 | 2.57 | 23.29 | 1.5171 | 0.1309 | |||
| OMC / Omnicom Group Inc. | 0.03 | 3.52 | 2.55 | 17.33 | 1.5085 | 0.0596 | |||
| GJR / Strats Trust For Procter & Gambel Security - Preferred Security | 0.02 | 1.93 | 2.52 | -1.71 | 1.4912 | -0.2181 | |||
| MA / Mastercard Incorporated | 0.00 | 0.93 | 2.47 | 2.19 | 1.4619 | -0.1502 | |||
| PEP / PepsiCo, Inc. | 0.02 | 1.48 | 2.27 | 7.96 | 1.3385 | -0.0587 | |||
| KMB / Kimberly-Clark Corporation | 0.02 | 2.15 | 2.06 | -1.49 | 1.2144 | -0.1744 | |||
| GPN / Global Payments Inc. | 0.02 | 1.18 | 1.99 | 5.06 | 1.1770 | -0.0858 | |||
| AMCR / Amcor plc | 0.24 | 5.00 | 1.96 | -6.52 | 1.1606 | -0.2387 | |||
| STAG / STAG Industrial, Inc. | 0.05 | 3.74 | 1.83 | 0.88 | 1.0793 | -0.1259 | |||
| UL / Unilever PLC - Depositary Receipt (Common Stock) | 0.03 | 2.70 | 1.78 | -0.50 | 1.0538 | -0.1393 | |||
| LH / Labcorp Holdings Inc. | 0.01 | -0.27 | 1.78 | 9.00 | 1.0520 | -0.0351 | |||
| MMM / 3M Company | 0.01 | 1.50 | 1.60 | 3.44 | 0.9426 | -0.0840 | |||
| SCHB / Schwab Strategic Trust - Schwab U.S. Broad Market ETF | 0.06 | -2.75 | 1.47 | 4.94 | 0.8659 | -0.0641 | |||
| DIS / The Walt Disney Company | 0.01 | 1.26 | 1.45 | -6.50 | 0.8591 | -0.1763 | |||
| LMT / Lockheed Martin Corporation | 0.00 | -1.46 | 1.42 | 6.30 | 0.8378 | -0.0508 | |||
| SCHD / Schwab Strategic Trust - Schwab U.S. Dividend Equity ETF | 0.05 | -4.23 | 1.35 | -1.32 | 0.7972 | -0.1133 | |||
| AAPL / Apple Inc. | 0.01 | 0.08 | 1.30 | 24.21 | 0.7700 | 0.0715 | |||
| WBD / Warner Bros. Discovery, Inc. | 0.06 | 0.46 | 1.12 | 71.30 | 0.6634 | 0.2268 | |||
| CAT / Caterpillar Inc. | 0.00 | -0.17 | 1.10 | 22.63 | 0.6504 | 0.0531 | |||
| PINE / Alpine Income Property Trust, Inc. | 0.07 | 9.06 | 0.92 | 5.02 | 0.5444 | -0.0395 | |||
| SIRI / Sirius XM Holdings Inc. | 0.03 | 4.16 | 0.79 | 5.50 | 0.4652 | -0.0315 | |||
| BR / Broadridge Financial Solutions, Inc. | 0.00 | -0.53 | 0.76 | -2.44 | 0.4485 | -0.0700 | |||
| NWN / Northwest Natural Holding Company | 0.02 | 8.67 | 0.75 | 22.95 | 0.4433 | 0.0369 | |||
| MSFT / Microsoft Corporation | 0.00 | 0.08 | 0.65 | 4.20 | 0.3812 | -0.0311 | |||
| PSX / Phillips 66 | 0.00 | -1.41 | 0.61 | 12.36 | 0.3601 | -0.0009 | |||
| VBR / Vanguard Index Funds - Vanguard Small-Cap Value ETF | 0.00 | 1.46 | 0.52 | 8.52 | 0.3088 | -0.0116 | |||
| PLTR / Palantir Technologies Inc. | 0.00 | 0.00 | 0.45 | 34.03 | 0.2653 | 0.0419 | |||
| NVDD / Direxion Shares ETF Trust - Direxion Daily NVDA Bear 1X Shares | 0.00 | 0.05 | 0.36 | 18.18 | 0.2151 | 0.0100 | |||
| GRMN / Garmin Ltd. | 0.00 | 0.00 | 0.36 | 18.27 | 0.2104 | 0.0095 | |||
| AZN / AstraZeneca PLC - Depositary Receipt (Common Stock) | 0.00 | 0.08 | 0.30 | 9.89 | 0.1773 | -0.0045 | |||
| VOOV / Vanguard Admiral Funds - Vanguard S&P 500 Value ETF | 0.00 | 0.24 | 0.25 | 5.93 | 0.1480 | -0.0093 | |||
| JPM / JPMorgan Chase & Co. | 0.00 | 0.21 | 0.1250 | 0.1250 | |||||
| DE / Deere & Company | 0.00 | 0.00 | 0.21 | -10.00 | 0.1226 | -0.0310 | |||
| BSM / Black Stone Minerals, L.P. - Limited Partnership | 0.01 | 1.95 | 0.16 | 1.90 | 0.0956 | -0.0096 | |||
| MNDO / MIND C.T.I. Ltd | 0.05 | 0.00 | 0.06 | -20.00 | 0.0335 | -0.0135 | |||
| TXN / Texas Instruments Incorporated | 0.00 | -100.00 | 0.00 | 0.0000 | |||||
| DLTH / Duluth Holdings Inc. | 0.00 | -100.00 | 0.00 | 0.0000 | |||||
| STR / Sitio Royalties Corp. | 0.00 | -100.00 | 0.00 | 0.0000 | |||||
| RVTY / Revvity, Inc. | 0.00 | -100.00 | 0.00 | 0.0000 |