Estatísticas Básicas
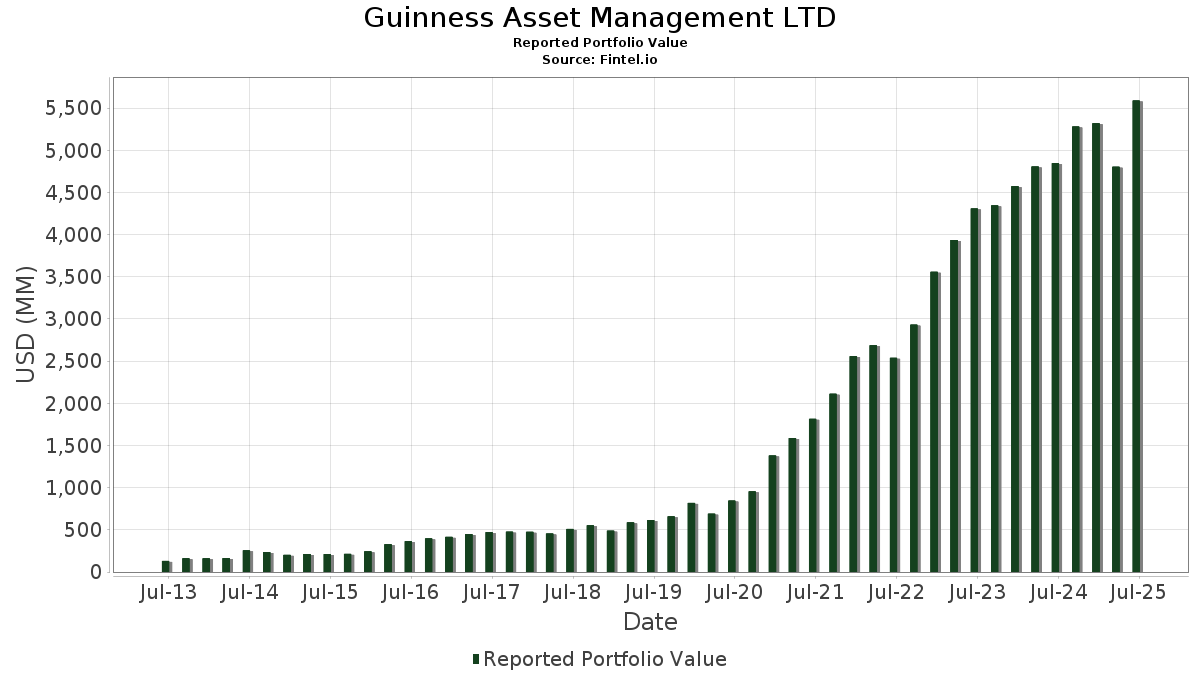
| Valor do Portfólio | $ 6,276,803,144 |
| Posições Atuais | 127 |
Últimas Participações, Desempenho, AUM (de 13F, 13D)
Guinness Asset Management LTD divulgou 127 participações totais em seus últimos arquivamentos da SEC. O valor mais recente da carteira é calculado como $ 6,276,803,144 USD. O Ativo Total Sob Gestão (AUM) é esse valor mais o caixa (que não é divulgado). As principais posições de Guinness Asset Management LTD são Broadcom Inc. (US:AVGO) , Microsoft Corporation (US:MSFT) , CME Group Inc. (US:CME) , Medtronic plc (US:MDT) , and AbbVie Inc. (US:ABBV) . As novas posições de Guinness Asset Management LTD incluem Medtronic plc (US:MDT) , Eaton Corporation plc (US:ETN) , Trane Technologies plc (US:TT) , Aptiv PLC (US:APTV) , and NXP Semiconductors N.V. (US:NXPI) .
Maiores Aumentos Este Trimestre
Usamos a mudança na alocação do portfólio porque esta é a métrica mais significativa. As mudanças podem ser devido a operações ou mudanças nos preços das ações.
| Ativo | Ações (MM) |
Valor (MM$) |
% do Portfólio | Δ% do Portfólio |
|---|---|---|---|---|
| 2.93 | 275.56 | 4.3901 | 4.3901 | |
| 0.66 | 241.23 | 3.8432 | 3.8432 | |
| 1.59 | 222.25 | 3.5408 | 0.6534 | |
| 1.21 | 270.09 | 4.3030 | 0.2998 | |
| 1.38 | 251.22 | 4.0023 | 0.2381 | |
| 0.03 | 13.83 | 0.2203 | 0.2203 | |
| 0.14 | 11.87 | 0.1891 | 0.1891 | |
| 1.51 | 231.18 | 3.6831 | 0.1662 | |
| 0.04 | 10.08 | 0.1606 | 0.1606 | |
| 3.81 | 238.84 | 3.8052 | 0.1481 |
Maiores Diminuições Este Trimestre
Usamos a mudança na alocação do portfólio porque esta é a métrica mais significativa. As mudanças podem ser devido a operações ou mudanças nos preços das ações.
| Ativo | Ações (MM) |
Valor (MM$) |
% do Portfólio | Δ% do Portfólio |
|---|---|---|---|---|
| 3.56 | 240.95 | 3.8387 | -1.6089 | |
| 1.64 | 210.26 | 3.3497 | -0.8927 | |
| 0.22 | 255.39 | 4.0688 | -0.8264 | |
| 1.01 | 185.39 | 2.9535 | -0.7854 | |
| 0.83 | 254.08 | 4.0480 | -0.7120 | |
| 3.20 | 211.03 | 3.3621 | -0.6691 | |
| 1.91 | 174.56 | 2.7810 | -0.6279 | |
| 1.02 | 278.37 | 4.4349 | -0.6107 | |
| 1.91 | 246.59 | 3.9285 | -0.6084 | |
| 0.55 | 282.77 | 4.5050 | -0.4073 |
Arquivamentos 13F e Fundo
Este formulário foi arquivado em 2025-11-05 para o período de relatório 2025-09-30. Clique no ícone de link para ver o histórico completo da transação.
Atualize para desbloquear dados premium e exportar para Excel ![]() .
.
| Ativo | Tipo | Preço Médio por Ação | Ações (MM) |
ΔAções (%) |
Valor ($MM) |
ΔAções (%) |
Portfólio (%) |
ΔPortfólio (%) |
|
|---|---|---|---|---|---|---|---|---|---|
| AVGO / Broadcom Inc. | 1.01 | -9.73 | 332.80 | 7.47 | 5.3021 | -0.2391 | |||
| MSFT / Microsoft Corporation | 0.55 | -0.44 | 282.77 | 3.00 | 4.5050 | -0.4073 | |||
| CME / CME Group Inc. | 1.02 | -0.06 | 278.37 | -1.28 | 4.4349 | -0.6107 | |||
| MDT / Medtronic plc | 2.93 | 275.56 | 4.3901 | 4.3901 | |||||
| ABBV / AbbVie Inc. | 1.21 | 0.35 | 270.09 | 20.73 | 4.3030 | 0.2998 | |||
| AFL / Aflac Incorporated | 2.37 | 0.02 | 264.23 | 5.61 | 4.2096 | -0.2671 | |||
| BLK / BlackRock, Inc. | 0.22 | -16.68 | 255.39 | -6.65 | 4.0688 | -0.8264 | |||
| AJG / Arthur J. Gallagher & Co. | 0.83 | -0.00 | 254.08 | -4.49 | 4.0480 | -0.7120 | |||
| JNJ / Johnson & Johnson | 1.38 | 0.44 | 251.22 | 19.42 | 4.0023 | 0.2381 | |||
| EMR / Emerson Electric Co. | 1.91 | 0.33 | 246.59 | -2.75 | 3.9285 | -0.6084 | |||
| ETN / Eaton Corporation plc | 0.66 | 241.23 | 3.8432 | 3.8432 | |||||
| CSCO / Cisco Systems, Inc. | 3.56 | -18.95 | 240.95 | -20.86 | 3.8387 | -1.6089 | |||
| MDLZ / Mondelez International, Inc. | 3.81 | 25.88 | 238.84 | 16.86 | 3.8052 | 0.1481 | |||
| GJR / Strats Trust For Procter & Gambel Security - Preferred Security | 1.51 | 22.09 | 231.18 | 17.62 | 3.6831 | 0.1662 | |||
| PEP / PepsiCo, Inc. | 1.59 | 29.71 | 222.25 | 37.73 | 3.5408 | 0.6534 | |||
| ITW / Illinois Tool Works Inc. | 0.84 | 0.42 | 219.19 | 6.14 | 3.4920 | -0.2033 | |||
| KO / The Coca-Cola Company | 3.20 | 0.34 | 211.03 | -6.33 | 3.3621 | -0.6691 | |||
| PAYX / Paychex, Inc. | 1.64 | 0.33 | 210.26 | -11.32 | 3.3497 | -0.8927 | |||
| TXN / Texas Instruments Incorporated | 1.01 | 0.53 | 185.39 | -11.28 | 2.9535 | -0.7854 | |||
| OTIS / Otis Worldwide Corporation | 1.91 | -0.67 | 174.56 | -8.37 | 2.7810 | -0.6279 | |||
| TSM / Taiwan Semiconductor Manufacturing Company Limited - Depositary Receipt (Common Stock) | 0.32 | -17.03 | 88.72 | -0.05 | 1.4135 | -0.1749 | |||
| APH / Amphenol Corporation | 0.56 | -22.48 | 67.95 | -4.99 | 1.0825 | -0.1971 | |||
| NVDA / NVIDIA Corporation | 0.35 | -3.48 | 64.06 | 11.09 | 1.0205 | -0.0112 | |||
| GOOGL / Alphabet Inc. | 0.23 | -4.60 | 56.32 | 32.09 | 0.8973 | 0.1343 | |||
| LRCX / Lam Research Corporation | 0.42 | -15.14 | 55.33 | 14.28 | 0.8816 | 0.0152 | |||
| FTXP / Foothills Exploration, Inc. | 0.05 | -12.10 | 54.76 | 4.43 | 0.8724 | -0.0658 | |||
| META / Meta Platforms, Inc. | 0.07 | -4.60 | 52.49 | -3.91 | 0.8363 | -0.1412 | |||
| NFLX / Netflix, Inc. | 0.04 | -4.60 | 51.31 | -14.04 | 0.8175 | -0.2507 | |||
| MA / Mastercard Incorporated | 0.09 | -4.60 | 50.70 | -3.52 | 0.8078 | -0.1326 | |||
| ICE / Intercontinental Exchange, Inc. | 0.28 | 0.03 | 47.38 | -8.40 | 0.7549 | -0.1707 | |||
| V / Visa Inc. | 0.14 | -4.60 | 47.27 | -8.58 | 0.7531 | -0.1721 | |||
| AME / AMETEK, Inc. | 0.25 | -4.60 | 46.69 | -1.48 | 0.7439 | -0.1042 | |||
| AMZN / Amazon.com, Inc. | 0.21 | -4.60 | 46.43 | -3.42 | 0.7397 | -0.1205 | |||
| INTU / Intuit Inc. | 0.07 | -4.60 | 46.05 | -15.85 | 0.7336 | -0.2455 | |||
| AAPL / Apple Inc. | 0.18 | 1.63 | 45.24 | 26.06 | 0.7207 | 0.0786 | |||
| AMAT / Applied Materials, Inc. | 0.21 | -4.56 | 43.95 | 6.84 | 0.7002 | -0.0359 | |||
| ROP / Roper Technologies, Inc. | 0.08 | 13.63 | 41.69 | 0.43 | 0.6641 | -0.0786 | |||
| DHR / Danaher Corporation | 0.22 | 13.68 | 41.60 | 7.05 | 0.6627 | -0.0326 | |||
| TMO / Thermo Fisher Scientific Inc. | 0.08 | 14.76 | 39.25 | 30.75 | 0.6254 | 0.0882 | |||
| CRM / Salesforce, Inc. | 0.15 | 16.03 | 37.13 | 4.29 | 0.5916 | -0.0455 | |||
| ADBE / Adobe Inc. | 0.10 | 16.63 | 36.15 | 8.35 | 0.5759 | -0.0211 | |||
| HUBB / Hubbell Incorporated | 0.04 | -8.44 | 14.95 | -4.39 | 0.2382 | -0.0416 | |||
| NEE / NextEra Energy, Inc. | 0.18 | -8.42 | 13.98 | 0.45 | 0.2227 | -0.0263 | |||
| TT / Trane Technologies plc | 0.03 | 13.83 | 0.2203 | 0.2203 | |||||
| ORA / Ormat Technologies, Inc. | 0.13 | -8.42 | 12.74 | 4.45 | 0.2030 | -0.0153 | |||
| APTV / Aptiv PLC | 0.14 | 11.87 | 0.1891 | 0.1891 | |||||
| FSLR / First Solar, Inc. | 0.05 | -8.42 | 11.71 | 24.05 | 0.1866 | 0.0176 | |||
| XOM / Exxon Mobil Corporation | 0.10 | -5.17 | 11.57 | 0.00 | 0.1844 | -0.0227 | |||
| CVX / Chevron Corporation | 0.07 | -11.27 | 11.24 | -3.45 | 0.1790 | -0.0292 | |||
| ITRI / Itron, Inc. | 0.09 | -8.42 | 11.20 | -13.64 | 0.1785 | -0.0537 | |||
| VLO / Valero Energy Corporation | 0.06 | -5.17 | 11.16 | 21.30 | 0.1777 | 0.0132 | |||
| IBP / Installed Building Products, Inc. | 0.04 | -8.42 | 10.61 | 26.73 | 0.1691 | 0.0192 | |||
| 001100118 / NetEase, Inc. - Depositary Receipt (Common Stock) | 0.07 | -0.99 | 10.57 | 11.37 | 0.1684 | -0.0014 | |||
| NXPI / NXP Semiconductors N.V. | 0.04 | 10.08 | 0.1606 | 0.1606 | |||||
| COP / ConocoPhillips | 0.10 | 0.94 | 9.80 | 7.60 | 0.1561 | -0.0068 | |||
| SU / Suncor Energy Inc. | 0.23 | -7.87 | 9.50 | 3.36 | 0.1514 | -0.0131 | |||
| IMO / Imperial Oil Limited | 0.10 | -17.74 | 9.11 | -4.54 | 0.1451 | -0.0256 | |||
| QCOM / QUALCOMM Incorporated | 0.05 | -1.02 | 9.07 | 2.73 | 0.1444 | -0.0135 | |||
| ST / Sensata Technologies Holding plc | 0.27 | 8.10 | 0.1291 | 0.1291 | |||||
| CNQ / Canadian Natural Resources Limited | 0.25 | -1.77 | 8.03 | 1.13 | 0.1279 | -0.0142 | |||
| ON / ON Semiconductor Corporation | 0.15 | -8.42 | 7.52 | -13.09 | 0.1198 | -0.0350 | |||
| CSL / Carlisle Companies Incorporated | 0.02 | -8.41 | 7.40 | -18.08 | 0.1179 | -0.0437 | |||
| EOG / EOG Resources, Inc. | 0.06 | -5.17 | 7.26 | -10.43 | 0.1157 | -0.0294 | |||
| BKR / Baker Hughes Company | 0.14 | -5.18 | 7.18 | 25.22 | 0.1143 | 0.0118 | |||
| OC / Owens Corning | 0.05 | -8.42 | 7.12 | -6.08 | 0.1134 | -0.0222 | |||
| FANG / Diamondback Energy, Inc. | 0.05 | 3.62 | 6.94 | 7.67 | 0.1105 | -0.0048 | |||
| CVE / Cenovus Energy Inc. | 0.40 | -4.89 | 6.90 | 20.61 | 0.1099 | 0.0076 | |||
| ENB / Enbridge Inc. | 0.14 | -27.16 | 6.79 | -19.85 | 0.1081 | -0.0434 | |||
| AMRC / Ameresco, Inc. | 0.20 | -18.12 | 6.78 | 84.16 | 0.1080 | 0.0421 | |||
| KMI / Kinder Morgan, Inc. | 0.24 | -29.78 | 6.72 | -32.00 | 0.1070 | -0.0697 | |||
| TRP N / TC Energy Corporation | 0.11 | 5.90 | 0.0940 | 0.0940 | |||||
| DVN / Devon Energy Corporation | 0.16 | 0.45 | 5.78 | 11.66 | 0.0922 | -0.0005 | |||
| SLB / SLB N.V. | 0.16 | -5.17 | 5.75 | -1.74 | 0.0916 | -0.0131 | |||
| HAL / Halliburton Company | 0.21 | -5.17 | 5.26 | 15.95 | 0.0839 | 0.0026 | |||
| CSIQ / Canadian Solar Inc. | 0.36 | -8.42 | 4.65 | 6.95 | 0.0740 | -0.0037 | |||
| ENPH / Enphase Energy, Inc. | 0.07 | -8.41 | 2.55 | -16.76 | 0.0406 | -0.0142 | |||
| HLX / Helix Energy Solutions Group, Inc. | 0.21 | -3.53 | 1.41 | 3.53 | 0.0224 | -0.0019 | |||
| STT / State Street Corporation | 0.01 | 10.98 | 0.94 | 22.29 | 0.0150 | 0.0012 | |||
| NDAQ / Nasdaq, Inc. | 0.01 | 4.72 | 0.91 | 3.89 | 0.0145 | -0.0012 | |||
| BX / Blackstone Inc. | 0.00 | 1.09 | 0.84 | 19.09 | 0.0133 | 0.0008 | |||
| AMG / Affiliated Managers Group, Inc. | 0.00 | 7.38 | 0.82 | 30.41 | 0.0131 | 0.0018 | |||
| RJF / Raymond James Financial, Inc. | 0.00 | 12.65 | 0.82 | 29.64 | 0.0130 | 0.0017 | |||
| ARES / Ares Management Corporation | 0.00 | 4.74 | 0.81 | -1.10 | 0.0129 | -0.0018 | |||
| CG / The Carlyle Group Inc. | 0.01 | -1.74 | 0.79 | 23.98 | 0.0126 | 0.0012 | |||
| AMP / Ameriprise Financial, Inc. | 0.00 | 3.13 | 0.79 | -3.43 | 0.0126 | -0.0021 | |||
| KKR / KKR & Co. Inc. | 0.01 | 4.74 | 0.76 | 5.87 | 0.0121 | -0.0007 | |||
| JHG / Janus Henderson Group plc | 0.02 | 0.75 | 0.0119 | 0.0119 | |||||
| IVZ / Invesco Ltd. | 0.03 | 0.67 | 0.0107 | 0.0107 | |||||
| APAM / Artisan Partners Asset Management Inc. | 0.01 | 12.66 | 0.54 | 10.97 | 0.0086 | -0.0001 | |||
| TER / Teradyne, Inc. | 0.00 | -21.39 | 0.49 | 17.43 | 0.0077 | 0.0003 | |||
| BAP / Credicorp Ltd. | 0.00 | 0.47 | 0.0075 | 0.0075 | |||||
| BEN / Franklin Resources, Inc. | 0.02 | 12.66 | 0.47 | 10.17 | 0.0074 | -0.0001 | |||
| JAZZ / Jazz Pharmaceuticals plc | 0.00 | 0.43 | 0.0068 | 0.0068 | |||||
| TROW / T. Rowe Price Group, Inc. | 0.00 | 12.64 | 0.42 | 20.92 | 0.0067 | 0.0005 | |||
| ADUS / Addus HomeCare Corporation | 0.00 | -1.20 | 0.42 | 0.97 | 0.0067 | -0.0007 | |||
| VRT / Vertiv Holdings Co | 0.00 | -16.37 | 0.41 | -6.61 | 0.0065 | -0.0013 | |||
| A / Agilent Technologies, Inc. | 0.00 | -2.90 | 0.41 | 1.74 | 0.0065 | -0.0007 | |||
| MPWR / Monolithic Power Systems, Inc. | 0.00 | -19.55 | 0.41 | -2.63 | 0.0065 | -0.0010 | |||
| ENTG / Entegris, Inc. | 0.00 | -17.35 | 0.40 | -4.29 | 0.0064 | -0.0011 | |||
| WMS / Advanced Drainage Systems, Inc. | 0.00 | -16.74 | 0.40 | 0.00 | 0.0064 | -0.0008 | |||
| KEYS / Keysight Technologies, Inc. | 0.00 | -7.86 | 0.40 | -2.46 | 0.0063 | -0.0010 | |||
| BIDU / Baidu, Inc. - Depositary Receipt (Common Stock) | 0.00 | 5.14 | 0.39 | 65.68 | 0.0062 | 0.0020 | |||
| MSCI / MSCI Inc. | 0.00 | -8.14 | 0.39 | -9.41 | 0.0061 | -0.0015 | |||
| EW / Edwards Lifesciences Corporation | 0.00 | -8.22 | 0.38 | -9.43 | 0.0061 | -0.0015 | |||
| CDNS / Cadence Design Systems, Inc. | 0.00 | -18.83 | 0.38 | -8.19 | 0.0061 | -0.0014 | |||
| FTV / Fortive Corporation | 0.01 | 36.79 | 0.38 | 28.42 | 0.0060 | 0.0007 | |||
| CHKP / Check Point Software Technologies Ltd. | 0.00 | 0.38 | 0.0060 | 0.0060 | |||||
| IEX / IDEX Corporation | 0.00 | -1.42 | 0.36 | -8.88 | 0.0057 | -0.0013 | |||
| ZBRA / Zebra Technologies Corporation | 0.00 | -12.86 | 0.36 | -16.04 | 0.0057 | -0.0019 | |||
| RVTY / Revvity, Inc. | 0.00 | -5.12 | 0.34 | -17.36 | 0.0054 | -0.0019 | |||
| JD / JD.com, Inc. - Depositary Receipt (Common Stock) | 0.00 | 27.24 | 0.17 | 39.20 | 0.0028 | 0.0005 | |||
| BABA / Alibaba Group Holding Limited - Depositary Receipt (Common Stock) | 0.00 | 20.78 | 0.12 | 93.65 | 0.0019 | 0.0008 | |||
| DECL / Diversified Energy Company | 0.01 | 0.11 | 0.0017 | 0.0017 | |||||
| BIPI / BIP Bermuda Holdings I Limited - Corporate Bond/Note | 0.00 | 0.08 | 0.0013 | 0.0013 | |||||
| VTR / Ventas, Inc. | 0.00 | 0.08 | 0.0013 | 0.0013 | |||||
| WEC / WEC Energy Group, Inc. | 0.00 | 0.08 | 0.0013 | 0.0013 | |||||
| LNT / Alliant Energy Corporation | 0.00 | 0.08 | 0.0013 | 0.0013 | |||||
| ATHM / Autohome Inc. - Depositary Receipt (Common Stock) | 0.00 | 20.92 | 0.08 | 36.84 | 0.0013 | 0.0002 | |||
| UNP / Union Pacific Corporation | 0.00 | 0.08 | 0.0012 | 0.0012 | |||||
| PRLD / Prologis, Inc. | 0.00 | 0.08 | 0.0012 | 0.0012 | |||||
| WTRG / Essential Utilities, Inc. | 0.00 | 0.08 | 0.0012 | 0.0012 | |||||
| DUK / Duke Energy Corporation | 0.00 | 0.08 | 0.0012 | 0.0012 | |||||
| PEAK / Healthpeak Properties, Inc. | 0.00 | 0.08 | 0.0012 | 0.0012 | |||||
| SBAC / SBA Communications Corporation | 0.00 | 0.07 | 0.0012 | 0.0012 | |||||
| DLR / Digital Realty Trust, Inc. | 0.00 | 0.07 | 0.0011 | 0.0011 | |||||
| 1AMT / American Tower Corporation | 0.00 | 0.07 | 0.0011 | 0.0011 | |||||
| EQIX / Equinix, Inc. | 0.00 | 0.07 | 0.0011 | 0.0011 | |||||
| ANET / Arista Networks, Inc. | 0.00 | -100.00 | 0.00 | 0.0000 | |||||
| RAL / Ralliant Corporation | 0.00 | -100.00 | 0.00 | 0.0000 |