Estatísticas Básicas
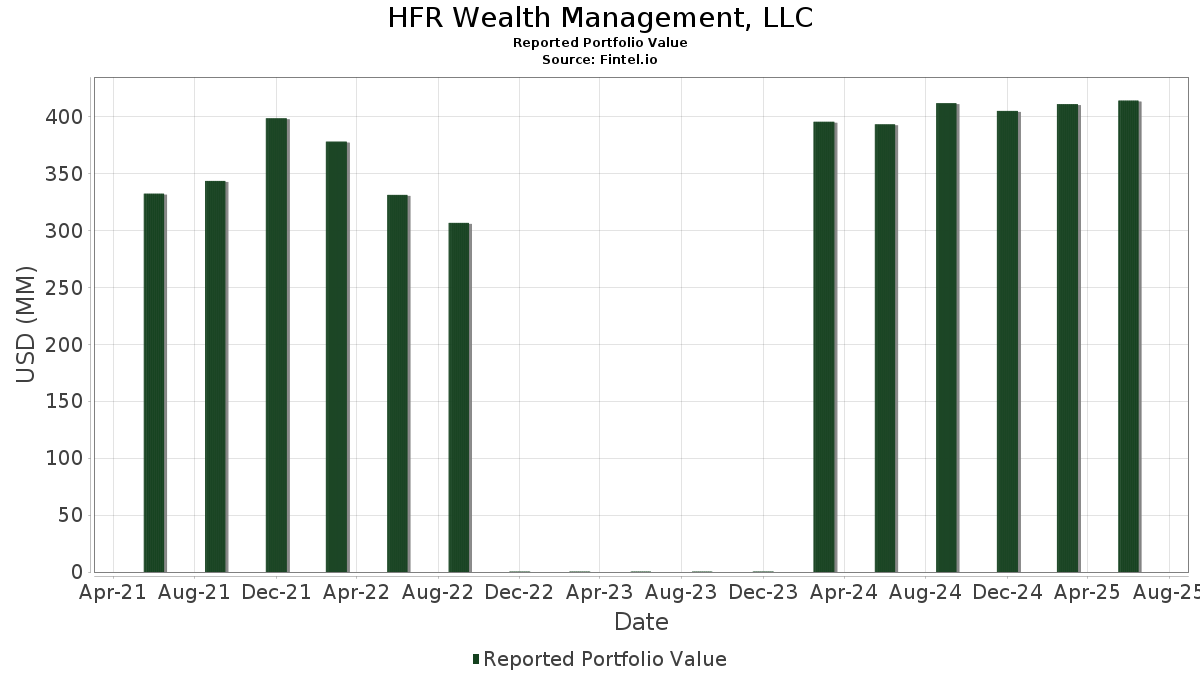
| Valor do Portfólio | $ 423,604,262 |
| Posições Atuais | 50 |
Últimas Participações, Desempenho, AUM (de 13F, 13D)
HFR Wealth Management, LLC divulgou 50 participações totais em seus últimos arquivamentos da SEC. O valor mais recente da carteira é calculado como $ 423,604,262 USD. O Ativo Total Sob Gestão (AUM) é esse valor mais o caixa (que não é divulgado). As principais posições de HFR Wealth Management, LLC são Amphenol Corporation (US:APH) , Amazon.com, Inc. (US:AMZN) , Apple Inc. (US:AAPL) , The TJX Companies, Inc. (US:TJX) , and Cintas Corporation (US:CTAS) .
Maiores Aumentos Este Trimestre
Usamos a mudança na alocação do portfólio porque esta é a métrica mais significativa. As mudanças podem ser devido a operações ou mudanças nos preços das ações.
| Ativo | Ações (MM) |
Valor (MM$) |
% do Portfólio | Δ% do Portfólio |
|---|---|---|---|---|
| 0.10 | 14.67 | 3.4621 | 0.9325 | |
| 0.06 | 12.52 | 2.9545 | 0.5233 | |
| 0.04 | 12.66 | 2.9875 | 0.5001 | |
| 0.08 | 22.08 | 5.2133 | 0.4436 | |
| 0.14 | 21.34 | 5.0372 | 0.4060 | |
| 0.21 | 29.03 | 6.8524 | 0.3909 | |
| 0.10 | 22.15 | 5.2299 | 0.3811 | |
| 0.04 | 9.77 | 2.3073 | 0.3755 | |
| 0.12 | 8.84 | 2.0869 | 0.3171 | |
| 0.17 | 17.40 | 4.1064 | 0.2827 |
Maiores Diminuições Este Trimestre
Usamos a mudança na alocação do portfólio porque esta é a métrica mais significativa. As mudanças podem ser devido a operações ou mudanças nos preços das ações.
| Ativo | Ações (MM) |
Valor (MM$) |
% do Portfólio | Δ% do Portfólio |
|---|---|---|---|---|
| 0.01 | 0.61 | 0.1433 | -1.9260 | |
| 0.26 | 13.13 | 3.1000 | -0.3080 | |
| 0.05 | 12.43 | 2.9337 | -0.2949 | |
| 0.29 | 10.76 | 2.5399 | -0.2872 | |
| 0.10 | 18.60 | 4.3898 | -0.2674 | |
| 0.10 | 10.39 | 2.4525 | -0.2347 | |
| 0.11 | 11.27 | 2.6615 | -0.2044 | |
| 0.02 | 16.13 | 3.8086 | -0.1670 | |
| 0.03 | 12.89 | 3.0436 | -0.1570 | |
| 0.04 | 9.14 | 2.1576 | -0.1483 |
Arquivamentos 13F e Fundo
Este formulário foi arquivado em 2026-02-11 para o período de relatório 2025-12-31. Clique no ícone de link para ver o histórico completo da transação.
Atualize para desbloquear dados premium e exportar para Excel ![]() .
.
| Ativo | Tipo | Preço Médio por Ação | Ações (MM) |
ΔAções (%) |
Valor ($MM) |
ΔAções (%) |
Portfólio (%) |
ΔPortfólio (%) |
|
|---|---|---|---|---|---|---|---|---|---|
| APH / Amphenol Corporation | 0.21 | -5.70 | 29.03 | 2.98 | 6.8524 | 0.3909 | |||
| AMZN / Amazon.com, Inc. | 0.10 | -0.37 | 22.15 | 4.74 | 5.2299 | 0.3811 | |||
| AAPL / Apple Inc. | 0.08 | -0.59 | 22.08 | 6.14 | 5.2133 | 0.4436 | |||
| TJX / The TJX Companies, Inc. | 0.14 | -0.61 | 21.34 | 5.62 | 5.0372 | 0.4060 | |||
| CTAS / Cintas Corporation | 0.10 | -0.10 | 18.60 | -8.47 | 4.3898 | -0.2674 | |||
| SCHW / The Charles Schwab Corporation | 0.17 | -0.35 | 17.40 | 4.29 | 4.1064 | 0.2827 | |||
| ROL / Rollins, Inc. | 0.27 | -0.04 | 16.44 | 2.14 | 3.8806 | 0.1911 | |||
| V / Visa Inc. | 0.05 | 0.26 | 16.15 | 3.00 | 3.8118 | 0.2182 | |||
| COST / Costco Wholesale Corporation | 0.02 | -0.14 | 16.13 | -6.97 | 3.8086 | -0.1670 | |||
| INTU / Intuit Inc. | 0.02 | 0.16 | 15.49 | -2.84 | 3.6575 | 0.0019 | |||
| PG / The Procter & Gamble Company | 0.10 | 42.49 | 14.67 | 32.91 | 3.4621 | 0.9325 | |||
| TSCO / Tractor Supply Company | 0.26 | 0.45 | 13.13 | -11.67 | 3.1000 | -0.3080 | |||
| LII / Lennox International Inc. | 0.03 | 0.67 | 12.89 | -7.66 | 3.0436 | -0.1570 | |||
| WM / Waste Management, Inc. | 0.06 | 0.44 | 12.72 | -0.07 | 3.0031 | 0.0848 | |||
| AMGN / Amgen Inc. | 0.04 | 0.56 | 12.66 | 16.64 | 2.9875 | 0.5001 | |||
| BRK.B / Berkshire Hathaway Inc. | 0.03 | 0.02 | 12.59 | 0.00 | 2.9716 | 0.0861 | |||
| DOV / Dover Corporation | 0.06 | 0.84 | 12.52 | 18.01 | 2.9545 | 0.5233 | |||
| ADP / Automatic Data Processing, Inc. | 0.05 | 0.68 | 12.43 | -11.76 | 2.9337 | -0.2949 | |||
| PKG / Packaging Corporation of America | 0.05 | -0.01 | 11.32 | -5.38 | 2.6727 | -0.0703 | |||
| VLTO / Veralto Corporation | 0.11 | -3.64 | 11.27 | -9.82 | 2.6615 | -0.2044 | |||
| UNP / Union Pacific Corporation | 0.05 | 1.06 | 10.97 | -1.10 | 2.5895 | 0.0469 | |||
| WEC / WEC Energy Group, Inc. | 0.10 | 0.71 | 10.90 | -7.31 | 2.5739 | -0.1227 | |||
| TR / Tootsie Roll Industries, Inc. | 0.29 | -0.16 | 10.76 | -12.76 | 2.5399 | -0.2872 | |||
| NEE / NextEra Energy, Inc. | 0.13 | 0.88 | 10.74 | 7.28 | 2.5352 | 0.2404 | |||
| STE / STERIS plc | 0.04 | 0.14 | 10.47 | 2.60 | 2.4711 | 0.1324 | |||
| RPM / RPM International Inc. | 0.10 | 0.46 | 10.39 | -11.37 | 2.4525 | -0.2347 | |||
| DHR / Danaher Corporation | 0.04 | 0.45 | 9.77 | 15.99 | 2.3073 | 0.3755 | |||
| APD / Air Products and Chemicals, Inc. | 0.04 | 0.31 | 9.14 | -9.14 | 2.1576 | -0.1483 | |||
| HSIC / Henry Schein, Inc. | 0.12 | 0.56 | 8.84 | 14.52 | 2.0869 | 0.3171 | |||
| BRK.A / Berkshire Hathaway Inc. | 0.00 | 0.00 | 2.26 | 0.09 | 0.5346 | 0.0159 | |||
| B / Barrick Mining Corporation | 0.02 | 0.00 | 0.89 | 32.88 | 0.2100 | 0.0566 | |||
| RTX / RTX Corporation | 0.00 | -2.11 | 0.85 | 7.31 | 0.2009 | 0.0191 | |||
| JPM / JPMorgan Chase & Co. | 0.00 | 0.00 | 0.61 | 2.01 | 0.1438 | 0.0071 | |||
| MKC / McCormick & Company, Incorporated | 0.01 | -93.39 | 0.61 | -93.27 | 0.1433 | -1.9260 | |||
| JNJ / Johnson & Johnson | 0.00 | 0.00 | 0.60 | 11.61 | 0.1408 | 0.0183 | |||
| SXI / Standex International Corporation | 0.00 | -0.46 | 0.47 | 1.95 | 0.1114 | 0.0054 | |||
| HD / The Home Depot, Inc. | 0.00 | 0.00 | 0.46 | -15.13 | 0.1087 | -0.0156 | |||
| ETN / Eaton Corporation plc | 0.00 | 0.00 | 0.41 | -15.00 | 0.0965 | -0.0136 | |||
| CVX / Chevron Corporation | 0.00 | 0.00 | 0.40 | -1.98 | 0.0937 | 0.0010 | |||
| XOM / Exxon Mobil Corporation | 0.00 | 0.00 | 0.40 | 6.74 | 0.0935 | 0.0084 | |||
| UNH / UnitedHealth Group Incorporated | 0.00 | 0.00 | 0.36 | -4.52 | 0.0849 | -0.0013 | |||
| ABBV / AbbVie Inc. | 0.00 | 0.00 | 0.33 | -1.21 | 0.0773 | 0.0012 | |||
| IJH / iShares Trust - iShares Core S&P Mid-Cap ETF | 0.00 | 0.00 | 0.33 | 0.93 | 0.0769 | 0.0031 | |||
| AVGO / Broadcom Inc. | 0.00 | 0.13 | 0.27 | 5.08 | 0.0636 | 0.0048 | |||
| DE / Deere & Company | 0.00 | 0.00 | 0.26 | 1.96 | 0.0615 | 0.0028 | |||
| SR / Spire Inc. | 0.00 | 0.00 | 0.25 | 1.21 | 0.0595 | 0.0025 | |||
| PM / Philip Morris International Inc. | 0.00 | 0.00 | 0.24 | -1.25 | 0.0562 | 0.0010 | |||
| IBM / International Business Machines Corporation | 0.00 | 0.00 | 0.23 | 5.00 | 0.0548 | 0.0041 | |||
| SPY / State Street SPDR S&P 500 ETF Trust | 0.00 | 0.20 | 0.0483 | 0.0483 | |||||
| VZ / Verizon Communications Inc. | 0.00 | 0.00 | 0.20 | -7.31 | 0.0480 | -0.0023 | |||
| CLX / The Clorox Company | 0.00 | -100.00 | 0.00 | 0.0000 | |||||
| BDX / Becton, Dickinson and Company | 0.00 | -100.00 | 0.00 | 0.0000 |