Estatísticas Básicas
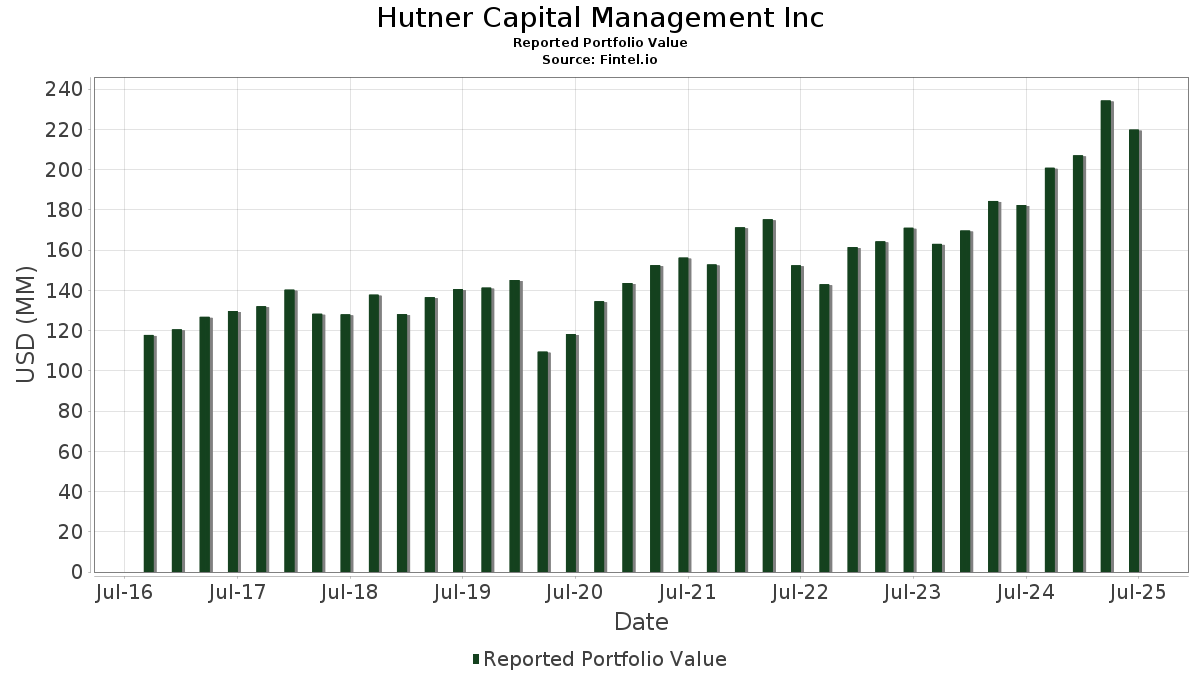
| Valor do Portfólio | $ 239,595,635 |
| Posições Atuais | 44 |
Últimas Participações, Desempenho, AUM (de 13F, 13D)
Hutner Capital Management Inc divulgou 44 participações totais em seus últimos arquivamentos da SEC. O valor mais recente da carteira é calculado como $ 239,595,635 USD. O Ativo Total Sob Gestão (AUM) é esse valor mais o caixa (que não é divulgado). As principais posições de Hutner Capital Management Inc são Berkshire Hathaway Inc. (US:BRK.A) , Berkshire Hathaway Inc. (US:BRK.B) , Alphabet Inc. (US:GOOG) , Costco Wholesale Corporation (US:COST) , and Philip Morris International Inc. (US:PM) . As novas posições de Hutner Capital Management Inc incluem Alphabet Inc. (US:GOOGL) , .
Maiores Aumentos Este Trimestre
Usamos a mudança na alocação do portfólio porque esta é a métrica mais significativa. As mudanças podem ser devido a operações ou mudanças nos preços das ações.
| Ativo | Ações (MM) |
Valor (MM$) |
% do Portfólio | Δ% do Portfólio |
|---|---|---|---|---|
| GOOG / Alphabet Inc. | 0.04 | 12.44 | 5.1936 | 1.1039 |
| JNJ / Johnson & Johnson | 0.05 | 9.36 | 3.9054 | 0.4413 |
| V / Visa Inc. | 0.01 | 2.43 | 1.0133 | 0.2884 |
| AXP / American Express Company | 0.02 | 7.55 | 3.1512 | 0.2484 |
| CB / Chubb Limited | 0.01 | 3.52 | 1.4691 | 0.2189 |
| PEP / PepsiCo, Inc. | 0.07 | 9.36 | 3.9064 | 0.1950 |
| ADI / Analog Devices, Inc. | 0.01 | 3.18 | 1.3290 | 0.1568 |
| KO / The Coca-Cola Company | 0.15 | 10.76 | 4.4923 | 0.1385 |
| AAPL / Apple Inc. | 0.02 | 6.00 | 2.5060 | 0.1236 |
| YUM / Yum! Brands, Inc. | 0.01 | 1.48 | 0.6188 | 0.1235 |
Maiores Diminuições Este Trimestre
Usamos a mudança na alocação do portfólio porque esta é a métrica mais significativa. As mudanças podem ser devido a operações ou mudanças nos preços das ações.
| Ativo | Ações (MM) |
Valor (MM$) |
% do Portfólio | Δ% do Portfólio |
|---|---|---|---|---|
| COST / Costco Wholesale Corporation | 0.01 | 12.15 | 5.0725 | -0.4839 |
| MO / Altria Group, Inc. | 0.11 | 6.55 | 2.7323 | -0.4583 |
| FNV / Franco-Nevada Corporation | 0.05 | 9.79 | 4.0863 | -0.3236 |
| PG / The Procter & Gamble Company | 0.05 | 7.71 | 3.2188 | -0.2872 |
| OKE / ONEOK, Inc. | 0.01 | 0.51 | 0.2136 | -0.2818 |
| ORLY / O'Reilly Automotive, Inc. | 0.03 | 2.68 | 1.1190 | -0.1847 |
| BRK.B / Berkshire Hathaway Inc. | 0.04 | 21.07 | 8.7943 | -0.1804 |
| GPC / Genuine Parts Company | 0.03 | 3.08 | 1.2844 | -0.1754 |
| BRK.A / Berkshire Hathaway Inc. | 0.00 | 30.95 | 12.9163 | -0.1643 |
| PM / Philip Morris International Inc. | 0.07 | 11.81 | 4.9274 | -0.1545 |
Arquivamentos 13F e Fundo
Este formulário foi arquivado em 2026-02-17 para o período de relatório 2025-12-31. Clique no ícone de link para ver o histórico completo da transação.
Atualize para desbloquear dados premium e exportar para Excel ![]() .
.
| Ativo | Tipo | Preço Médio por Ação | Ações (MM) |
ΔAções (%) |
Valor ($MM) |
ΔValor (%) |
Portfólio (%) |
ΔPortfólio (%) |
|
|---|---|---|---|---|---|---|---|---|---|
| BRK.A / Berkshire Hathaway Inc. | 0.00 | 0.00 | 30.95 | 0.08 | 12.9163 | -0.1643 | |||
| BRK.B / Berkshire Hathaway Inc. | 0.04 | -0.67 | 21.07 | -0.69 | 8.7943 | -0.1804 | |||
| GOOG / Alphabet Inc. | 0.04 | -0.11 | 12.44 | 28.72 | 5.1936 | 1.1039 | |||
| COST / Costco Wholesale Corporation | 0.01 | -0.68 | 12.15 | -7.48 | 5.0725 | -0.4839 | |||
| PM / Philip Morris International Inc. | 0.07 | -0.63 | 11.81 | -1.73 | 4.9274 | -0.1545 | |||
| KO / The Coca-Cola Company | 0.15 | -0.79 | 10.76 | 4.58 | 4.4923 | 0.1385 | |||
| MCD / McDonald's Corporation | 0.03 | 0.89 | 10.68 | 1.47 | 4.4588 | 0.0050 | |||
| FNV / Franco-Nevada Corporation | 0.05 | 1.00 | 9.79 | -6.08 | 4.0863 | -0.3236 | |||
| ABBV / AbbVie Inc. | 0.04 | -0.59 | 9.57 | -1.90 | 3.9931 | -0.1323 | |||
| PEP / PepsiCo, Inc. | 0.07 | 4.39 | 9.36 | 6.68 | 3.9064 | 0.1950 | |||
| JNJ / Johnson & Johnson | 0.05 | 2.38 | 9.36 | 14.28 | 3.9054 | 0.4413 | |||
| PG / The Procter & Gamble Company | 0.05 | -0.24 | 7.71 | -6.94 | 3.2188 | -0.2872 | |||
| ENB / Enbridge Inc. | 0.16 | 3.31 | 7.64 | -2.08 | 3.1900 | -0.1118 | |||
| AXP / American Express Company | 0.02 | -1.21 | 7.55 | 10.03 | 3.1512 | 0.2484 | |||
| MO / Altria Group, Inc. | 0.11 | -0.56 | 6.55 | -13.21 | 2.7323 | -0.4583 | |||
| WMT / Walmart Inc. | 0.06 | -2.76 | 6.48 | 5.12 | 2.7056 | 0.0970 | |||
| AAPL / Apple Inc. | 0.02 | -0.14 | 6.00 | 6.62 | 2.5060 | 0.1236 | |||
| ABT / Abbott Laboratories | 0.04 | 1.93 | 5.51 | -4.65 | 2.3006 | -0.1449 | |||
| EPD / Enterprise Products Partners L.P. - Limited Partnership | 0.14 | -0.53 | 4.39 | 1.97 | 1.8339 | 0.0113 | |||
| CB / Chubb Limited | 0.01 | 7.71 | 3.52 | 19.09 | 1.4691 | 0.2189 | |||
| ADI / Analog Devices, Inc. | 0.01 | 4.11 | 3.18 | 14.95 | 1.3290 | 0.1568 | |||
| GPC / Genuine Parts Company | 0.03 | 0.52 | 3.08 | -10.81 | 1.2844 | -0.1754 | |||
| O / Realty Income Corporation | 0.05 | 6.92 | 2.91 | -0.85 | 1.2126 | -0.0270 | |||
| UNP / Union Pacific Corporation | 0.01 | -0.41 | 2.84 | -2.54 | 1.1852 | -0.0472 | |||
| ORLY / O'Reilly Automotive, Inc. | 0.03 | 2.82 | 2.68 | -13.01 | 1.1190 | -0.1847 | |||
| VRSK / Verisk Analytics, Inc. | 0.01 | 0.00 | 2.51 | -11.04 | 1.0456 | -0.1459 | |||
| V / Visa Inc. | 0.01 | 37.91 | 2.43 | 41.68 | 1.0133 | 0.2884 | |||
| NSC / Norfolk Southern Corporation | 0.01 | 0.00 | 2.15 | -3.89 | 0.8982 | -0.0490 | |||
| HSY / The Hershey Company | 0.01 | 8.99 | 1.69 | 6.03 | 0.7051 | 0.0312 | |||
| YUM / Yum! Brands, Inc. | 0.01 | 27.24 | 1.48 | 26.67 | 0.6188 | 0.1235 | |||
| DEO / Diageo plc - Depositary Receipt (Common Stock) | 0.02 | -0.97 | 1.43 | -10.50 | 0.5979 | -0.0789 | |||
| WFC / Wells Fargo & Company | 0.02 | -0.11 | 1.41 | 11.06 | 0.5869 | 0.0513 | |||
| PGR / The Progressive Corporation | 0.01 | 9.01 | 1.38 | 0.51 | 0.5739 | -0.0048 | |||
| QSR / Restaurant Brands International Inc. | 0.02 | 12.68 | 1.21 | 19.86 | 0.5066 | 0.0782 | |||
| SHW / The Sherwin-Williams Company | 0.00 | 15.88 | 1.17 | 8.45 | 0.4875 | 0.0319 | |||
| EXPD / Expeditors International of Washington, Inc. | 0.01 | -0.37 | 0.97 | 21.18 | 0.4037 | 0.0658 | |||
| NVS / Novartis AG - Depositary Receipt (Common Stock) | 0.01 | 6.20 | 0.94 | 14.20 | 0.3931 | 0.0442 | |||
| WEC / WEC Energy Group, Inc. | 0.01 | -1.31 | 0.56 | -9.18 | 0.2357 | -0.0273 | |||
| OKE / ONEOK, Inc. | 0.01 | -56.61 | 0.51 | -56.32 | 0.2136 | -0.2818 | |||
| MCO / Moody's Corporation | 0.00 | 0.00 | 0.48 | 7.11 | 0.2015 | 0.0110 | |||
| UPS / United Parcel Service, Inc. | 0.00 | -1.09 | 0.43 | 17.49 | 0.1797 | 0.0246 | |||
| ZTS / Zoetis Inc. | 0.00 | 0.00 | 0.34 | -14.04 | 0.1433 | -0.0256 | |||
| AMT / American Tower Corporation | 0.00 | -2.78 | 0.26 | -11.38 | 0.1076 | -0.0153 | |||
| GOOGL / Alphabet Inc. | 0.00 | 0.25 | 0.1038 | 0.1038 | |||||
| MDLZ / Mondelez International, Inc. | 0.00 | -100.00 | 0.00 | 0.0000 |