Estatísticas Básicas
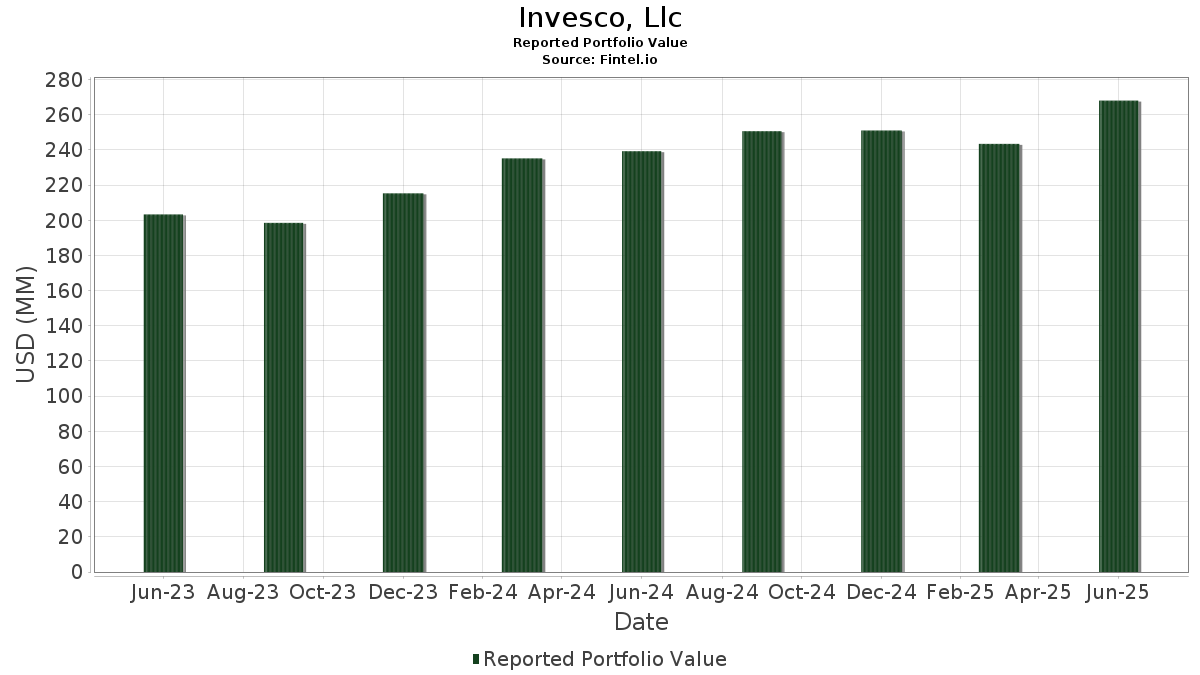
| Valor do Portfólio | $ 295,701,675 |
| Posições Atuais | 133 |
Últimas Participações, Desempenho, AUM (de 13F, 13D)
Invesco, Llc divulgou 133 participações totais em seus últimos arquivamentos da SEC. O valor mais recente da carteira é calculado como $ 295,701,675 USD. O Ativo Total Sob Gestão (AUM) é esse valor mais o caixa (que não é divulgado). As principais posições de Invesco, Llc são Oracle Corporation (US:ORCL) , Alphabet Inc. (US:GOOGL) , Amazon.com, Inc. (US:AMZN) , Apple Inc. (US:AAPL) , and Microsoft Corporation (US:MSFT) . As novas posições de Invesco, Llc incluem Wells Fargo & Company (US:WFC) , Stryker Corporation (US:SYK) , .
Maiores Aumentos Este Trimestre
Usamos a mudança na alocação do portfólio porque esta é a métrica mais significativa. As mudanças podem ser devido a operações ou mudanças nos preços das ações.
| Ativo | Ações (MM) |
Valor (MM$) |
% do Portfólio | Δ% do Portfólio |
|---|---|---|---|---|
| 0.11 | 26.95 | 9.1139 | 1.8429 | |
| 0.10 | 28.88 | 9.7659 | 1.3343 | |
| 0.05 | 13.97 | 4.7229 | 0.5479 | |
| 0.07 | 8.49 | 2.8700 | 0.3124 | |
| 0.01 | 5.07 | 1.7149 | 0.1770 | |
| 0.04 | 7.35 | 2.4841 | 0.1606 | |
| 0.01 | 4.33 | 1.4647 | 0.1356 | |
| 0.00 | 1.19 | 0.4036 | 0.1263 | |
| 0.01 | 3.72 | 1.2588 | 0.1097 | |
| 0.00 | 3.70 | 1.2497 | 0.0945 |
Maiores Diminuições Este Trimestre
Usamos a mudança na alocação do portfólio porque esta é a métrica mais significativa. As mudanças podem ser devido a operações ou mudanças nos preços das ações.
| Ativo | Ações (MM) |
Valor (MM$) |
% do Portfólio | Δ% do Portfólio |
|---|---|---|---|---|
| 0.02 | 6.48 | 2.1908 | -1.2214 | |
| 0.01 | 8.90 | 3.0107 | -0.5303 | |
| 0.08 | 17.01 | 5.7528 | -0.4778 | |
| 0.00 | 1.82 | 0.6149 | -0.2122 | |
| 0.02 | 5.57 | 1.8853 | -0.2059 | |
| 0.01 | 2.04 | 0.6902 | -0.1706 | |
| 0.00 | 1.86 | 0.6280 | -0.1562 | |
| 0.00 | 0.24 | 0.0800 | -0.1342 | |
| 0.02 | 9.23 | 3.1231 | -0.1186 | |
| 0.02 | 2.08 | 0.7036 | -0.1138 |
Arquivamentos 13F e Fundo
Este formulário foi arquivado em 2025-10-21 para o período de relatório 2025-09-30. Clique no ícone de link para ver o histórico completo da transação.
Atualize para desbloquear dados premium e exportar para Excel ![]() .
.
| Ativo | Tipo | Preço Médio por Ação | Ações (MM) |
ΔAções (%) |
Valor ($MM) |
ΔAções (%) |
Portfólio (%) |
ΔPortfólio (%) |
|
|---|---|---|---|---|---|---|---|---|---|
| ORCL / Oracle Corporation | 0.10 | -0.68 | 28.88 | 27.76 | 9.7659 | 1.3343 | |||
| GOOGL / Alphabet Inc. | 0.11 | 0.70 | 26.95 | 38.27 | 9.1139 | 1.8429 | |||
| AMZN / Amazon.com, Inc. | 0.08 | 1.76 | 17.01 | 1.85 | 5.7528 | -0.4778 | |||
| AAPL / Apple Inc. | 0.05 | 0.54 | 13.97 | 24.79 | 4.7229 | 0.5479 | |||
| MSFT / Microsoft Corporation | 0.02 | 2.05 | 9.23 | 6.26 | 3.1231 | -0.1186 | |||
| COST / Costco Wholesale Corporation | 0.01 | 0.30 | 8.90 | -6.22 | 3.0107 | -0.5303 | |||
| APH / Amphenol Corporation | 0.07 | -1.23 | 8.49 | 23.77 | 2.8700 | 0.3124 | |||
| NVDD / Direxion Shares ETF Trust - Direxion Daily NVDA Bear 1X Shares | 0.04 | -0.14 | 7.35 | 17.94 | 2.4841 | 0.1606 | |||
| SHW / The Sherwin-Williams Company | 0.02 | -29.77 | 6.48 | -29.18 | 2.1908 | -1.2214 | |||
| MCK / McKesson Corporation | 0.01 | 0.00 | 6.24 | 5.43 | 2.1096 | -0.0977 | |||
| V / Visa Inc. | 0.02 | 3.43 | 5.57 | -0.55 | 1.8853 | -0.2059 | |||
| TMO / Thermo Fisher Scientific Inc. | 0.01 | 2.82 | 5.07 | 23.00 | 1.7149 | 0.1770 | |||
| PSX / Phillips 66 | 0.03 | -0.30 | 4.73 | 13.68 | 1.5988 | 0.0474 | |||
| MNST / Monster Beverage Corporation | 0.07 | 0.89 | 4.49 | 8.42 | 1.5198 | -0.0266 | |||
| NOC / Northrop Grumman Corporation | 0.01 | -0.25 | 4.33 | 21.59 | 1.4647 | 0.1356 | |||
| AXP / American Express Company | 0.01 | -0.05 | 4.24 | 4.10 | 1.4343 | -0.0858 | |||
| ADI / Analog Devices, Inc. | 0.02 | 2.36 | 4.12 | 5.68 | 1.3918 | -0.0611 | |||
| AFL / Aflac Incorporated | 0.04 | 2.89 | 3.97 | 8.97 | 1.3438 | -0.0164 | |||
| JPM / JPMorgan Chase & Co. | 0.01 | -0.58 | 3.89 | 8.17 | 1.3170 | -0.0260 | |||
| AVGO / Broadcom Inc. | 0.01 | 0.97 | 3.72 | 20.84 | 1.2588 | 0.1097 | |||
| FTXP / Foothills Exploration, Inc. | 0.00 | -0.90 | 3.70 | 19.35 | 1.2497 | 0.0945 | |||
| LLY / Eli Lilly and Company | 0.00 | 3.54 | 3.61 | 1.35 | 1.2213 | -0.1079 | |||
| META / Meta Platforms, Inc. | 0.00 | 10.92 | 3.56 | 10.36 | 1.2030 | 0.0006 | |||
| A / Agilent Technologies, Inc. | 0.03 | 1.33 | 3.45 | 10.23 | 1.1664 | -0.0010 | |||
| MA / Mastercard Incorporated | 0.01 | -0.39 | 3.18 | 0.83 | 1.0739 | -0.1010 | |||
| PNC / The PNC Financial Services Group, Inc. | 0.02 | 0.00 | 3.02 | 7.78 | 1.0217 | -0.0239 | |||
| ALL / The Allstate Corporation | 0.01 | 4.85 | 2.99 | 11.80 | 1.0126 | 0.0135 | |||
| GPC / Genuine Parts Company | 0.02 | 3.54 | 2.75 | 18.30 | 0.9293 | 0.0627 | |||
| AMGN / Amgen Inc. | 0.01 | -3.97 | 2.41 | -2.91 | 0.8134 | -0.1110 | |||
| ABT / Abbott Laboratories | 0.02 | 6.80 | 2.35 | 5.15 | 0.7950 | -0.0388 | |||
| RTX / RTX Corporation | 0.01 | 0.00 | 2.31 | 14.55 | 0.7805 | 0.0292 | |||
| ICE / Intercontinental Exchange, Inc. | 0.01 | 5.67 | 2.28 | -2.94 | 0.7711 | -0.1055 | |||
| GJR / Strats Trust For Procter & Gambel Security - Preferred Security | 0.01 | 1.42 | 2.26 | -2.17 | 0.7631 | -0.0975 | |||
| PANW / Palo Alto Networks, Inc. | 0.01 | 15.70 | 2.16 | 15.13 | 0.7311 | 0.0306 | |||
| ARW / Arrow Electronics, Inc. | 0.02 | 0.00 | 2.08 | -5.07 | 0.7036 | -0.1138 | |||
| XOM / Exxon Mobil Corporation | 0.02 | 4.12 | 2.08 | 8.91 | 0.7032 | -0.0091 | |||
| TXN / Texas Instruments Incorporated | 0.01 | -0.05 | 2.04 | -11.53 | 0.6902 | -0.1706 | |||
| MCD / McDonald's Corporation | 0.01 | 2.40 | 2.02 | 6.49 | 0.6830 | -0.0243 | |||
| HON / Honeywell International Inc. | 0.01 | 4.25 | 1.96 | -5.76 | 0.6639 | -0.1133 | |||
| CVX / Chevron Corporation | 0.01 | 3.36 | 1.88 | 12.10 | 0.6359 | 0.0102 | |||
| NRG / NRG Energy, Inc. | 0.01 | 0.00 | 1.87 | 0.86 | 0.6335 | -0.0594 | |||
| HD / The Home Depot, Inc. | 0.00 | 9.09 | 1.87 | 20.61 | 0.6314 | 0.0537 | |||
| NFLX / Netflix, Inc. | 0.00 | -1.34 | 1.86 | -11.66 | 0.6280 | -0.1562 | |||
| TMUS / T-Mobile US, Inc. | 0.01 | 1.17 | 1.84 | 1.65 | 0.6235 | -0.0531 | |||
| FICO / Fair Isaac Corporation | 0.00 | 0.16 | 1.82 | -18.00 | 0.6149 | -0.2122 | |||
| ITW / Illinois Tool Works Inc. | 0.01 | 13.40 | 1.66 | 19.55 | 0.5626 | 0.0437 | |||
| ADP / Automatic Data Processing, Inc. | 0.01 | 1.81 | 1.64 | -3.08 | 0.5531 | -0.0766 | |||
| SNPS / Synopsys, Inc. | 0.00 | 11.00 | 1.49 | 6.82 | 0.5034 | -0.0164 | |||
| SO / The Southern Company | 0.02 | -1.58 | 1.42 | 1.57 | 0.4818 | -0.0415 | |||
| CASY / Casey's General Stores, Inc. | 0.00 | -0.16 | 1.40 | 10.57 | 0.4743 | 0.0013 | |||
| CAT / Caterpillar Inc. | 0.00 | 0.03 | 1.40 | 22.96 | 0.4730 | 0.0486 | |||
| TJX / The TJX Companies, Inc. | 0.01 | 6.87 | 1.40 | 25.18 | 0.4725 | 0.0558 | |||
| DUK / Duke Energy Corporation | 0.01 | 0.87 | 1.33 | 5.73 | 0.4494 | -0.0192 | |||
| EMR / Emerson Electric Co. | 0.01 | 11.50 | 1.30 | 9.68 | 0.4408 | -0.0024 | |||
| PFE / Pfizer Inc. | 0.05 | 0.00 | 1.30 | 5.10 | 0.4395 | -0.0217 | |||
| CEG / Constellation Energy Corporation | 0.00 | 0.00 | 1.27 | 1.93 | 0.4284 | -0.0351 | |||
| GOOGL / Alphabet Inc. | 0.01 | -1.07 | 1.23 | 36.47 | 0.4166 | 0.0798 | |||
| MSI / Motorola Solutions, Inc. | 0.00 | 47.62 | 1.19 | 60.57 | 0.4036 | 0.1263 | |||
| CSX / CSX Corporation | 0.03 | 1.90 | 1.15 | 10.97 | 0.3900 | 0.0021 | |||
| WMT / Walmart Inc. | 0.01 | 6.41 | 1.14 | 12.07 | 0.3865 | 0.0064 | |||
| UNH / UnitedHealth Group Incorporated | 0.00 | 6.99 | 1.13 | 18.40 | 0.3809 | 0.0261 | |||
| CSCO / Cisco Systems, Inc. | 0.02 | -0.64 | 1.11 | -2.04 | 0.3745 | -0.0471 | |||
| AMAT / Applied Materials, Inc. | 0.01 | -1.26 | 1.10 | 10.41 | 0.3733 | 0.0004 | |||
| PGR / The Progressive Corporation | 0.00 | 0.00 | 1.05 | -7.41 | 0.3552 | -0.0682 | |||
| LOW / Lowe's Companies, Inc. | 0.00 | 19.89 | 0.99 | 35.76 | 0.3340 | 0.0627 | |||
| XEL / Xcel Energy Inc. | 0.01 | 0.70 | 0.92 | 19.20 | 0.3111 | 0.0233 | |||
| COP / ConocoPhillips | 0.01 | 5.57 | 0.92 | 11.27 | 0.3106 | 0.0027 | |||
| EA / Electronic Arts Inc. | 0.00 | -3.12 | 0.90 | 22.40 | 0.3031 | 0.0299 | |||
| AMD / Advanced Micro Devices, Inc. | 0.01 | 6.38 | 0.89 | 21.40 | 0.2993 | 0.0271 | |||
| PEP / PepsiCo, Inc. | 0.01 | 17.12 | 0.88 | 24.61 | 0.2980 | 0.0341 | |||
| KMB / Kimberly-Clark Corporation | 0.01 | 0.00 | 0.87 | -3.46 | 0.2929 | -0.0421 | |||
| TSCO / Tractor Supply Company | 0.01 | 0.06 | 0.85 | 7.91 | 0.2862 | -0.0066 | |||
| LYV / Live Nation Entertainment, Inc. | 0.01 | 2.44 | 0.82 | 10.55 | 0.2766 | 0.0008 | |||
| MCO / Moody's Corporation | 0.00 | 13.61 | 0.80 | 7.87 | 0.2691 | -0.0060 | |||
| YUM / Yum! Brands, Inc. | 0.01 | 0.00 | 0.78 | 2.51 | 0.2627 | -0.0198 | |||
| CMG / Chipotle Mexican Grill, Inc. | 0.02 | 6.59 | 0.65 | -25.63 | 0.2201 | -0.1063 | |||
| NDAQ / Nasdaq, Inc. | 0.01 | 22.63 | 0.63 | 21.50 | 0.2141 | 0.0194 | |||
| PEG / Public Service Enterprise Group Incorporated | 0.01 | 7.78 | 0.63 | 6.81 | 0.2123 | -0.0069 | |||
| BSX / Boston Scientific Corporation | 0.01 | 7.76 | 0.62 | -2.05 | 0.2104 | -0.0266 | |||
| TTWO / Take-Two Interactive Software, Inc. | 0.00 | -5.38 | 0.61 | 0.66 | 0.2074 | -0.0199 | |||
| APD / Air Products and Chemicals, Inc. | 0.00 | 9.88 | 0.61 | 6.25 | 0.2072 | -0.0079 | |||
| LMT / Lockheed Martin Corporation | 0.00 | 17.46 | 0.59 | 26.82 | 0.1999 | 0.0257 | |||
| AJG / Arthur J. Gallagher & Co. | 0.00 | 3.92 | 0.53 | 0.38 | 0.1806 | -0.0175 | |||
| BRK.B / Berkshire Hathaway Inc. | 0.00 | 2.17 | 0.52 | 5.69 | 0.1761 | -0.0076 | |||
| TRV / The Travelers Companies, Inc. | 0.00 | 5.75 | 0.51 | 10.32 | 0.1737 | 0.0001 | |||
| MDLZ / Mondelez International, Inc. | 0.01 | -11.58 | 0.50 | -18.09 | 0.1685 | -0.0585 | |||
| UNP / Union Pacific Corporation | 0.00 | 11.07 | 0.49 | 14.12 | 0.1668 | 0.0056 | |||
| FTNT / Fortinet, Inc. | 0.01 | 0.00 | 0.49 | -20.52 | 0.1666 | -0.0645 | |||
| DKS / DICK'S Sporting Goods, Inc. | 0.00 | -1.21 | 0.49 | 10.88 | 0.1657 | 0.0010 | |||
| HUM / Humana Inc. | 0.00 | -1.06 | 0.48 | 5.23 | 0.1636 | -0.0078 | |||
| ORLY / O'Reilly Automotive, Inc. | 0.00 | 14.92 | 0.48 | 37.28 | 0.1609 | 0.0318 | |||
| NMM / Newmont Corporation | 0.01 | 0.00 | 0.48 | 44.82 | 0.1607 | 0.0382 | |||
| CMCSA / Comcast Corporation | 0.01 | 0.00 | 0.47 | -12.03 | 0.1586 | -0.0401 | |||
| MAR / Marriott International, Inc. | 0.00 | 0.00 | 0.46 | -4.59 | 0.1547 | -0.0243 | |||
| ISRG / Intuitive Surgical, Inc. | 0.00 | -3.86 | 0.43 | -20.80 | 0.1469 | -0.0579 | |||
| ABBV / AbbVie Inc. | 0.00 | 13.73 | 0.43 | 42.05 | 0.1453 | 0.0323 | |||
| INTU / Intuit Inc. | 0.00 | 0.00 | 0.43 | -13.18 | 0.1448 | -0.0394 | |||
| VRTX / Vertex Pharmaceuticals Incorporated | 0.00 | 0.00 | 0.43 | -11.96 | 0.1445 | -0.0367 | |||
| URI / United Rentals, Inc. | 0.00 | 0.00 | 0.41 | 26.99 | 0.1401 | 0.0181 | |||
| TPL / Texas Pacific Land Corporation | 0.00 | 0.00 | 0.41 | -11.52 | 0.1377 | -0.0342 | |||
| FI / Fiserv, Inc. | 0.00 | 6.34 | 0.40 | -20.40 | 0.1360 | -0.0527 | |||
| ECL / Ecolab Inc. | 0.00 | 4.21 | 0.40 | 5.84 | 0.1351 | -0.0056 | |||
| BK / The Bank of New York Mellon Corporation | 0.00 | 18.05 | 0.40 | 41.28 | 0.1345 | 0.0294 | |||
| CARR / Carrier Global Corporation | 0.01 | 0.00 | 0.40 | -18.48 | 0.1344 | -0.0473 | |||
| ADSK / Autodesk, Inc. | 0.00 | 0.00 | 0.39 | 2.62 | 0.1325 | -0.0099 | |||
| UPS / United Parcel Service, Inc. | 0.00 | 0.00 | 0.39 | -17.16 | 0.1323 | -0.0440 | |||
| TXRH / Texas Roadhouse, Inc. | 0.00 | 4.46 | 0.35 | -7.49 | 0.1172 | -0.0224 | |||
| FCX / Freeport-McMoRan Inc. | 0.01 | 0.00 | 0.34 | -9.55 | 0.1155 | -0.0253 | |||
| QQQ / Invesco QQQ Trust, Series 1 | 0.00 | 0.00 | 0.34 | 9.09 | 0.1137 | -0.0015 | |||
| COR / Cencora, Inc. | 0.00 | 0.00 | 0.32 | 4.28 | 0.1073 | -0.0063 | |||
| FCNCA / First Citizens BancShares, Inc. | 0.00 | 17.69 | 0.31 | 7.67 | 0.1047 | -0.0026 | |||
| IBM / International Business Machines Corporation | 0.00 | 5.00 | 0.31 | 0.65 | 0.1043 | -0.0102 | |||
| FBTC / Fidelity Wise Origin Bitcoin Fund | 0.00 | 0.00 | 0.31 | 6.23 | 0.1041 | -0.0040 | |||
| CHKP / Check Point Software Technologies Ltd. | 0.00 | 0.00 | 0.30 | -6.50 | 0.1022 | -0.0183 | |||
| NKE / NIKE, Inc. | 0.00 | 0.00 | 0.30 | -1.99 | 0.0999 | -0.0124 | |||
| OTIS / Otis Worldwide Corporation | 0.00 | 0.00 | 0.29 | -7.84 | 0.0996 | -0.0194 | |||
| IBIT / iShares Bitcoin Trust ETF | 0.00 | 0.00 | 0.29 | 6.23 | 0.0981 | -0.0038 | |||
| H / Hyatt Hotels Corporation | 0.00 | -0.73 | 0.29 | 0.70 | 0.0976 | -0.0091 | |||
| MET / MetLife, Inc. | 0.00 | 0.00 | 0.26 | 2.33 | 0.0896 | -0.0069 | |||
| NUE / Nucor Corporation | 0.00 | -12.75 | 0.26 | -8.65 | 0.0894 | -0.0187 | |||
| BA / The Boeing Company | 0.00 | 0.00 | 0.26 | 3.20 | 0.0873 | -0.0062 | |||
| AN / AutoNation, Inc. | 0.00 | 0.00 | 0.26 | 9.91 | 0.0864 | -0.0001 | |||
| KR / The Kroger Co. | 0.00 | 0.00 | 0.24 | -6.27 | 0.0811 | -0.0141 | |||
| MO / Altria Group, Inc. | 0.00 | 0.00 | 0.24 | 12.86 | 0.0802 | 0.0017 | |||
| LNG / Cheniere Energy, Inc. | 0.00 | -57.29 | 0.24 | -58.89 | 0.0800 | -0.1342 | |||
| ADBE / Adobe Inc. | 0.00 | 0.00 | 0.23 | -8.95 | 0.0794 | -0.0167 | |||
| CME / CME Group Inc. | 0.00 | -2.48 | 0.23 | -4.51 | 0.0789 | -0.0121 | |||
| TSLA / Tesla, Inc. | 0.00 | 0.23 | 0.0775 | 0.0775 | |||||
| SPY / SPDR S&P 500 ETF | 0.00 | -20.72 | 0.22 | -14.45 | 0.0741 | -0.0215 | |||
| WFC / Wells Fargo & Company | 0.00 | 0.21 | 0.0716 | 0.0716 | |||||
| SYK / Stryker Corporation | 0.00 | 0.21 | 0.0705 | 0.0705 | |||||
| GNTX / Gentex Corporation | 0.01 | 0.21 | 0.0704 | 0.0704 | |||||
| ULTA / Ulta Beauty, Inc. | 0.00 | 0.20 | 0.0682 | 0.0682 | |||||
| DE / Deere & Company | 0.00 | -100.00 | 0.00 | 0.0000 | |||||
| SKX / Skechers U.S.A., Inc. | 0.00 | -100.00 | 0.00 | 0.0000 | |||||
| SPGI / S&P Global Inc. | 0.00 | -100.00 | 0.00 | 0.0000 |