Estatísticas Básicas
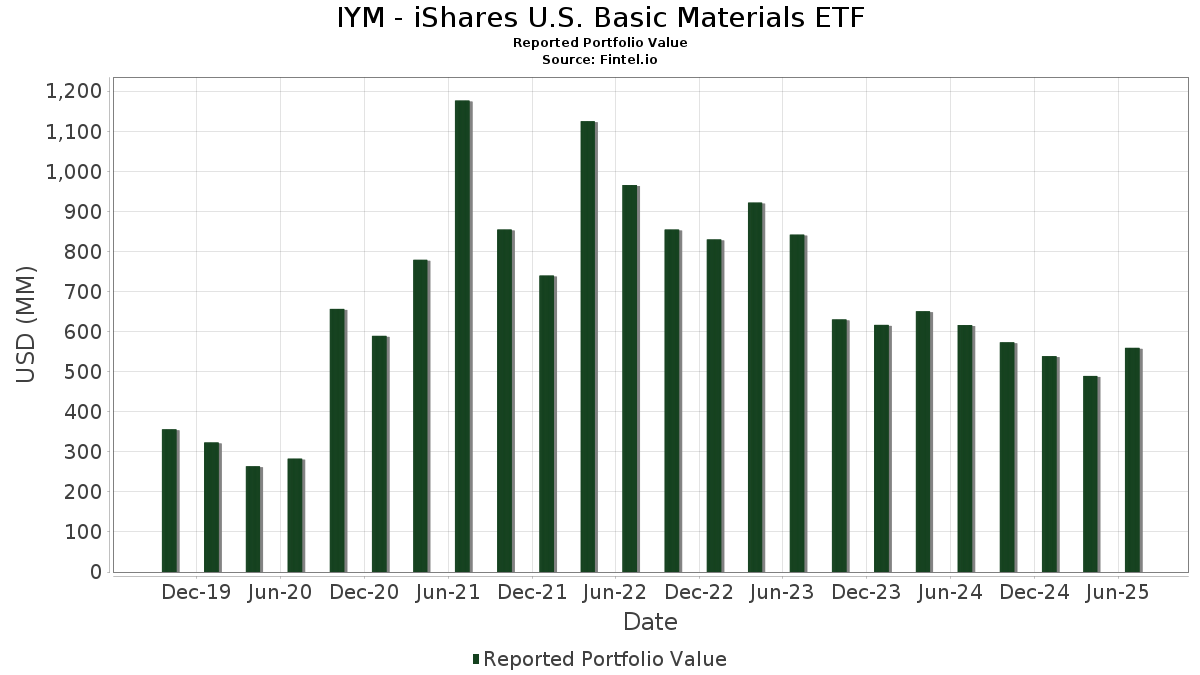
| Valor do Portfólio | $ 559,426,326 |
| Posições Atuais | 40 |
Últimas Participações, Desempenho, AUM (de 13F, 13D)
IYM - iShares U.S. Basic Materials ETF divulgou 40 participações totais em seus últimos arquivamentos da SEC. O valor mais recente da carteira é calculado como $ 559,426,326 USD. O Ativo Total Sob Gestão (AUM) é esse valor mais o caixa (que não é divulgado). As principais posições de IYM - iShares U.S. Basic Materials ETF são Linde plc (US:LIN) , Newmont Corporation (US:NEM) , Ecolab Inc. (US:ECL) , Air Products and Chemicals, Inc. (US:APD) , and Fastenal Company (US:FAST) . As novas posições de IYM - iShares U.S. Basic Materials ETF incluem AngloGold Ashanti plc (US:AU) , Mueller Industries, Inc. (US:MLI) , .
Maiores Aumentos Este Trimestre
Usamos a mudança na alocação do portfólio porque esta é a métrica mais significativa. As mudanças podem ser devido a operações ou mudanças nos preços das ações.
| Ativo | Ações (MM) |
Valor (MM$) |
% do Portfólio | Δ% do Portfólio |
|---|---|---|---|---|
| AU / AngloGold Ashanti plc | 0.34 | 15.84 | 2.8893 | 2.8893 |
| NEM / Newmont Corporation | 0.70 | 43.62 | 7.9546 | 2.4405 |
| CRS / Carpenter Technology Corporation | 0.04 | 10.35 | 1.8868 | 1.7147 |
| MLI / Mueller Industries, Inc. | 0.09 | 7.98 | 1.4554 | 1.4554 |
| US0669225197 / BlackRock Cash Funds: Institutional, SL Agency Shares | 11.47 | 11.47 | 2.0923 | 0.8622 |
| MP / MP Materials Corp. | 0.11 | 6.86 | 1.2502 | 0.6620 |
| NUE / Nucor Corporation | 0.14 | 19.88 | 3.6246 | 0.3538 |
| ROLL / RBC Bearings Inc. | 0.03 | 10.35 | 1.8874 | 0.1513 |
| AA / Alcoa Corporation | 0.22 | 6.68 | 1.2175 | 0.0924 |
| CLF / Cleveland-Cliffs Inc. | 0.42 | 4.41 | 0.8048 | 0.0666 |
Maiores Diminuições Este Trimestre
Usamos a mudança na alocação do portfólio porque esta é a métrica mais significativa. As mudanças podem ser devido a operações ou mudanças nos preços das ações.
| Ativo | Ações (MM) |
Valor (MM$) |
% do Portfólio | Δ% do Portfólio |
|---|---|---|---|---|
| FCX / Freeport-McMoRan Inc. | 0.59 | 23.57 | 4.2979 | -2.2399 |
| LIN / Linde plc | 0.26 | 121.01 | 22.0664 | -0.8724 |
| RGLD / Royal Gold, Inc. | 0.06 | 8.58 | 1.5639 | -0.6668 |
| AVY / Avery Dennison Corporation | 0.07 | 11.25 | 2.0518 | -0.4971 |
| RS / Reliance, Inc. | 0.05 | 13.20 | 2.4078 | -0.4719 |
| IFF / International Flavors & Fragrances Inc. | 0.21 | 14.58 | 2.6587 | -0.3515 |
| STLD / Steel Dynamics, Inc. | 0.12 | 14.87 | 2.7125 | -0.3491 |
| ECL / Ecolab Inc. | 0.16 | 41.21 | 7.5153 | -0.3477 |
| 2CU / The Chemours Company | 0.00 | 0.00 | -0.3427 | |
| EMN / Eastman Chemical Company | 0.10 | 7.18 | 1.3101 | -0.3400 |
Arquivamentos 13F e Fundo
Este formulário foi arquivado em 2025-09-24 para o período de relatório 2025-07-31. Clique no ícone de link para ver o histórico completo da transação.
Atualize para desbloquear dados premium e exportar para Excel ![]() .
.
| Ativo | Tipo | Preço Médio por Ação | Ações (MM) |
ΔAções (%) |
Valor ($MM) |
ΔAções (%) |
Portfólio (%) |
ΔPortfólio (%) |
|
|---|---|---|---|---|---|---|---|---|---|
| LIN / Linde plc | 0.26 | 7.34 | 121.01 | 9.00 | 22.0664 | -0.8724 | |||
| NEM / Newmont Corporation | 0.70 | 38.67 | 43.62 | 63.47 | 7.9546 | 2.4405 | |||
| ECL / Ecolab Inc. | 0.16 | 4.03 | 41.21 | 8.30 | 7.5153 | -0.3477 | |||
| APD / Air Products and Chemicals, Inc. | 0.14 | 4.60 | 40.46 | 11.08 | 7.3780 | -0.1481 | |||
| FAST / Fastenal Company | 0.52 | 92.87 | 24.06 | 9.88 | 4.3868 | -0.1371 | |||
| FCX / Freeport-McMoRan Inc. | 0.59 | -33.30 | 23.57 | -25.51 | 4.2979 | -2.2399 | |||
| NUE / Nucor Corporation | 0.14 | 4.77 | 19.88 | 25.57 | 3.6246 | 0.3538 | |||
| IP / International Paper Company | 0.36 | 10.88 | 16.69 | 13.45 | 3.0439 | 0.0038 | |||
| AU / AngloGold Ashanti plc | 0.34 | 15.84 | 2.8893 | 2.8893 | |||||
| STLD / Steel Dynamics, Inc. | 0.12 | 2.08 | 14.87 | 0.39 | 2.7125 | -0.3491 | |||
| IFF / International Flavors & Fragrances Inc. | 0.21 | 10.55 | 14.58 | 0.08 | 2.6587 | -0.3515 | |||
| CF / CF Industries Holdings, Inc. | 0.14 | -8.54 | 13.26 | 8.34 | 2.4176 | -0.1111 | |||
| RS / Reliance, Inc. | 0.05 | -5.88 | 13.20 | -5.26 | 2.4078 | -0.4719 | |||
| LYB / LyondellBasell Industries N.V. | 0.22 | 10.84 | 12.79 | 10.31 | 2.3331 | -0.0635 | |||
| US0669225197 / BlackRock Cash Funds: Institutional, SL Agency Shares | 11.47 | 92.74 | 11.47 | 92.73 | 2.0923 | 0.8622 | |||
| AVY / Avery Dennison Corporation | 0.07 | -6.97 | 11.25 | -8.79 | 2.0518 | -0.4971 | |||
| ROLL / RBC Bearings Inc. | 0.03 | 4.50 | 10.35 | 23.20 | 1.8874 | 0.1513 | |||
| CRS / Carpenter Technology Corporation | 0.04 | 90.58 | 10.35 | 2,028.81 | 1.8868 | 1.7147 | |||
| MOS / The Mosaic Company | 0.27 | -4.38 | 9.80 | 13.27 | 1.7864 | -0.0007 | |||
| RGLD / Royal Gold, Inc. | 0.06 | -4.14 | 8.58 | -20.56 | 1.5639 | -0.6668 | |||
| MLI / Mueller Industries, Inc. | 0.09 | 7.98 | 1.4554 | 1.4554 | |||||
| EMN / Eastman Chemical Company | 0.10 | -4.59 | 7.18 | -10.03 | 1.3101 | -0.3400 | |||
| ALB / Albemarle Corporation | 0.10 | -4.02 | 6.87 | 11.23 | 1.2535 | -0.0235 | |||
| MP / MP Materials Corp. | 0.11 | -4.21 | 6.86 | 140.86 | 1.2502 | 0.6620 | |||
| AA / Alcoa Corporation | 0.22 | 0.36 | 6.68 | 22.61 | 1.2175 | 0.0924 | |||
| SCCO / Southern Copper Corporation | 0.07 | -10.85 | 6.63 | -6.23 | 1.2098 | -0.2522 | |||
| CE / Celanese Corporation | 0.10 | -1.99 | 5.02 | 15.02 | 0.9163 | 0.0135 | |||
| ESI / Element Solutions Inc | 0.19 | -3.58 | 4.58 | 11.49 | 0.8355 | -0.0137 | |||
| CLF / Cleveland-Cliffs Inc. | 0.42 | -3.24 | 4.41 | 23.54 | 0.8048 | 0.0666 | |||
| FMC / FMC Corporation | 0.11 | -4.52 | 4.18 | -11.07 | 0.7616 | -0.2089 | |||
| HXL / Hexcel Corporation | 0.07 | -5.81 | 4.13 | 16.43 | 0.7534 | 0.0201 | |||
| TKR / The Timken Company | 0.05 | -7.25 | 4.10 | 9.83 | 0.7482 | -0.0236 | |||
| NEU / NewMarket Corporation | 0.01 | -15.71 | 3.51 | -5.88 | 0.6392 | -0.1304 | |||
| SMG / The Scotts Miracle-Gro Company | 0.04 | -2.67 | 2.36 | 21.05 | 0.4301 | 0.0275 | |||
| 0LVK / Westlake Corporation | 0.03 | -4.54 | 2.28 | -18.11 | 0.4166 | -0.1598 | |||
| ASH / Ashland Inc. | 0.04 | -4.75 | 2.08 | -9.73 | 0.3793 | -0.0967 | |||
| OLN / Olin Corporation | 0.10 | -4.78 | 1.87 | -16.60 | 0.3419 | -0.1225 | |||
| HUN / Huntsman Corporation | 0.14 | -3.41 | 1.38 | -29.63 | 0.2508 | -0.1530 | |||
| US0669224778 / BlackRock Cash Funds: Treasury, SL Agency Shares | 0.47 | -44.27 | 0.47 | -44.30 | 0.0866 | -0.0895 | |||
| 2CU / The Chemours Company | 0.00 | -100.00 | 0.00 | -100.00 | -0.3427 | ||||
| XAB MATERIALS SEP25 / DE (N/A) | -0.01 | -0.0011 | -0.0011 |