Estatísticas Básicas
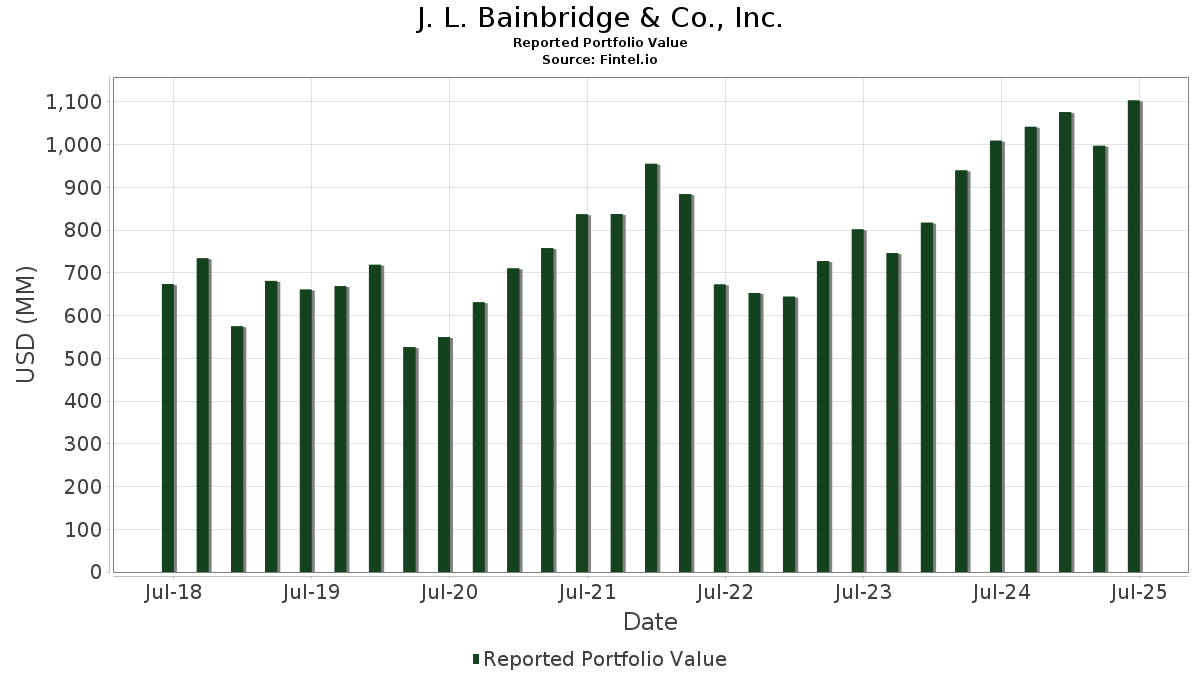
| Valor do Portfólio | $ 1,199,162,612 |
| Posições Atuais | 107 |
Últimas Participações, Desempenho, AUM (de 13F, 13D)
J. L. Bainbridge & Co., Inc. divulgou 107 participações totais em seus últimos arquivamentos da SEC. O valor mais recente da carteira é calculado como $ 1,199,162,612 USD. O Ativo Total Sob Gestão (AUM) é esse valor mais o caixa (que não é divulgado). As principais posições de J. L. Bainbridge & Co., Inc. são Microsoft Corporation (US:MSFT) , Apple Inc. (US:AAPL) , GS Connect S&P GSCI Enhanced Commodity Total Return ETN (US:GSCE) , Alphabet Inc. (US:GOOGL) , and Eaton Corporation plc (US:ETN) . As novas posições de J. L. Bainbridge & Co., Inc. incluem SPDR S&P MidCap 400 ETF Trust (US:MDY) , The Select Sector SPDR Trust - The Technology Select Sector SPDR Fund (US:XLK) , Caterpillar Inc. (US:CAT) , Nuveen New York Quality Municipal Income Fund (US:NAN) , and .
Maiores Aumentos Este Trimestre
Usamos a mudança na alocação do portfólio porque esta é a métrica mais significativa. As mudanças podem ser devido a operações ou mudanças nos preços das ações.
| Ativo | Ações (MM) |
Valor (MM$) |
% do Portfólio | Δ% do Portfólio |
|---|---|---|---|---|
| 0.06 | 47.14 | 3.9310 | 3.8940 | |
| 0.27 | 64.78 | 5.3894 | 1.0877 | |
| 0.48 | 122.68 | 10.2063 | 0.9348 | |
| 0.21 | 51.87 | 4.3152 | 0.8524 | |
| 0.16 | 44.06 | 3.6656 | 0.3638 | |
| 0.59 | 36.12 | 3.0047 | 0.3457 | |
| 0.11 | 33.08 | 2.7516 | 0.1457 | |
| 0.09 | 71.43 | 5.9421 | 0.1380 | |
| 0.18 | 30.49 | 2.5429 | 0.0902 | |
| 0.00 | 1.95 | 0.1622 | 0.0374 |
Maiores Diminuições Este Trimestre
Usamos a mudança na alocação do portfólio porque esta é a métrica mais significativa. As mudanças podem ser devido a operações ou mudanças nos preços das ações.
| Ativo | Ações (MM) |
Valor (MM$) |
% do Portfólio | Δ% do Portfólio |
|---|---|---|---|---|
| 0.00 | 0.42 | 0.0346 | -1.3581 | |
| 0.26 | 34.03 | 2.8314 | -1.1175 | |
| 0.51 | 28.90 | 2.4043 | -1.0180 | |
| 0.32 | 164.85 | 13.7474 | -0.7454 | |
| 0.12 | 35.10 | 2.9269 | -0.5774 | |
| 0.06 | 14.17 | 1.1791 | -0.4635 | |
| 0.07 | 50.32 | 4.1865 | -0.4214 | |
| 0.24 | 52.01 | 4.3372 | -0.4120 | |
| 0.21 | 24.36 | 2.0264 | -0.3796 | |
| 0.16 | 59.86 | 4.9803 | -0.2292 |
Arquivamentos 13F e Fundo
Este formulário foi arquivado em 2025-10-17 para o período de relatório 2025-09-30. Clique no ícone de link para ver o histórico completo da transação.
Atualize para desbloquear dados premium e exportar para Excel ![]() .
.
| Ativo | Tipo | Preço Médio por Ação | Ações (MM) |
ΔAções (%) |
Valor ($MM) |
ΔAções (%) |
Portfólio (%) |
ΔPortfólio (%) |
|
|---|---|---|---|---|---|---|---|---|---|
| MSFT / Microsoft Corporation | 0.32 | -0.99 | 164.85 | 3.10 | 13.7474 | -0.7454 | |||
| AAPL / Apple Inc. | 0.48 | -3.36 | 122.68 | 19.93 | 10.2063 | 0.9348 | |||
| GSCE / GS Connect S&P GSCI Enhanced Commodity Total Return ETN | 0.09 | -0.87 | 71.43 | 11.54 | 5.9421 | 0.1380 | |||
| GOOGL / Alphabet Inc. | 0.27 | -1.05 | 64.78 | 36.50 | 5.3894 | 1.0877 | |||
| ETN / Eaton Corporation plc | 0.16 | -0.65 | 59.86 | 4.16 | 4.9803 | -0.2292 | |||
| AMZN / Amazon.com, Inc. | 0.24 | -0.82 | 52.01 | -0.74 | 4.3372 | -0.4120 | |||
| GOOG / Alphabet Inc. | 0.21 | -1.11 | 51.87 | 35.77 | 4.3152 | 0.8524 | |||
| META / Meta Platforms, Inc. | 0.07 | -0.51 | 50.32 | -1.01 | 4.1865 | -0.4214 | |||
| LLY / Eli Lilly and Company | 0.06 | 11,690.46 | 47.14 | 11,453.68 | 3.9310 | 3.8940 | |||
| TSM / Taiwan Semiconductor Manufacturing Company Limited - Depositary Receipt (Common Stock) | 0.16 | -1.91 | 44.06 | 20.95 | 3.6656 | 0.3638 | |||
| SMAX / iShares Trust - iShares Large Cap Max Buffer Sep ETF | 1.36 | -1.50 | 36.41 | 1.29 | 3.0287 | -0.2289 | |||
| GM / General Motors Company | 0.59 | -0.63 | 36.12 | 23.11 | 3.0047 | 0.3457 | |||
| CI / The Cigna Group | 0.12 | 4.11 | 35.10 | -9.22 | 2.9269 | -0.5774 | |||
| QCOM / QUALCOMM Incorporated | 0.21 | 0.42 | 34.99 | 4.90 | 2.9105 | -0.1124 | |||
| FI / Fiserv, Inc. | 0.26 | 4.46 | 34.03 | -21.88 | 2.8314 | -1.1175 | |||
| GE / General Electric Company | 0.11 | -1.57 | 33.08 | 15.04 | 2.7516 | 0.1457 | |||
| BX / Blackstone Inc. | 0.18 | -1.34 | 30.49 | 12.69 | 2.5429 | 0.0902 | |||
| AXP / American Express Company | 0.09 | -0.92 | 30.27 | 3.17 | 2.5179 | -0.1409 | |||
| DAL / Delta Air Lines, Inc. | 0.51 | -33.67 | 28.90 | -23.46 | 2.4043 | -1.0180 | |||
| MAXJ / iShares Trust - iShares Large Cap Max Buffer Jun ETF | 0.96 | 1.51 | 27.00 | 3.50 | 2.2464 | -0.1182 | |||
| BRK.B / Berkshire Hathaway Inc. | 0.05 | 2.98 | 25.55 | 6.58 | 2.1256 | -0.0473 | |||
| DIS / The Walt Disney Company | 0.21 | -0.62 | 24.36 | -8.24 | 2.0264 | -0.3796 | |||
| CRM / Salesforce, Inc. | 0.06 | -10.02 | 14.17 | -21.80 | 1.1791 | -0.4635 | |||
| NEE / NextEra Energy, Inc. | 0.12 | -1.21 | 9.15 | 7.43 | 0.7611 | -0.0108 | |||
| GE / General Electric Company | Call | 0.02 | 0.00 | 6.02 | 16.88 | 0.5005 | 0.0339 | ||
| CI / The Cigna Group | Call | 0.02 | 0.00 | 5.76 | -12.80 | 0.4808 | -0.1185 | ||
| USB / U.S. Bancorp | 0.10 | 0.00 | 4.68 | 6.79 | 0.3897 | -0.0078 | |||
| MMAX / iShares Trust - iShares Large Cap Max Buffer Mar ETF | 0.16 | 3.79 | 4.13 | 5.60 | 0.3437 | -0.0109 | |||
| NVDA / NVIDIA Corporation | 0.02 | -3.53 | 3.48 | 13.94 | 0.2903 | 0.0134 | |||
| VTI / Vanguard Index Funds - Vanguard Total Stock Market ETF | 0.01 | 9.91 | 3.11 | 18.68 | 0.2585 | 0.0212 | |||
| GM / General Motors Company | Call | 0.05 | 0.00 | 3.05 | 23.90 | 0.2536 | 0.0306 | ||
| QQQ / Invesco QQQ Trust, Series 1 | 0.00 | -0.41 | 2.47 | 8.37 | 0.2057 | -0.0011 | |||
| BLK / BlackRock, Inc. | 0.00 | -4.94 | 2.02 | 5.65 | 0.1684 | -0.0049 | |||
| TSLA / Tesla, Inc. | 0.00 | 0.88 | 1.95 | 41.25 | 0.1622 | 0.0374 | |||
| SCHW / The Charles Schwab Corporation | 0.02 | -0.70 | 1.49 | 3.91 | 0.1239 | -0.0060 | |||
| SPY / SPDR S&P 500 ETF | 0.00 | 29.82 | 1.46 | 39.92 | 0.1214 | 0.0269 | |||
| AVGO / Broadcom Inc. | 0.00 | 1.22 | 1.45 | 21.17 | 0.1210 | 0.0122 | |||
| JNJ / Johnson & Johnson | 0.01 | -13.23 | 1.38 | 5.35 | 0.1150 | -0.0037 | |||
| PG / The Procter & Gamble Company | 0.01 | -9.55 | 1.26 | -12.72 | 0.1051 | -0.0262 | |||
| DAL / Delta Air Lines, Inc. | Call | 0.02 | 0.00 | 1.14 | 15.46 | 0.0944 | 0.0053 | ||
| HD / The Home Depot, Inc. | 0.00 | 1.65 | 1.05 | 12.41 | 0.0875 | 0.0027 | |||
| TCBK / TriCo Bancshares | 0.02 | 0.00 | 1.02 | 9.67 | 0.0850 | 0.0006 | |||
| WMT / Walmart Inc. | 0.01 | 2.56 | 0.99 | 8.04 | 0.0830 | -0.0005 | |||
| JPM / JPMorgan Chase & Co. | 0.00 | -4.08 | 0.95 | 4.40 | 0.0792 | -0.0033 | |||
| VGT / Vanguard World Fund - Vanguard Information Technology ETF | 0.00 | 0.49 | 0.77 | 13.24 | 0.0643 | 0.0026 | |||
| COST / Costco Wholesale Corporation | 0.00 | 3.15 | 0.64 | -3.64 | 0.0529 | -0.0069 | |||
| MCD / McDonald's Corporation | 0.00 | -0.29 | 0.63 | 3.65 | 0.0522 | -0.0025 | |||
| NFLX / Netflix, Inc. | 0.00 | 1.59 | 0.61 | -9.09 | 0.0508 | -0.0101 | |||
| T / AT&T Inc. | 0.02 | -1.49 | 0.59 | -3.90 | 0.0493 | -0.0064 | |||
| IBIT / iShares Bitcoin Trust ETF | 0.01 | 51.65 | 0.58 | 60.88 | 0.0486 | 0.0157 | |||
| PM / Philip Morris International Inc. | 0.00 | 3.66 | 0.57 | -7.79 | 0.0474 | -0.0084 | |||
| FNDA / Schwab Strategic Trust - Schwab Fundamental U.S. Small Company ETF | 0.02 | 1.82 | 0.57 | 10.57 | 0.0471 | 0.0008 | |||
| FNDX / Schwab Strategic Trust - Schwab Fundamental U.S. Large Company ETF | 0.02 | 3.54 | 0.56 | 11.02 | 0.0470 | 0.0009 | |||
| CVX / Chevron Corporation | 0.00 | -15.47 | 0.56 | -8.31 | 0.0470 | -0.0087 | |||
| XOM / Exxon Mobil Corporation | 0.00 | -18.33 | 0.52 | -14.59 | 0.0434 | -0.0119 | |||
| IVV / iShares Trust - iShares Core S&P 500 ETF | 0.00 | -1.03 | 0.52 | 6.63 | 0.0430 | -0.0008 | |||
| SCHX / Schwab Strategic Trust - Schwab U.S. Large-Cap ETF | 0.02 | 2.96 | 0.51 | 10.87 | 0.0425 | 0.0008 | |||
| BAC / Bank of America Corporation | 0.01 | 0.00 | 0.50 | 8.99 | 0.0415 | 0.0001 | |||
| SCHA / Schwab Strategic Trust - Schwab U.S. Small-Cap ETF | 0.02 | 1.85 | 0.49 | 12.21 | 0.0406 | 0.0012 | |||
| ABBV / AbbVie Inc. | 0.00 | -0.73 | 0.44 | 23.66 | 0.0366 | 0.0044 | |||
| SO / The Southern Company | 0.00 | 0.09 | 0.43 | 3.37 | 0.0357 | -0.0020 | |||
| BIIB / Biogen Inc. | 0.00 | -97.57 | 0.42 | -97.30 | 0.0346 | -1.3581 | |||
| PLTR / Palantir Technologies Inc. | 0.00 | -6.13 | 0.40 | 25.87 | 0.0333 | 0.0045 | |||
| IJH / iShares Trust - iShares Core S&P Mid-Cap ETF | 0.01 | -7.61 | 0.40 | -2.70 | 0.0331 | -0.0039 | |||
| KO / The Coca-Cola Company | 0.01 | 0.67 | 0.38 | -5.71 | 0.0317 | -0.0048 | |||
| ORCL / Oracle Corporation | 0.00 | -2.44 | 0.37 | 25.76 | 0.0310 | 0.0042 | |||
| RY / Royal Bank of Canada | 0.00 | 0.00 | 0.37 | 12.20 | 0.0306 | 0.0008 | |||
| IBDQ / iShares Trust - iShares iBonds Dec 2025 Term Corporate ETF | 0.01 | -0.67 | 0.35 | -0.85 | 0.0293 | -0.0028 | |||
| COP / ConocoPhillips | 0.00 | -7.61 | 0.34 | -2.55 | 0.0287 | -0.0034 | |||
| RYAM / Rayonier Advanced Materials Inc. | 0.05 | 0.00 | 0.33 | 88.44 | 0.0271 | 0.0114 | |||
| ZBRA / Zebra Technologies Corporation | 0.00 | 0.00 | 0.32 | -3.87 | 0.0269 | -0.0035 | |||
| TIP / iShares Trust - iShares TIPS Bond ETF | 0.00 | -17.16 | 0.32 | -16.36 | 0.0268 | -0.0081 | |||
| GEV / GE Vernova Inc. | 0.00 | -18.46 | 0.31 | -5.17 | 0.0260 | -0.0039 | |||
| V / Visa Inc. | 0.00 | 3.18 | 0.31 | -0.64 | 0.0259 | -0.0025 | |||
| MO / Altria Group, Inc. | 0.00 | 0.88 | 0.31 | 13.60 | 0.0258 | 0.0011 | |||
| NSC / Norfolk Southern Corporation | 0.00 | 0.00 | 0.30 | 17.65 | 0.0250 | 0.0018 | |||
| IGSB / iShares Trust - iShares 1-5 Year Investment Grade Corporate Bond ETF | 0.01 | -2.23 | 0.30 | -1.67 | 0.0246 | -0.0026 | |||
| MDY / SPDR S&P MidCap 400 ETF Trust | 0.00 | 0.29 | 0.0241 | 0.0241 | |||||
| FNDF / Schwab Strategic Trust - Schwab Fundamental International Equity ETF | 0.01 | 3.99 | 0.29 | 11.28 | 0.0239 | 0.0006 | |||
| SMH / VanEck ETF Trust - VanEck Semiconductor ETF | 0.00 | 0.00 | 0.29 | 17.21 | 0.0238 | 0.0016 | |||
| EMR / Emerson Electric Co. | 0.00 | -2.90 | 0.29 | -4.36 | 0.0237 | -0.0033 | |||
| JEPI / J.P. Morgan Exchange-Traded Fund Trust - JPMorgan Equity Premium Income ETF | 0.00 | -0.82 | 0.28 | -0.35 | 0.0235 | -0.0022 | |||
| SBUX / Starbucks Corporation | 0.00 | -0.27 | 0.28 | -7.92 | 0.0233 | -0.0042 | |||
| HIG / The Hartford Insurance Group, Inc. | 0.00 | 0.00 | 0.27 | 5.38 | 0.0228 | -0.0008 | |||
| XYL / Xylem Inc. | 0.00 | 0.00 | 0.27 | 14.23 | 0.0228 | 0.0011 | |||
| ITT / ITT Inc. | 0.00 | 0.00 | 0.27 | 13.81 | 0.0228 | 0.0011 | |||
| VZ / Verizon Communications Inc. | 0.01 | -8.28 | 0.27 | -6.97 | 0.0223 | -0.0037 | |||
| LMT / Lockheed Martin Corporation | 0.00 | -10.67 | 0.25 | -3.91 | 0.0205 | -0.0027 | |||
| IAU / iShares Gold Trust | 0.00 | -12.01 | 0.25 | 2.51 | 0.0205 | -0.0012 | |||
| CSCO / Cisco Systems, Inc. | 0.00 | 0.06 | 0.24 | -1.62 | 0.0203 | -0.0021 | |||
| AMLP / ALPS ETF Trust - Alerian MLP ETF | 0.01 | 0.00 | 0.24 | -4.02 | 0.0199 | -0.0027 | |||
| IWM / iShares Trust - iShares Russell 2000 ETF | 0.00 | -5.51 | 0.23 | 5.94 | 0.0193 | -0.0005 | |||
| DHS / WisdomTree Trust - WisdomTree U.S. High Dividend Fund | 0.00 | 0.00 | 0.23 | 4.98 | 0.0193 | -0.0007 | |||
| IBDS / iShares Trust - iShares iBonds Dec 2027 Term Corporate ETF | 0.01 | -1.05 | 0.22 | -0.44 | 0.0186 | -0.0018 | |||
| IBDR / iShares Trust - iShares iBonds Dec 2026 Term Corporate ETF | 0.01 | -1.06 | 0.22 | -0.89 | 0.0185 | -0.0018 | |||
| XLK / The Select Sector SPDR Trust - The Technology Select Sector SPDR Fund | 0.00 | 0.22 | 0.0181 | 0.0181 | |||||
| SCHI / Schwab Strategic Trust - Schwab 5-10 Year Corporate Bond ETF | 0.01 | 0.21 | 0.0176 | 0.0176 | |||||
| VMBS / Vanguard Scottsdale Funds - Vanguard Mortgage-Backed Securities ETF | 0.00 | -0.22 | 0.21 | 1.46 | 0.0174 | -0.0013 | |||
| MRK / Merck & Co., Inc. | 0.00 | 0.21 | 0.0173 | 0.0173 | |||||
| IJR / iShares Trust - iShares Core S&P Small-Cap ETF | 0.00 | -10.79 | 0.21 | -2.83 | 0.0172 | -0.0021 | |||
| SCHF / Schwab Strategic Trust - Schwab International Equity ETF | 0.01 | 0.21 | 0.0172 | 0.0172 | |||||
| CAT / Caterpillar Inc. | 0.00 | 0.20 | 0.0167 | 0.0167 | |||||
| ESBA / Empire State Realty OP, L.P. - Limited Partnership | 0.02 | 0.00 | 0.18 | -5.26 | 0.0150 | -0.0023 | |||
| JPC / Nuveen Preferred & Income Opportunities Fund | 0.02 | 0.00 | 0.16 | 1.97 | 0.0130 | -0.0008 | |||
| NAN / Nuveen New York Quality Municipal Income Fund | 0.01 | 0.12 | 0.0097 | 0.0097 | |||||
| PLUG / Plug Power Inc. | 0.02 | 69.37 | 0.05 | 176.47 | 0.0039 | 0.0023 | |||
| ATOS / Atossa Therapeutics, Inc. | 0.01 | 0.00 | 0.01 | 0.00 | 0.0008 | -0.0000 | |||
| IBM / International Business Machines Corporation | 0.00 | -100.00 | 0.00 | 0.0000 | |||||
| SLF / Sun Life Financial Inc. | 0.00 | -100.00 | 0.00 | 0.0000 | |||||
| HON / Honeywell International Inc. | 0.00 | -100.00 | 0.00 | 0.0000 | |||||
| OTIS / Otis Worldwide Corporation | 0.00 | -100.00 | 0.00 | 0.0000 | |||||
| BDX / Becton, Dickinson and Company | 0.00 | -100.00 | 0.00 | 0.0000 |