Estatísticas Básicas
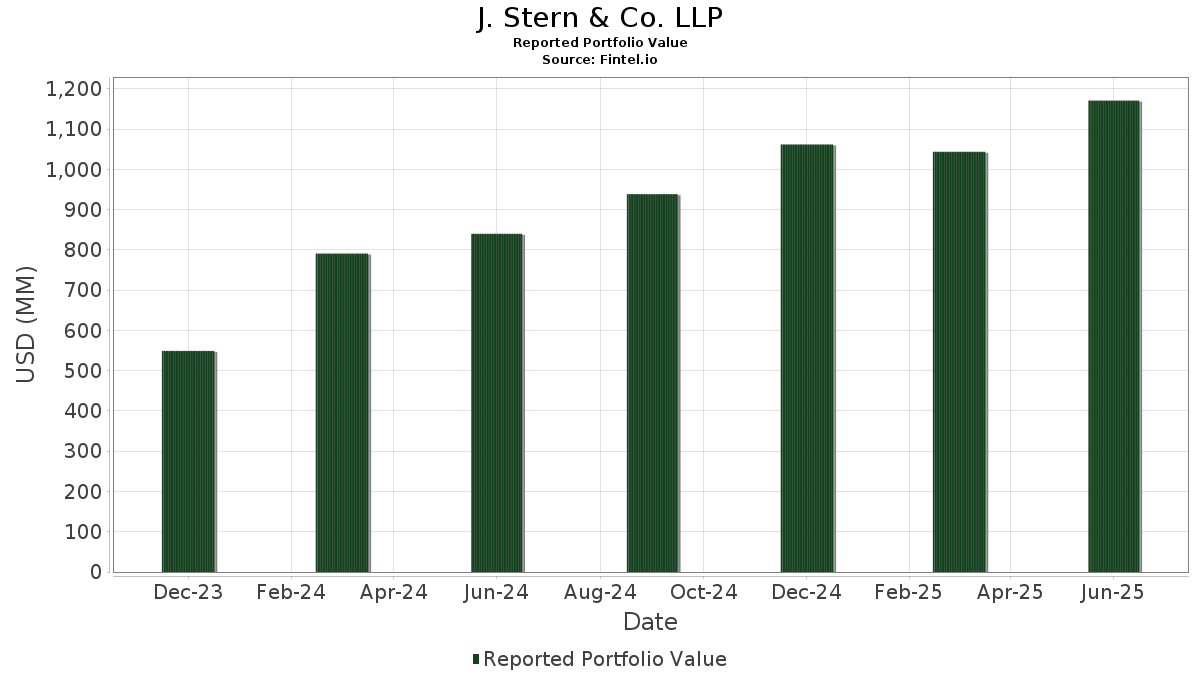
| Valor do Portfólio | $ 1,173,366,950 |
| Posições Atuais | 43 |
Últimas Participações, Desempenho, AUM (de 13F, 13D)
J. Stern & Co. LLP divulgou 43 participações totais em seus últimos arquivamentos da SEC. O valor mais recente da carteira é calculado como $ 1,173,366,950 USD. O Ativo Total Sob Gestão (AUM) é esse valor mais o caixa (que não é divulgado). As principais posições de J. Stern & Co. LLP são NVIDIA Corporation (US:NVDA) , Alphabet Inc. (US:GOOG) , Amazon.com, Inc. (US:AMZN) , Amphenol Corporation (US:APH) , and Mastercard Incorporated (US:MA) . As novas posições de J. Stern & Co. LLP incluem TE Connectivity plc (US:TEL) , .
Maiores Aumentos Este Trimestre
Usamos a mudança na alocação do portfólio porque esta é a métrica mais significativa. As mudanças podem ser devido a operações ou mudanças nos preços das ações.
| Ativo | Ações (MM) |
Valor (MM$) |
% do Portfólio | Δ% do Portfólio |
|---|---|---|---|---|
| 48.05 | 48.05 | 4.0954 | 3.5792 | |
| 112.09 | 112.09 | 9.5530 | 2.3259 | |
| 37.69 | 37.69 | 3.2119 | 1.2685 | |
| 53.21 | 53.21 | 4.5347 | 0.8183 | |
| 31.51 | 31.51 | 2.6854 | 0.6952 | |
| 54.11 | 54.11 | 4.6113 | 0.6693 | |
| 62.42 | 62.42 | 5.3199 | 0.5210 | |
| 47.39 | 47.39 | 4.0384 | 0.5207 | |
| 87.98 | 87.98 | 7.4983 | 0.4360 | |
| 72.60 | 72.60 | 6.1871 | 0.3614 |
Maiores Diminuições Este Trimestre
Usamos a mudança na alocação do portfólio porque esta é a métrica mais significativa. As mudanças podem ser devido a operações ou mudanças nos preços das ações.
| Ativo | Ações (MM) |
Valor (MM$) |
% do Portfólio | Δ% do Portfólio |
|---|---|---|---|---|
| 125.76 | 125.76 | 10.7179 | -2.1394 | |
| 59.03 | 59.03 | 5.0309 | -1.5800 | |
| 69.65 | 69.65 | 5.9359 | -1.3112 | |
| 76.77 | 76.77 | 6.5427 | -0.9958 | |
| 0.33 | 0.33 | 0.0280 | -0.7594 | |
| 3.46 | 3.46 | 0.2948 | -0.5977 | |
| 2.95 | 2.95 | 0.2517 | -0.5134 | |
| 3.38 | 3.38 | 0.2879 | -0.4048 | |
| 2.30 | 2.30 | 0.1960 | -0.3916 | |
| 2.54 | 2.54 | 0.2166 | -0.3696 |
Arquivamentos 13F e Fundo
Este formulário foi arquivado em 2026-02-24 para o período de relatório 2025-12-31. Clique no ícone de link para ver o histórico completo da transação.
Atualize para desbloquear dados premium e exportar para Excel ![]() .
.
| Ativo | Tipo | Preço Médio por Ação | Ações (MM) |
ΔAções (%) |
Valor ($MM) |
ΔValor (%) |
Portfólio (%) |
ΔPortfólio (%) |
|
|---|---|---|---|---|---|---|---|---|---|
| NVDA / NVIDIA Corporation | 125.76 | 13,709.13 | 125.76 | -25.99 | 10.7179 | -2.1394 | |||
| GOOG / Alphabet Inc. | 112.09 | 28,482.76 | 112.09 | 17.36 | 9.5530 | 2.3259 | |||
| AMZN / Amazon.com, Inc. | 87.98 | 20,598.04 | 87.98 | -5.73 | 7.4983 | 0.4360 | |||
| APH / Amphenol Corporation | 76.77 | 9,435.76 | 76.77 | -22.94 | 6.5427 | -0.9958 | |||
| MA / Mastercard Incorporated | 72.60 | 53,534.98 | 72.60 | -5.71 | 6.1871 | 0.3614 | |||
| META / Meta Platforms, Inc. | 69.65 | 53,305.25 | 69.65 | -27.28 | 5.9359 | -1.3112 | |||
| RTX / RTX Corporation | 62.42 | 16,369.45 | 62.42 | -1.58 | 5.3199 | 0.5210 | |||
| ETN / Eaton Corporation plc | 59.03 | 25,186.27 | 59.03 | -32.43 | 5.0309 | -1.5800 | |||
| ICE / Intercontinental Exchange, Inc. | 54.11 | 17,398.10 | 54.11 | 3.86 | 4.6113 | 0.6693 | |||
| HON / Honeywell International Inc. | 53.21 | 22,704.59 | 53.21 | 8.34 | 4.5347 | 0.8183 | |||
| NKE / NIKE, Inc. | 48.05 | 49,010.42 | 48.05 | 604.29 | 4.0954 | 3.5792 | |||
| CRM / Salesforce, Inc. | 47.39 | 24,056.68 | 47.39 | 1.93 | 4.0384 | 0.5207 | |||
| XYL / Xylem Inc. | 45.45 | 12,326.60 | 45.45 | -15.75 | 3.8733 | -0.2086 | |||
| ABT / Abbott Laboratories | 39.32 | 12,439.63 | 39.32 | -6.38 | 3.3510 | 0.1731 | |||
| OTIS / Otis Worldwide Corporation | 38.62 | 8,654.19 | 38.62 | -4.25 | 3.2914 | 0.2393 | |||
| DIS / The Walt Disney Company | 38.14 | 9,060.06 | 38.14 | -20.00 | 3.2501 | -0.3569 | |||
| AMT / American Tower Corporation | 37.69 | 28,121.07 | 37.69 | 46.74 | 3.2119 | 1.2685 | |||
| TMO / Thermo Fisher Scientific Inc. | 31.51 | 58,006.35 | 31.51 | 19.80 | 2.6854 | 0.6952 | |||
| ZTS / Zoetis Inc. | 24.07 | 12,431.23 | 24.07 | -14.36 | 2.0513 | -0.0753 | |||
| BRK.B / Berkshire Hathaway Inc. | 4.90 | 50,165.00 | 4.90 | -0.02 | 0.4179 | 0.0468 | |||
| EL / The Estée Lauder Companies Inc. | 4.09 | 4,281.25 | 4.09 | -50.29 | 0.3490 | -0.2742 | |||
| LLY / Eli Lilly and Company | 4.05 | 46,191.26 | 4.05 | -39.33 | 0.3449 | -0.1598 | |||
| LRCX / Lam Research Corporation | 3.46 | 3,826.92 | 3.46 | -70.67 | 0.2948 | -0.5977 | |||
| V / Visa Inc. | 3.38 | 12,497.10 | 3.38 | -63.10 | 0.2879 | -0.4048 | |||
| CDNS / Cadence Design Systems, Inc. | 2.95 | 10,159.35 | 2.95 | -70.79 | 0.2517 | -0.5134 | |||
| BKNG / Booking Holdings Inc. | 2.83 | 191,965.76 | 2.83 | -64.44 | 0.2414 | -0.3612 | |||
| IDXX / IDEXX Laboratories, Inc. | 2.65 | 23,694.74 | 2.65 | -62.76 | 0.2261 | -0.3129 | |||
| MCD / McDonald's Corporation | 2.54 | 9,867.47 | 2.54 | -67.20 | 0.2166 | -0.3696 | |||
| XYZ / Block, Inc. | 2.30 | 2,040.03 | 2.30 | -70.39 | 0.1960 | -0.3916 | |||
| HD / The Home Depot, Inc. | 2.23 | 14,869.30 | 2.23 | -63.06 | 0.1903 | -0.2670 | |||
| ISRG / Intuitive Surgical, Inc. | 2.13 | 2.13 | 0.1813 | 0.1813 | |||||
| TEL / TE Connectivity plc | 1.96 | 1.96 | 0.1668 | 0.1668 | |||||
| DXCM / DexCom, Inc. | 1.60 | 2,114.75 | 1.60 | -67.10 | 0.1365 | -0.2318 | |||
| IT / Gartner, Inc. | 1.54 | 8,182.00 | 1.54 | -68.51 | 0.1310 | -0.2381 | |||
| LOW / Lowe's Companies, Inc. | 1.49 | 7,814.86 | 1.49 | -68.51 | 0.1270 | -0.2311 | |||
| LIN / Linde plc | 1.33 | -10.23 | 1.33 | 44,100.00 | 0.1131 | 0.1129 | |||
| AAAU / Goldman Sachs Physical Gold ETF | 0.90 | 4,155.00 | 0.90 | 11.63 | 0.0769 | 0.0157 | |||
| AMAT / Applied Materials, Inc. | 0.72 | 25,599.00 | 0.72 | 25.48 | 0.0613 | 0.0179 | |||
| BFB / Brown-Forman Corp. - Class B | 0.72 | 3,833.28 | 0.72 | 45.33 | 0.0610 | 0.0237 | |||
| ADBE / Adobe Inc. | 0.65 | 26,128.12 | 0.65 | -25.57 | 0.0556 | -0.0108 | |||
| NOC / Northrop Grumman Corporation | 0.42 | 56,920.95 | 0.42 | -6.44 | 0.0360 | 0.0018 | |||
| LMT / Lockheed Martin Corporation | 0.34 | 48,266.95 | 0.34 | -3.13 | 0.0291 | 0.0024 | |||
| GOOGL / Alphabet Inc. | 0.33 | 667.07 | 0.33 | -96.85 | 0.0280 | -0.7594 |