Estatísticas Básicas
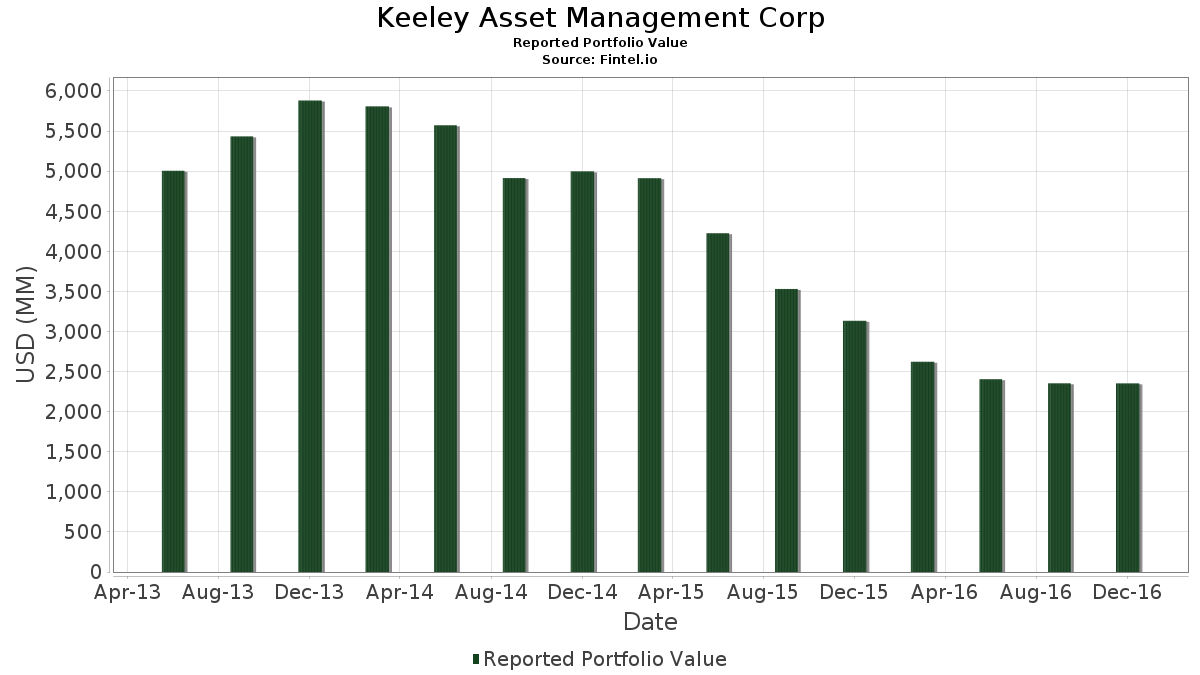
| Valor do Portfólio | $ 2,351,893,000 |
| Posições Atuais | 270 |
Últimas Participações, Desempenho, AUM (de 13F, 13D)
Keeley Asset Management Corp divulgou 270 participações totais em seus últimos arquivamentos da SEC. O valor mais recente da carteira é calculado como $ 2,351,893,000 USD. O Ativo Total Sob Gestão (AUM) é esse valor mais o caixa (que não é divulgado). As principais posições de Keeley Asset Management Corp são Air Lease Corporation (US:AL) , BOK Financial Corporation (US:BOKF) , BancorpSouth Bank (US:BXS) , OUTFRONT Media Inc. (US:OUT) , and UMB Financial Corporation (US:UMBF) . As novas posições de Keeley Asset Management Corp incluem KBR, Inc. (US:KBR) , Welbilt Inc (US:WBT) , OceanFirst Financial Corp. (US:OCFC) , Opus Bank (US:OPB) , and Lamb Weston Holdings, Inc. (US:LW) .
Maiores Aumentos Este Trimestre
Usamos a mudança na alocação do portfólio porque esta é a métrica mais significativa. As mudanças podem ser devido a operações ou mudanças nos preços das ações.
| Ativo | Ações (MM) |
Valor (MM$) |
% do Portfólio | Δ% do Portfólio |
|---|---|---|---|---|
| 1.65 | 49.09 | 2.0873 | 2.0873 | |
| 2.03 | 41.68 | 1.7723 | 1.7723 | |
| 0.65 | 41.41 | 1.7609 | 1.7609 | |
| 0.60 | 37.05 | 1.5755 | 1.5755 | |
| 1.65 | 36.73 | 1.5619 | 1.5619 | |
| 0.99 | 35.00 | 1.4880 | 1.4880 | |
| 2.23 | 34.62 | 1.4721 | 1.4721 | |
| 0.78 | 32.10 | 1.3648 | 1.3648 | |
| 1.03 | 28.92 | 1.2295 | 1.2295 | |
| 0.78 | 28.86 | 1.2271 | 1.2271 |
Maiores Diminuições Este Trimestre
Usamos a mudança na alocação do portfólio porque esta é a métrica mais significativa. As mudanças podem ser devido a operações ou mudanças nos preços das ações.
| Ativo | Ações (MM) |
Valor (MM$) |
% do Portfólio | Δ% do Portfólio |
|---|---|---|---|---|
| 0.17 | 5.19 | 0.2207 | -1.0143 | |
| 0.01 | 0.24 | 0.0102 | -0.9496 | |
| 0.00 | 0.00 | -0.7396 | ||
| 0.64 | 30.11 | 1.2805 | -0.6666 | |
| 0.26 | 14.56 | 0.6193 | -0.5458 | |
| 0.85 | 32.77 | 1.3932 | -0.5102 | |
| 0.44 | 14.57 | 0.6196 | -0.4764 | |
| 0.40 | 31.29 | 1.3304 | -0.3331 | |
| 0.65 | 49.80 | 2.1173 | -0.3291 | |
| 4.70 | 31.94 | 1.3579 | -0.3073 |
Arquivamentos 13F e Fundo
Este formulário foi arquivado em 2017-02-14 para o período de relatório 2016-12-31. Clique no ícone de link para ver o histórico completo da transação.
Atualize para desbloquear dados premium e exportar para Excel ![]() .
.
| Ativo | Tipo | Preço Médio por Ação | Ações (MM) |
ΔAções (%) |
Valor ($MM) |
ΔAções (%) |
Portfólio (%) |
ΔPortfólio (%) |
|
|---|---|---|---|---|---|---|---|---|---|
| AL / Air Lease Corporation | 1.77 | -8.22 | 60.83 | 10.24 | 2.5863 | 0.2412 | |||
| BOKF / BOK Financial Corporation | 0.67 | -11.55 | 55.76 | 6.49 | 2.3709 | 0.1454 | |||
| BXS / BancorpSouth Bank | 1.70 | 57.34 | 52.85 | 110.58 | 2.2473 | 1.1805 | |||
| OUT / OUTFRONT Media Inc. | 2.09 | 20.97 | 52.08 | 27.20 | 2.2144 | 0.4742 | |||
| UMBF / UMB Financial Corporation | 0.65 | -33.31 | 49.80 | -13.49 | 2.1173 | -0.3291 | |||
| JBT / JBT Marel Corporation | 0.57 | -11.53 | 49.16 | 7.78 | 2.0904 | 0.1516 | |||
| HTH / Hilltop Holdings Inc. | 1.65 | -13.13 | 49.09 | 15.26 | 2.0873 | 2.0873 | |||
| KW / Kennedy-Wilson Holdings, Inc. | 2.03 | -12.56 | 41.68 | -20.51 | 1.7723 | 1.7723 | |||
| NXST / Nexstar Media Group, Inc. | 0.65 | -13.42 | 41.41 | -5.03 | 1.7609 | 1.7609 | |||
| DENN / Denny's Corporation | 3.21 | -4.46 | 41.21 | 14.66 | 1.7520 | 0.2246 | |||
| RHP / Ryman Hospitality Properties, Inc. | 0.64 | -11.87 | 40.10 | 15.31 | 1.7051 | 0.2269 | |||
| CMC / Commercial Metals Company | 1.83 | -11.11 | 39.91 | 19.59 | 1.6968 | 0.2784 | |||
| ESE / ESCO Technologies Inc. | 0.69 | -11.94 | 39.05 | 7.47 | 1.6603 | 0.1160 | |||
| SBRA / Sabra Health Care REIT, Inc. | 1.53 | -11.42 | 37.40 | -14.09 | 1.5902 | -0.2601 | |||
| PFS / Provident Financial Services, Inc. | 1.32 | -12.77 | 37.30 | 16.28 | 1.5862 | 0.2226 | |||
| BKH / Black Hills Corporation | 0.60 | -9.90 | 37.05 | -9.72 | 1.5755 | 1.5755 | |||
| IBKC / IBERIABANK Corp. | 0.44 | 12.57 | 36.78 | 40.47 | 1.5637 | 0.4509 | |||
| ENSG / The Ensign Group, Inc. | 1.65 | -11.75 | 36.73 | -2.63 | 1.5619 | 1.5619 | |||
| MTN / Vail Resorts, Inc. | 0.22 | -13.08 | 36.01 | -10.62 | 1.5311 | -0.1814 | |||
| PAG / Penske Automotive Group, Inc. | 0.68 | -12.34 | 35.05 | -5.68 | 1.4903 | -0.0891 | |||
| US7018771029 / Parsley Energy, Inc. | 0.99 | -25.54 | 35.00 | -21.70 | 1.4880 | 1.4880 | |||
| KRNY / Kearny Financial Corp. | 2.23 | -13.12 | 34.62 | -0.74 | 1.4721 | 1.4721 | |||
| SJI / South Jersey Industries Inc. | 1.02 | -12.77 | 34.24 | -0.55 | 1.4557 | -0.0074 | |||
| ALE / ALLETE, Inc. | 0.52 | 22.17 | 33.66 | 31.53 | 1.4314 | 0.3435 | |||
| SXT / Sensient Technologies Corporation | 0.42 | -13.11 | 33.19 | -9.93 | 1.4112 | -0.1549 | |||
| ITT / ITT Inc. | 0.85 | -32.01 | 32.77 | -26.83 | 1.3932 | -0.5102 | |||
| CTRE / CareTrust REIT, Inc. | 2.12 | -11.21 | 32.43 | -7.97 | 1.3788 | -0.1189 | |||
| SNV / Synovus Financial Corp. | 0.78 | -22.33 | 32.10 | -1.91 | 1.3648 | 1.3648 | |||
| MITL / Mitel Networks Corp | 4.70 | -11.77 | 31.94 | -18.48 | 1.3579 | -0.3073 | |||
| KALU / Kaiser Aluminum Corporation | 0.40 | -11.00 | 31.29 | -20.05 | 1.3304 | -0.3331 | |||
| RBA / RB Global, Inc. | 0.91 | -13.43 | 30.97 | -16.07 | 1.3167 | -0.2516 | |||
| ABM / ABM Industries Incorporated | 0.75 | -13.27 | 30.47 | -10.78 | 1.2954 | -0.1560 | |||
| AOS / A. O. Smith Corporation | 0.64 | 37.16 | 30.11 | -34.26 | 1.2805 | -0.6666 | |||
| KN / Knowles Corporation | 1.74 | 2.03 | 29.01 | 21.34 | 1.2336 | 0.2174 | |||
| VSM / Versum Materials, Inc. | 1.03 | 1,649.62 | 28.92 | 2,062.83 | 1.2295 | 1.2295 | |||
| VSTO / Vista Outdoor Inc. | 0.78 | 62.28 | 28.86 | 50.23 | 1.2271 | 1.2271 | |||
| GNRC / Generac Holdings Inc. | 0.69 | 5.51 | 28.01 | 18.41 | 1.1910 | 0.1855 | |||
| 98235T107 / Wright Medical Group N.V. | 1.20 | -9.01 | 27.57 | -14.76 | 1.1722 | -0.2025 | |||
| TPH / Tri Pointe Homes, Inc. | 2.29 | -8.22 | 26.29 | -20.06 | 1.1179 | -0.2800 | |||
| VRNT / Verint Systems Inc. | 0.75 | -12.31 | 26.27 | -17.85 | 1.1171 | -0.2423 | |||
| WEX / WEX Inc. | 0.24 | -12.01 | 26.25 | -9.15 | 1.1161 | -0.1120 | |||
| DBD / Diebold Nixdorf, Incorporated | 1.02 | -9.75 | 25.76 | -8.44 | 1.0952 | -0.1005 | |||
| 58441K100 / Media General, Inc. | 1.31 | -13.47 | 24.62 | -11.59 | 1.0469 | 1.0469 | |||
| SRCI / SRC Energy Inc | 2.66 | 18.20 | 23.73 | 51.97 | 1.0091 | 0.3453 | |||
| BLMN / Bloomin' Brands, Inc. | 1.15 | -13.08 | 20.70 | -9.10 | 0.8801 | 0.8801 | |||
| VOYA / Voya Financial, Inc. | 0.49 | -2.37 | 19.19 | 32.86 | 0.8161 | 0.2021 | |||
| 887228104 / Time Inc. | 1.06 | -13.50 | 18.90 | 6.63 | 0.8037 | 0.0503 | |||
| HAFC / Hanmi Financial Corporation | 0.51 | 30.43 | 17.68 | 72.81 | 0.7516 | 0.7516 | |||
| UE / Urban Edge Properties | 0.63 | -13.43 | 17.37 | -15.37 | 0.7384 | 0.7384 | |||
| KS / KapStone Paper & Packaging Corp. | 0.78 | -14.44 | 17.14 | -0.29 | 0.7287 | -0.0019 | |||
| KBR / KBR, Inc. | 0.95 | 15.80 | 0.6717 | 0.6717 | |||||
| 01449J105 / Alere Inc. | 0.40 | -13.12 | 15.71 | -21.70 | 0.6679 | -0.1848 | |||
| WBT / Welbilt Inc | 0.81 | 15.68 | 0.6667 | 0.6667 | |||||
| 163893209 / Chemtura Corp. | 0.44 | -44.15 | 14.57 | -43.49 | 0.6196 | -0.4764 | |||
| NWE / NorthWestern Energy Group, Inc. | 0.26 | -46.25 | 14.56 | -46.87 | 0.6193 | -0.5458 | |||
| NRG / NRG Energy, Inc. | 1.11 | 13.96 | 13.64 | 24.64 | 0.5801 | 0.1148 | |||
| H01531104 / Allied World Assurance Company Holding AG | 0.24 | -5.42 | 12.82 | 25.69 | 0.5453 | 0.1116 | |||
| TRCO / Tribune Media Company | 0.33 | 27.57 | 11.65 | 22.20 | 0.4955 | 0.4955 | |||
| FCFS / FirstCash Holdings, Inc. | 0.87 | -28.38 | 11.54 | -18.65 | 0.4905 | -0.1122 | |||
| MDU / MDU Resources Group, Inc. | 0.40 | -18.06 | 11.37 | -7.33 | 0.4836 | -0.0381 | |||
| CSRA / CSRA Inc. | 0.35 | -3.69 | 11.17 | 14.00 | 0.4750 | 0.0585 | |||
| TACO / Berto Acquisition Corp. | 0.79 | -10.54 | 11.11 | 5.97 | 0.4722 | 0.4722 | |||
| VAC / Marriott Vacations Worldwide Corporation | 0.13 | -8.39 | 11.09 | 6.02 | 0.4714 | 0.0269 | |||
| EQC / Equity Commonwealth | 0.36 | -2.61 | 11.02 | -2.55 | 0.4685 | 0.4685 | |||
| R / Ryder System, Inc. | 0.14 | 18.95 | 10.66 | 34.25 | 0.4532 | 0.1157 | |||
| EGN / Energen Corp. | 0.17 | -5.08 | 10.02 | -5.17 | 0.4262 | -0.0230 | |||
| HHC / Howard Hughes Corporation | 0.08 | 1.96 | 9.62 | 1.61 | 0.4090 | 0.0066 | |||
| IRM / Iron Mountain Incorporated | 0.28 | 8.73 | 9.20 | -5.90 | 0.3912 | -0.0244 | |||
| IVV / iShares Trust - iShares Core S&P 500 ETF | 0.04 | 2.88 | 8.95 | 6.41 | 0.3807 | 0.0231 | |||
| OCFC / OceanFirst Financial Corp. | 0.28 | 8.53 | 0.3627 | 0.3627 | |||||
| OA / Orbital ATK, Inc. | 0.09 | -4.56 | 8.30 | 9.85 | 0.3528 | 0.3528 | |||
| LAMR / Lamar Advertising Company | 0.12 | -2.00 | 8.24 | 0.89 | 0.3505 | 0.0032 | |||
| ASH / Ashland Inc. | 0.07 | -28.98 | 8.03 | -33.06 | 0.3415 | -0.1684 | |||
| BR / Broadridge Financial Solutions, Inc. | 0.12 | -4.14 | 7.72 | -6.25 | 0.3282 | -0.0218 | |||
| HUN / Huntsman Corporation | 0.37 | -2.39 | 7.14 | 14.48 | 0.3035 | 0.3035 | |||
| OPB / Opus Bank | 0.22 | 6.66 | 0.2830 | 0.2830 | |||||
| CSV / Carriage Services, Inc. | 0.22 | -6.52 | 6.35 | 13.19 | 0.2700 | 0.0316 | |||
| SPB / Spectrum Brands Holdings, Inc. | 0.05 | -5.98 | 6.18 | -16.46 | 0.2628 | -0.0517 | |||
| AWK / American Water Works Company, Inc. | 0.08 | 3.62 | 5.87 | 0.17 | 0.2495 | 0.0005 | |||
| LW / Lamb Weston Holdings, Inc. | 0.15 | 5.55 | 0.2359 | 0.2359 | |||||
| PVH / PVH Corp. | 0.06 | -6.67 | 5.45 | -23.78 | 0.2316 | -0.0721 | |||
| OMAM / OM Asset Management Plc | 0.37 | -6.98 | 5.37 | -3.05 | 0.2284 | 0.2284 | |||
| GLPI / Gaming and Leisure Properties, Inc. | 0.17 | -80.48 | 5.19 | -82.14 | 0.2207 | -1.0143 | |||
| LH / Labcorp Holdings Inc. | 0.04 | -6.26 | 5.19 | -12.47 | 0.2205 | -0.0313 | |||
| FBHS / Fortune Brands Home & Security Inc | 0.10 | -2.55 | 5.18 | -10.33 | 0.2203 | -0.0253 | |||
| CPRT / Copart, Inc. | 0.09 | -6.28 | 5.14 | -3.04 | 0.2186 | -0.0068 | |||
| DFS / Discover Financial Services | 0.07 | -12.69 | 4.83 | 11.29 | 0.2054 | 0.0209 | |||
| CDK / CDK Global Inc | 0.08 | -6.39 | 4.82 | -2.59 | 0.2049 | 0.2049 | |||
| CBF / Capital Bank Financial Corp. | 0.12 | 4.79 | 0.2039 | 0.2039 | |||||
| SM / SM Energy Company | 0.14 | 4.69 | 0.1994 | 0.1994 | |||||
| STBZ / State Bank Financial Corp. | 0.17 | 4.68 | 0.1992 | 0.1992 | |||||
| SPY / SPDR S&P 500 ETF | 0.02 | 9.42 | 4.30 | 13.08 | 0.1827 | 0.0212 | |||
| FNF / Fidelity National Financial, Inc. | 0.13 | -6.43 | 4.27 | -13.91 | 0.1814 | 0.1814 | |||
| / Wyndham Destinations, Inc. | 0.06 | -6.96 | 4.19 | -12.14 | 0.1781 | -0.0245 | |||
| CMA / Comerica Incorporated | 0.06 | 7.79 | 3.94 | 55.16 | 0.1674 | 0.0596 | |||
| MIC / Macquarie Infrastructure Holdings LLC - Units | 0.05 | 1.96 | 3.94 | 0.08 | 0.1673 | 0.0002 | |||
| FIS / Fidelity National Information Services, Inc. | 0.05 | 1.15 | 3.89 | -0.69 | 0.1654 | -0.0011 | |||
| DLB / Dolby Laboratories, Inc. | 0.08 | 32.19 | 3.79 | 10.03 | 0.1610 | 0.1610 | |||
| PTEN / Patterson-UTI Energy, Inc. | 0.14 | 211.00 | 3.76 | 274.13 | 0.1599 | 0.1599 | |||
| US30239F1066 / FBL Financial Group Inc | 0.05 | 8.17 | 3.71 | 32.16 | 0.1580 | 0.1580 | |||
| IWN / iShares Trust - iShares Russell 2000 Value ETF | 0.03 | 0.00 | 3.61 | 0.1535 | 0.1535 | ||||
| EOG / EOG Resources, Inc. | 0.04 | 49.53 | 3.56 | 56.29 | 0.1516 | 0.0546 | |||
| SHPG / Shire Plc. | 0.02 | 14.80 | 3.39 | 0.89 | 0.1441 | 0.1441 | |||
| ITOT / iShares Trust - iShares Core S&P Total U.S. Stock Market ETF | 0.07 | 0.00 | 3.38 | 3.55 | 0.1439 | 0.1439 | |||
| WGO / Winnebago Industries, Inc. | 0.11 | -4.74 | 3.34 | 27.92 | 0.1420 | 0.1420 | |||
| WTFC / Wintrust Financial Corporation | 0.05 | -4.94 | 3.33 | 24.16 | 0.1418 | 0.0276 | |||
| AJG / Arthur J. Gallagher & Co. | 0.06 | -0.56 | 3.25 | 1.60 | 0.1381 | 0.0022 | |||
| TAP / Molson Coors Beverage Company | 0.03 | -6.43 | 3.23 | -17.08 | 0.1373 | -0.0282 | |||
| COLB / Columbia Banking System, Inc. | 0.07 | -5.05 | 3.21 | 29.67 | 0.1364 | 0.0312 | |||
| ZTS / Zoetis Inc. | 0.06 | -11.83 | 3.13 | -9.24 | 0.1332 | -0.0135 | |||
| CECE / Ceco Environmental Corp. | 0.22 | -5.29 | 3.13 | 17.14 | 0.1331 | 0.1331 | |||
| JCI / Johnson Controls International plc | 0.08 | -4.15 | 3.10 | -15.14 | 0.1320 | -0.0235 | |||
| BHLB / Berkshire Hills Bancorp, Inc. | 0.08 | -4.38 | 3.06 | 27.17 | 0.1302 | 0.1302 | |||
| PYPL / PayPal Holdings, Inc. | 0.08 | -3.49 | 3.06 | -7.03 | 0.1299 | -0.0098 | |||
| LNC / Lincoln National Corporation | 0.05 | 10.63 | 2.99 | 56.05 | 0.1273 | 0.0457 | |||
| SAMG / Silvercrest Asset Management Group Inc. | 0.22 | -29.49 | 2.93 | -21.87 | 0.1247 | -0.0348 | |||
| PFE / Pfizer Inc. | 0.09 | -2.52 | 2.90 | -6.54 | 0.1233 | -0.0086 | |||
| APA / APA Corporation | 0.05 | 2.86 | 0.1218 | 0.1218 | |||||
| LTXB / LegacyTexas Financial Group Inc. | 0.07 | -21.15 | 2.84 | 7.34 | 0.1206 | 0.1206 | |||
| XHR / Xenia Hotels & Resorts, Inc. | 0.14 | -0.55 | 2.75 | 27.22 | 0.1168 | 0.1168 | |||
| CY / Cypress Semiconductor Corp. | 0.24 | -5.22 | 2.73 | -10.83 | 0.1162 | -0.0141 | |||
| CULP / Culp, Inc. | 0.07 | -5.57 | 2.69 | 17.84 | 0.1143 | 0.1143 | |||
| NC / NACCO Industries, Inc. | 0.03 | -4.81 | 2.63 | 26.84 | 0.1119 | 0.0237 | |||
| MDLZ / Mondelez International, Inc. | 0.06 | 28.26 | 2.55 | 29.53 | 0.1086 | 0.0248 | |||
| DFIN / Donnelley Financial Solutions, Inc. | 0.11 | 2.52 | 0.1071 | 0.1071 | |||||
| CIO / City Office REIT, Inc. | 0.19 | 20.95 | 2.47 | 25.13 | 0.1050 | 0.1050 | |||
| HPE / Hewlett Packard Enterprise Company | 0.11 | -29.19 | 2.46 | -28.00 | 0.1048 | -0.0407 | |||
| CIT / CIT Group Inc | 0.06 | 0.18 | 2.46 | 17.77 | 0.1046 | 0.0158 | |||
| CHE / Chemed Corporation | 0.02 | -5.94 | 2.41 | 6.96 | 0.1026 | 0.0067 | |||
| VMC / Vulcan Materials Company | 0.02 | 2.55 | 2.39 | 12.85 | 0.1016 | 0.0116 | |||
| VIRT / Virtu Financial, Inc. | 0.15 | 0.00 | 2.37 | 6.52 | 0.1008 | 0.1008 | |||
| MERC / Mercer International Inc. | 0.22 | -0.99 | 2.35 | 24.48 | 0.0999 | 0.0999 | |||
| AVX / Avax One Technology Ltd. | 0.15 | -5.27 | 2.34 | 7.40 | 0.0994 | 0.0069 | |||
| HFC / HollyFrontier Corp | 0.07 | 14.03 | 2.33 | 52.45 | 0.0991 | 0.0341 | |||
| ALJ / Alon USA Energy, Inc. | 0.20 | -0.97 | 2.33 | 39.89 | 0.0989 | 0.0282 | |||
| SLRC / SLR Investment Corp. | 0.11 | -5.32 | 2.30 | -3.93 | 0.0977 | 0.0977 | |||
| POLY / Plantronics, Inc. | 0.04 | 20.47 | 2.29 | 27.02 | 0.0972 | 0.0972 | |||
| 385002100 / Gramercy Property Trust Inc. | 0.25 | -4.96 | 2.28 | -9.50 | 0.0969 | 0.0969 | |||
| CSC / Computer Sciences Corp. | 0.04 | 12.16 | 2.23 | 27.65 | 0.0948 | 0.0948 | |||
| SNI / Scripps Networks Interactive, Inc. | 0.03 | 9.38 | 2.19 | 22.92 | 0.0930 | 0.0174 | |||
| GBCI / Glacier Bancorp, Inc. | 0.06 | -5.41 | 2.19 | 20.18 | 0.0929 | 0.0156 | |||
| SAFM / Sanderson Farms, Inc. | 0.02 | -5.52 | 2.18 | -7.56 | 0.0925 | -0.0075 | |||
| HTA / Healthcare Realty Trust Inc - Class A | 0.07 | 41.55 | 2.17 | 26.28 | 0.0924 | 0.0192 | |||
| INT / World Fuel Services Corp. | 0.05 | -5.85 | 2.15 | -6.56 | 0.0915 | -0.0064 | |||
| AZZ / AZZ Inc. | 0.03 | -5.15 | 2.14 | -7.11 | 0.0911 | -0.0069 | |||
| HWKN / Hawkins, Inc. | 0.04 | -0.75 | 2.14 | 23.60 | 0.0911 | 0.0911 | |||
| OSK / Oshkosh Corporation | 0.03 | 9.28 | 2.12 | 26.06 | 0.0901 | 0.0901 | |||
| PRIM / Primoris Services Corporation | 0.09 | -4.69 | 2.08 | 5.41 | 0.0886 | 0.0046 | |||
| UMPQ / Umpqua Holdings Corp | 0.11 | 9.69 | 2.01 | 36.90 | 0.0853 | 0.0853 | |||
| ATH / Athene Holding Ltd - Class A | 0.04 | 2.00 | 0.0852 | 0.0852 | |||||
| FMC / FMC Corporation | 0.04 | 11.48 | 2.00 | 30.42 | 0.0851 | 0.0199 | |||
| DLX / Deluxe Corporation | 0.03 | -5.10 | 2.00 | 1.68 | 0.0849 | 0.0014 | |||
| FL / Foot Locker, Inc. | 0.03 | 1.40 | 1.98 | 6.16 | 0.0842 | 0.0049 | |||
| DNB / Dun & Bradstreet Holdings, Inc. | 0.02 | 71.20 | 1.96 | 52.02 | 0.0833 | 0.0285 | |||
| IPHS / Innophos Holdings, Inc. | 0.04 | -5.27 | 1.95 | 26.79 | 0.0827 | 0.0175 | |||
| TSS / Total System Services, Inc. | 0.04 | 12.29 | 1.89 | 16.74 | 0.0804 | 0.0115 | |||
| / Wyndham Destinations, Inc. | 0.02 | 9.73 | 1.89 | 24.49 | 0.0802 | 0.0158 | |||
| CI / The Cigna Group | 0.01 | 10.92 | 1.88 | 13.50 | 0.0801 | 0.0096 | |||
| YDKN / Yadkin Financial Corporation | 0.05 | -4.92 | 1.85 | 23.88 | 0.0787 | 0.0787 | |||
| CAG / Conagra Brands, Inc. | 0.05 | 43.11 | 1.84 | 20.17 | 0.0783 | 0.0132 | |||
| COG / Cabot Oil & Gas Corp. | 0.08 | 31.00 | 1.84 | 18.63 | 0.0782 | 0.0123 | |||
| VC / Visteon Corporation | 0.02 | 1.79 | 0.0761 | 0.0761 | |||||
| LHX / L3Harris Technologies, Inc. | 0.02 | 0.87 | 1.78 | 12.80 | 0.0757 | 0.0086 | |||
| EPR / EPR Properties | 0.02 | 11.43 | 1.76 | 1.56 | 0.0748 | 0.0012 | |||
| RPM / RPM International Inc. | 0.03 | 6.18 | 1.75 | 6.44 | 0.0745 | 0.0045 | |||
| SNA / Snap-on Incorporated | 0.01 | 3.65 | 1.75 | 16.79 | 0.0745 | 0.0107 | |||
| CORR / CorEnergy Infrastructure Trust, Inc. | 0.05 | -5.77 | 1.75 | 12.11 | 0.0744 | 0.0081 | |||
| ASB / Associated Banc-Corp | 0.07 | 6.10 | 1.74 | 33.82 | 0.0740 | 0.0187 | |||
| BRX / Brixmor Property Group Inc. | 0.07 | 40.84 | 1.74 | 23.76 | 0.0740 | 0.0740 | |||
| US7587501039 / Regal-Beloit Corp. | 0.02 | -5.22 | 1.72 | 10.31 | 0.0733 | 0.0069 | |||
| CWT / California Water Service Group | 0.05 | -4.00 | 1.71 | 1.42 | 0.0727 | 0.0727 | |||
| ALV / Autoliv, Inc. | 0.01 | 31.69 | 1.70 | 39.47 | 0.0721 | 0.0204 | |||
| DAKT / Daktronics, Inc. | 0.16 | -5.22 | 1.69 | 6.34 | 0.0720 | 0.0043 | |||
| NFG / National Fuel Gas Company | 0.03 | 12.35 | 1.69 | 17.67 | 0.0716 | 0.0108 | |||
| ORIT / Oritani Financial Corp. | 0.09 | -5.18 | 1.68 | 13.07 | 0.0713 | 0.0083 | |||
| SRC / Spirit Realty Capital, Inc. | 0.15 | -69.97 | 1.67 | -75.53 | 0.0710 | -0.2192 | |||
| OGE / OGE Energy Corp. | 0.05 | 12.47 | 1.66 | 19.04 | 0.0705 | 0.0113 | |||
| SITE / SiteOne Landscape Supply, Inc. | 0.11 | 9.78 | 1.64 | -3.82 | 0.0696 | -0.0027 | |||
| ALG / Alamo Group Inc. | 0.02 | -48.49 | 1.64 | -40.50 | 0.0696 | -0.0474 | |||
| IXYS / IXYS Corp. | 0.13 | -5.41 | 1.59 | -6.60 | 0.0674 | -0.0047 | |||
| VTI / Vanguard Index Funds - Vanguard Total Stock Market ETF | 0.01 | 14.09 | 1.59 | 18.18 | 0.0674 | 0.0104 | |||
| EQT / EQT Corporation | 0.02 | 11.04 | 1.57 | 0.00 | 0.0668 | 0.0000 | |||
| NSA / National Storage Affiliates Trust | 0.07 | -27.72 | 1.56 | -23.84 | 0.0664 | 0.0664 | |||
| US0044461004 / Aceto Corp. | 0.07 | -0.98 | 1.56 | 14.53 | 0.0664 | 0.0664 | |||
| PCH / PotlatchDeltic Corporation | 0.04 | -5.49 | 1.55 | 1.18 | 0.0659 | 0.0659 | |||
| WRK / WestRock Company | 0.03 | -9.18 | 1.53 | -4.90 | 0.0652 | -0.0033 | |||
| US2836778546 / El Paso Electric Co. | 0.03 | 0.00 | 1.51 | -0.59 | 0.0642 | -0.0004 | |||
| AMP / Ameriprise Financial, Inc. | 0.01 | -9.04 | 1.48 | 1.16 | 0.0631 | 0.0007 | |||
| PPL / PPL Corporation | 0.04 | 10.19 | 1.46 | 8.50 | 0.0619 | 0.0049 | |||
| RGA / Reinsurance Group of America, Incorporated | 0.01 | -32.96 | 1.45 | -21.84 | 0.0618 | -0.0172 | |||
| STAG / STAG Industrial, Inc. | 0.06 | -22.31 | 1.45 | -24.37 | 0.0615 | -0.0198 | |||
| DIN / Dine Brands Global, Inc. | 0.02 | 0.00 | 1.45 | -2.76 | 0.0614 | -0.0017 | |||
| UGI / UGI Corporation | 0.03 | 6.23 | 1.37 | 8.19 | 0.0584 | 0.0044 | |||
| SRG / Seritage Growth Properties | 0.03 | 1.37 | 0.0582 | 0.0582 | |||||
| ABT / Abbott Laboratories | 0.04 | 1.37 | 0.0582 | 0.0582 | |||||
| OMI / Owens & Minor, Inc. | 0.04 | -5.03 | 1.33 | -3.55 | 0.0566 | -0.0021 | |||
| AUB / Atlantic Union Bankshares Corporation | 0.04 | -5.34 | 1.33 | 26.43 | 0.0566 | 0.0566 | |||
| TGNA / TEGNA Inc. | 0.06 | -76.44 | 1.32 | -76.94 | 0.0561 | 0.0561 | |||
| ELS / Equity LifeStyle Properties, Inc. | 0.02 | 6.03 | 1.30 | -0.91 | 0.0553 | -0.0005 | |||
| FHI / Federated Hermes, Inc. | 0.04 | 43.97 | 1.26 | 37.35 | 0.0538 | 0.0146 | |||
| ABC / Amerisource Bergen Corp. | 0.02 | 45.52 | 1.25 | 40.83 | 0.0532 | 0.0154 | |||
| HSNI / HSN, Inc. | 0.04 | 1.23 | 0.0521 | 0.0521 | |||||
| VWO / Vanguard International Equity Index Funds - Vanguard FTSE Emerging Markets ETF | 0.03 | -15.03 | 1.16 | -19.15 | 0.0494 | 0.0494 | |||
| AEO / American Eagle Outfitters, Inc. | 0.07 | 31.66 | 1.11 | 11.86 | 0.0473 | 0.0050 | |||
| A / Agilent Technologies, Inc. | 0.02 | 12.35 | 1.09 | 8.74 | 0.0466 | 0.0038 | |||
| EFA / iShares Trust - iShares MSCI EAFE ETF | 0.02 | 0.45 | 1.07 | -1.92 | 0.0455 | -0.0009 | |||
| HR / Healthcare Realty Trust Incorporated | 0.03 | -0.69 | 1.02 | -11.62 | 0.0433 | -0.0057 | |||
| THG / The Hanover Insurance Group, Inc. | 0.01 | -4.22 | 1.01 | 15.53 | 0.0430 | 0.0058 | |||
| RL / Ralph Lauren Corporation | 0.01 | 10.92 | 1.01 | -0.98 | 0.0429 | -0.0004 | |||
| DVY / iShares Trust - iShares Select Dividend ETF | 0.01 | 0.80 | 0.95 | 4.15 | 0.0406 | 0.0406 | |||
| BAX / Baxter International Inc. | 0.02 | -62.60 | 0.95 | -65.17 | 0.0405 | -0.0757 | |||
| AY / Atlantica Sustainable Infrastructure plc | 0.05 | -5.58 | 0.95 | -3.95 | 0.0404 | 0.0404 | |||
| MPW / Medical Properties Trust, Inc. | 0.07 | -0.63 | 0.90 | -17.32 | 0.0384 | -0.0080 | |||
| RTX / RTX Corporation | 0.01 | -4.58 | 0.87 | 2.96 | 0.0369 | 0.0011 | |||
| ENFC / Entegra Financial Corp. | 0.04 | 0.00 | 0.84 | 12.07 | 0.0359 | 0.0359 | |||
| WBBW / Westbury Bancorp, Inc. | 0.04 | 0.00 | 0.84 | 6.08 | 0.0356 | 0.0021 | |||
| VGK / Vanguard International Equity Index Funds - Vanguard FTSE Europe ETF | 0.02 | 3.69 | 0.83 | 1.98 | 0.0351 | 0.0007 | |||
| OXY / Occidental Petroleum Corporation | 0.01 | -63.82 | 0.81 | -64.65 | 0.0343 | -0.0626 | |||
| JRVR / James River Group Holdings, Inc. | 0.02 | -41.18 | 0.76 | -32.54 | 0.0324 | 0.0324 | |||
| HAR / Harman International Industries, Inc. | 0.01 | 0.75 | 0.0318 | 0.0318 | |||||
| IYF / iShares Trust - iShares U.S. Financials ETF | 0.01 | -0.84 | 0.69 | 11.76 | 0.0295 | 0.0031 | |||
| BLACKROCK NY MUNI 2018 TERM / (09248K108) | 0.05 | 0.00 | 0.67 | -2.05 | 0.0000 | ||||
| SPNV / Supernova Partners Acquisition Company Inc - Class A | 0.04 | 3.57 | 0.65 | -2.41 | 0.0276 | -0.0007 | |||
| ARE / Alexandria Real Estate Equities, Inc. | 0.01 | -43.79 | 0.65 | -42.56 | 0.0274 | -0.0203 | |||
| VTR / Ventas, Inc. | 0.01 | -0.72 | 0.65 | -12.13 | 0.0274 | 0.0274 | |||
| TEVA / Teva Pharmaceutical Industries Limited - Depositary Receipt (Common Stock) | 0.02 | -70.80 | 0.60 | -77.00 | 0.0256 | -0.0856 | |||
| LQD / iShares Trust - iShares iBoxx $ Investment Grade Corporate Bond ETF | 0.00 | -2.58 | 0.58 | -7.35 | 0.0247 | 0.0247 | |||
| FXI / iShares Trust - iShares China Large-Cap ETF | 0.02 | 3.21 | 0.57 | -5.77 | 0.0243 | -0.0015 | |||
| HCC / Warrior Met Coal, Inc. | 0.01 | 0.20 | 0.55 | 4.36 | 0.0234 | 0.0010 | |||
| ITW / Illinois Tool Works Inc. | 0.00 | 0.14 | 0.54 | 2.27 | 0.0230 | 0.0005 | |||
| HPT / Hospitality Properties Trust | 0.02 | 0.00 | 0.53 | 6.83 | 0.0226 | 0.0015 | |||
| MGU / Macquarie Global Infrastructure Total Return Fund Inc | 0.03 | 1.22 | 0.53 | -8.36 | 0.0224 | 0.0224 | |||
| MDY / SPDR S&P MidCap 400 ETF Trust | 0.00 | 0.12 | 0.50 | 7.10 | 0.0212 | 0.0014 | |||
| BRK.A / Berkshire Hathaway Inc. | 0.00 | 0.00 | 0.49 | 12.96 | 0.0207 | 0.0024 | |||
| REZ / iShares Trust - iShares Residential and Multisector Real Estate ETF | 0.01 | -6.06 | 0.47 | -11.11 | 0.0201 | 0.0201 | |||
| GE / General Electric Company | 0.01 | 0.01 | 0.47 | 6.55 | 0.0201 | 0.0012 | |||
| VIG / Vanguard Specialized Funds - Vanguard Dividend Appreciation ETF | 0.01 | 0.02 | 0.47 | 1.51 | 0.0201 | 0.0003 | |||
| FPI / Farmland Partners Inc. | 0.04 | -3.53 | 0.45 | -4.06 | 0.0191 | 0.0191 | |||
| BHBK / Blue Hills Bancorp, Inc. | 0.02 | 0.00 | 0.44 | 24.72 | 0.0187 | 0.0187 | |||
| XOM / Exxon Mobil Corporation | 0.00 | -1.11 | 0.43 | 2.35 | 0.0185 | 0.0004 | |||
| MO / Altria Group, Inc. | 0.01 | 0.00 | 0.41 | 6.98 | 0.0176 | 0.0012 | |||
| QQQ / Invesco QQQ Trust, Series 1 | 0.00 | 4.82 | 0.41 | 4.63 | 0.0173 | 0.0173 | |||
| WY / Weyerhaeuser Company | 0.01 | 0.19 | 0.39 | -5.60 | 0.0165 | -0.0010 | |||
| EQR / Equity Residential | 0.01 | 3.75 | 0.39 | 3.75 | 0.0165 | 0.0006 | |||
| DIS / The Walt Disney Company | 0.00 | -5.12 | 0.39 | 6.63 | 0.0164 | 0.0010 | |||
| LFUS / Littelfuse, Inc. | 0.00 | 0.04 | 0.38 | 17.85 | 0.0163 | 0.0025 | |||
| LAND / Gladstone Land Corporation | 0.03 | 0.03 | 0.37 | 6.36 | 0.0156 | 0.0156 | |||
| EVG / Eaton Vance Short Duration Diversified Income Fund | 0.02 | 1.88 | 0.36 | 0.28 | 0.0154 | 0.0000 | |||
| PG / The Procter & Gamble Company | 0.00 | 0.33 | 0.36 | -6.02 | 0.0153 | -0.0010 | |||
| MDYG / SPDR Series Trust - State Street SPDR S&P 400 TM Mid Cap Growth ETF | 0.00 | 0.34 | 0.0146 | 0.0146 | |||||
| IYR / iShares Trust - iShares U.S. Real Estate ETF | 0.00 | 12.60 | 0.32 | 7.51 | 0.0134 | 0.0134 | |||
| WSBF / Waterstone Financial, Inc. | 0.02 | 14.29 | 0.29 | 23.53 | 0.0125 | 0.0125 | |||
| EWA / iShares, Inc. - iShares MSCI Australia ETF | 0.01 | -9.27 | 0.29 | -12.27 | 0.0122 | -0.0017 | |||
| IDU / iShares Trust - iShares U.S. Utilities ETF | 0.00 | 2.41 | 0.28 | 1.79 | 0.0121 | 0.0002 | |||
| EPD / Enterprise Products Partners L.P. - Limited Partnership | 0.01 | 0.50 | 0.28 | -1.73 | 0.0121 | -0.0002 | |||
| WBA / Walgreens Boots Alliance, Inc. | 0.00 | 0.00 | 0.26 | 2.78 | 0.0110 | 0.0003 | |||
| ACSF / American Capital Senior Floating, Ltd. | 0.02 | 0.31 | 0.26 | 8.37 | 0.0110 | 0.0110 | |||
| ROST / Ross Stores, Inc. | 0.00 | 0.18 | 0.26 | 1.97 | 0.0110 | 0.0002 | |||
| NCR / NCR Corp. | 0.01 | 0.00 | 0.26 | 25.49 | 0.0109 | 0.0022 | |||
| CXW / CoreCivic, Inc. | 0.01 | 0.00 | 0.24 | 76.26 | 0.0104 | 0.0045 | |||
| LMT / Lockheed Martin Corporation | 0.00 | 0.41 | 0.24 | 4.74 | 0.0103 | 0.0005 | |||
| FLO / Flowers Foods, Inc. | 0.01 | -99.19 | 0.24 | -98.93 | 0.0102 | -0.9496 | |||
| SLB / SLB N.V. | 0.00 | 0.00 | 0.23 | 6.64 | 0.0096 | 0.0006 | |||
| EGP / EastGroup Properties, Inc. | 0.00 | 0.30 | 0.22 | 0.90 | 0.0095 | 0.0095 | |||
| NUV / Nuveen Municipal Value Fund, Inc. | 0.02 | -8.95 | 0.22 | -17.87 | 0.0092 | 0.0092 | |||
| US2782651036 / Eaton Vance Corp. | 0.02 | -12.15 | 0.21 | -41.27 | 0.0090 | 0.0090 | |||
| DIA / SPDR Dow Jones Industrial Average ETF Trust | 0.00 | 0.20 | 0.0087 | 0.0087 | |||||
| CODI / Compass Diversified | 0.01 | 0.35 | 0.18 | 3.43 | 0.0077 | 0.0003 | |||
| ISBC / Investors Bancorp Inc | 0.01 | 0.00 | 0.14 | 16.67 | 0.0060 | 0.0009 | |||
| FAX / Abrdn Asia-Pacific Income Fund Inc | 0.01 | -29.18 | 0.06 | -35.71 | 0.0027 | 0.0027 | |||
| DRQ / Dril-Quip, Inc. | 0.00 | -100.00 | 0.00 | -100.00 | -0.0794 | ||||
| 78425V104 / SI Financial Group, Inc. | 0.00 | -100.00 | 0.00 | -100.00 | -0.0116 | ||||
| HMHC / Houghton Mifflin Harcourt Co | 0.00 | -100.00 | 0.00 | -100.00 | 0.0000 | 0.0000 | |||
| DGICA / Donegal Group Inc. | 0.00 | -100.00 | 0.00 | -100.00 | -0.0122 | ||||
| TRV / The Travelers Companies, Inc. | 0.00 | -100.00 | 0.00 | -100.00 | -0.0163 | ||||
| RE / Everest Re Group Ltd | 0.00 | -100.00 | 0.00 | -100.00 | -0.0123 | ||||
| CB / Chubb Limited | 0.00 | -100.00 | 0.00 | -100.00 | -0.0159 | ||||
| AMGN / Amgen Inc. | 0.00 | -100.00 | 0.00 | -100.00 | 0.0000 | 0.0000 | |||
| EPI / WisdomTree Trust - WisdomTree India Earnings Fund | 0.00 | -100.00 | 0.00 | -100.00 | 0.0000 | 0.0000 | |||
| C / Citigroup Inc. | 0.00 | -100.00 | 0.00 | -100.00 | -0.0256 | ||||
| GL / Globe Life Inc. | 0.00 | -100.00 | 0.00 | -100.00 | -0.0109 | ||||
| BLMT / BSB Bancorp, Inc. | 0.00 | -100.00 | 0.00 | -100.00 | -0.0136 | ||||
| 904784709 / Unilever N.V. | 0.00 | -100.00 | 0.00 | -100.00 | -0.0088 | ||||
| IROQ / IF Bancorp, Inc. | 0.00 | -100.00 | 0.00 | -100.00 | -0.0193 | ||||
| EVBN / Evans Bancorp, Inc. | 0.00 | -100.00 | 0.00 | -100.00 | 0.0000 | 0.0000 | |||
| EMCI / EMC Insurance Group, Inc. | 0.00 | -100.00 | 0.00 | -100.00 | -0.0182 | ||||
| HASI / HA Sustainable Infrastructure Capital, Inc. | 0.00 | -100.00 | 0.00 | -100.00 | -0.1314 | ||||
| CSBK / Clifton Bancorp Inc. | 0.00 | -100.00 | 0.00 | -100.00 | 0.0000 | 0.0000 | |||
| PBSK / Poage Bankshares, Inc. | 0.00 | -100.00 | 0.00 | -100.00 | 0.0000 | 0.0000 | |||
| CST / CST Brands, Inc. | 0.00 | -100.00 | 0.00 | -100.00 | -0.7396 | ||||
| RECN / Resources Connection, Inc. | 0.00 | -100.00 | 0.00 | -100.00 | 0.0000 | 0.0000 | |||
| HBNC / Horizon Bancorp, Inc. | 0.00 | -100.00 | 0.00 | -100.00 | -0.0207 | ||||
| STE / STERIS plc | 0.00 | -100.00 | 0.00 | -100.00 | -0.0091 | ||||
| GS / The Goldman Sachs Group, Inc. | 0.00 | -100.00 | 0.00 | -100.00 | -0.0194 | ||||
| VIVO / Meridian Bioscience Inc. | 0.00 | -100.00 | 0.00 | -100.00 | -0.0675 | ||||
| V / Visa Inc. | 0.00 | -100.00 | 0.00 | -100.00 | -0.0254 | ||||
| JPM / JPMorgan Chase & Co. | 0.00 | -100.00 | 0.00 | -100.00 | -0.0295 | ||||
| PFG / Principal Financial Group, Inc. | 0.00 | -100.00 | 0.00 | -100.00 | -0.0154 | ||||
| MDT / Medtronic plc | 0.00 | -100.00 | 0.00 | -100.00 | -0.0409 |