Estatísticas Básicas
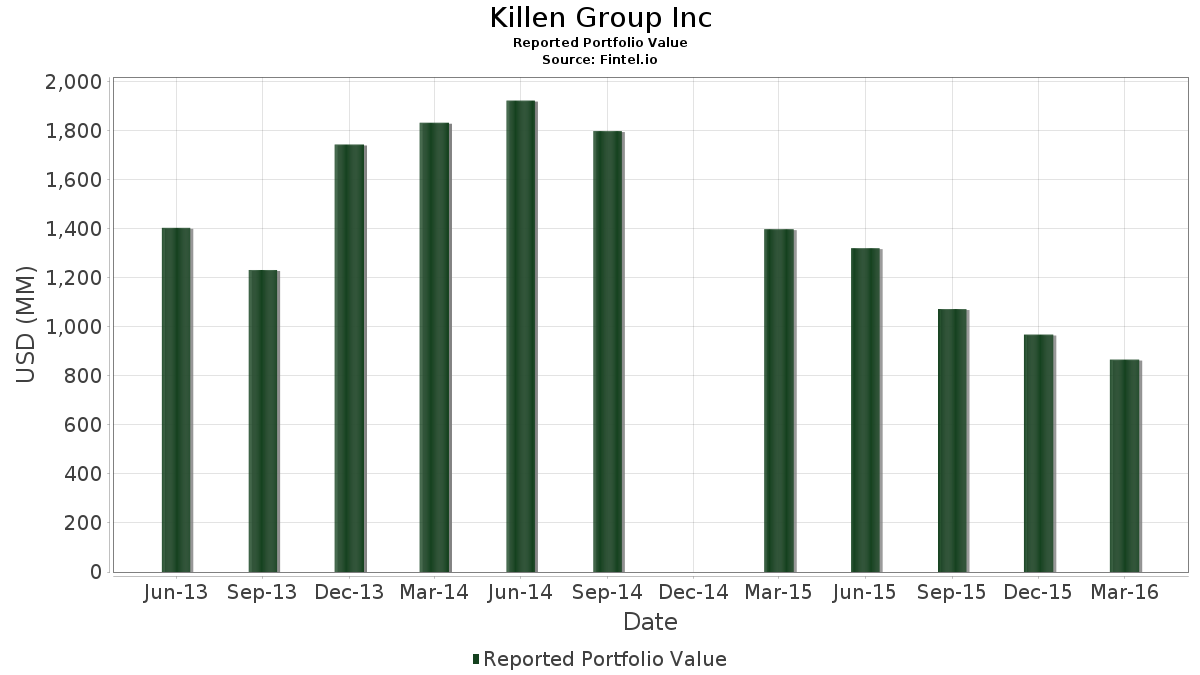
| Valor do Portfólio | $ 865,727,000 |
| Posições Atuais | 111 |
Últimas Participações, Desempenho, AUM (de 13F, 13D)
Killen Group Inc divulgou 111 participações totais em seus últimos arquivamentos da SEC. O valor mais recente da carteira é calculado como $ 865,727,000 USD. O Ativo Total Sob Gestão (AUM) é esse valor mais o caixa (que não é divulgado). As principais posições de Killen Group Inc são Ciena Corp. 0.875% Bond due 2017-06-15 (US:171779AE1) , Nuance Communications, Inc. 2.75% Bond Due 11/1/2031 (US:US67020YAF79) , TiVo Inc. Bond (US:888706AF5) , Pitney Bowes Inc. (US:PBI) , and FLIR Systems, Inc. (US:US3024451011) . As novas posições de Killen Group Inc incluem Ciena Corp. 0.875% Bond due 2017-06-15 (US:171779AE1) , Nuance Communications, Inc. 2.75% Bond Due 11/1/2031 (US:US67020YAF79) , TiVo Inc. Bond (US:888706AF5) , Nintendo Co., Ltd. - Depositary Receipt (Common Stock) (US:NTDOY) , and SEACOR Holdings, Inc. Bond (US:US811904AM35) .
Maiores Aumentos Este Trimestre
Usamos a mudança na alocação do portfólio porque esta é a métrica mais significativa. As mudanças podem ser devido a operações ou mudanças nos preços das ações.
| Ativo | Ações (MM) |
Valor (MM$) |
% do Portfólio | Δ% do Portfólio |
|---|---|---|---|---|
| 0.87 | 15.40 | 1.7787 | 1.7787 | |
| 0.71 | 20.41 | 2.3577 | 1.6270 | |
| 0.36 | 11.22 | 1.2961 | 1.2961 | |
| 1.04 | 12.22 | 1.4121 | 0.8512 | |
| 0.53 | 18.98 | 2.1925 | 0.7535 | |
| 0.30 | 19.91 | 2.2993 | 0.6044 | |
| 0.74 | 11.67 | 1.3475 | 0.5415 | |
| 1.42 | 15.32 | 1.7693 | 0.4900 | |
| 0.56 | 18.44 | 2.1303 | 0.4517 | |
| 0.09 | 4.09 | 0.4728 | 0.4196 |
Maiores Diminuições Este Trimestre
Usamos a mudança na alocação do portfólio porque esta é a métrica mais significativa. As mudanças podem ser devido a operações ou mudanças nos preços das ações.
| Ativo | Ações (MM) |
Valor (MM$) |
% do Portfólio | Δ% do Portfólio |
|---|---|---|---|---|
| 0.00 | 0.00 | -1.1054 | ||
| 0.15 | 5.49 | 0.6339 | -0.9999 | |
| 34.85 | 4.0257 | -0.8881 | ||
| 0.14 | 6.64 | 0.7670 | -0.8340 | |
| 0.50 | 6.87 | 0.7934 | -0.7094 | |
| 1.30 | 5.96 | 0.6883 | -0.7059 | |
| 0.61 | 11.97 | 1.3823 | -0.6601 | |
| 0.51 | 12.03 | 1.3896 | -0.4993 | |
| 0.21 | 11.09 | 1.2810 | -0.4267 | |
| 0.51 | 5.39 | 0.6224 | -0.4243 |
Arquivamentos 13F e Fundo
Este formulário foi arquivado em 2016-04-27 para o período de relatório 2016-03-31. Clique no ícone de link para ver o histórico completo da transação.
Atualize para desbloquear dados premium e exportar para Excel ![]() .
.
| Ativo | Tipo | Preço Médio por Ação | Ações (MM) |
ΔAções (%) |
Valor ($MM) |
ΔAções (%) |
Portfólio (%) |
ΔPortfólio (%) |
|
|---|---|---|---|---|---|---|---|---|---|
| 171779AE1 / Ciena Corp. 0.875% Bond due 2017-06-15 | 52.43 | 0.97 | 0.0000 | ||||||
| US67020YAF79 / Nuance Communications, Inc. 2.75% Bond Due 11/1/2031 | 34.85 | -26.70 | 4.0257 | -0.8881 | |||||
| 888706AF5 / TiVo Inc. Bond | 29.86 | 11.05 | 0.0000 | ||||||
| FELCOR LODGING TRUST INC SERIE / cp (31430F200) | 1.13 | -8.85 | 28.46 | -8.63 | 0.0000 | ||||
| PBI / Pitney Bowes Inc. | 1.12 | -9.41 | 24.23 | -5.50 | 2.7982 | 0.1490 | |||
| US3024451011 / FLIR Systems, Inc. | 0.70 | -13.82 | 23.04 | 1.17 | 2.6608 | 0.3078 | |||
| GLW / Corning Incorporated | 1.05 | -7.24 | 21.86 | 6.00 | 2.5250 | 0.3940 | |||
| GSK / GSK plc - Depositary Receipt (Common Stock) | 0.51 | -9.91 | 20.75 | -9.46 | 2.3973 | 0.0284 | |||
| CABGY / Carlsberg A/S - Depositary Receipt (Common Stock) | 1.07 | -6.19 | 20.56 | 1.08 | 2.3748 | 0.2728 | |||
| PHG / Koninklijke Philips N.V. - Depositary Receipt (Common Stock) | 0.71 | 157.31 | 20.41 | 188.66 | 2.3577 | 1.6270 | |||
| SNI / Scripps Networks Interactive, Inc. | 0.30 | 2.30 | 19.91 | 21.36 | 2.2993 | 0.6044 | |||
| NYCB.PRU / New York Community Capital Trust V - Preferred Security | 0.39 | 0.59 | 19.47 | 1.81 | 2.2490 | 0.2728 | |||
| FE / FirstEnergy Corp. | 0.53 | 20.24 | 18.98 | 36.31 | 2.1925 | 0.7535 | |||
| SONY / Sony Group Corporation - Depositary Receipt (Common Stock) | 0.73 | -5.03 | 18.72 | -0.74 | 2.1619 | 0.2133 | |||
| LDR / Landauer, Inc. | 0.56 | 13.02 | 18.44 | 13.54 | 2.1303 | 0.4517 | |||
| NTDOY / Nintendo Co., Ltd. - Depositary Receipt (Common Stock) | 0.87 | 15.40 | 1.7787 | 1.7787 | |||||
| CRY / Artivion Inc | 1.42 | 24.08 | 15.32 | 23.73 | 1.7693 | 0.4900 | |||
| MAT / Mattel, Inc. | 0.45 | -16.35 | 15.04 | 3.51 | 1.7377 | 0.2358 | |||
| US811904AM35 / SEACOR Holdings, Inc. Bond | 14.71 | 0.0000 | |||||||
| 84860WAA0 / Spirit Realty Capital, Inc. Bond | 13.19 | 26.08 | 0.0000 | ||||||
| SUP / Superior Industries International, Inc. | 0.58 | -20.64 | 12.75 | -4.88 | 1.4732 | 0.0876 | |||
| DGX / Quest Diagnostics Incorporated | 0.18 | -8.84 | 12.53 | -8.44 | 1.4471 | 0.0331 | |||
| LYTS / LSI Industries Inc. | 1.04 | 133.67 | 12.22 | 125.22 | 1.4121 | 0.8512 | |||
| CLI / Mack-Cali Realty Corp. | 0.51 | -34.60 | 12.03 | -34.18 | 1.3896 | -0.4993 | |||
| EBF / Ennis, Inc. | 0.61 | -40.38 | 11.97 | -39.45 | 1.3823 | -0.6601 | |||
| CTS / CTS Corporation | 0.74 | 67.62 | 11.67 | 49.56 | 1.3475 | 0.5415 | |||
| US84860WAB81 / Spirit Realty Capital, Inc. Bond | 11.25 | -14.70 | 0.0000 | ||||||
| TSRA / Tessera Technologies, Inc. | 0.36 | 11.22 | 1.2961 | 1.2961 | |||||
| CCL / Carnival Corporation & plc | 0.21 | -30.71 | 11.09 | -32.89 | 1.2810 | -0.4267 | |||
| EXC / Exelon Corporation | 0.22 | -19.68 | 10.78 | -2.28 | 1.2448 | 0.1051 | |||
| HALL / Hallmark Financial Services, Inc. | 0.84 | -27.20 | 9.67 | -28.38 | 1.1165 | -0.2783 | |||
| EXC / Exelon Corporation | 0.26 | 9.44 | 1.0902 | -0.2087 | |||||
| KMG / KMG Chemicals, Inc. | 0.41 | -31.78 | 9.39 | -31.63 | 1.0843 | -0.3346 | |||
| NOK / Nokia Oyj - Depositary Receipt (Common Stock) | 1.56 | -20.14 | 9.23 | -32.77 | 1.0659 | -0.3525 | |||
| MRCY / Mercury Systems, Inc. | 0.44 | -39.02 | 8.83 | -32.57 | 1.0202 | -0.3334 | |||
| PCTI / PCTEL, Inc. | 1.66 | -0.38 | 7.94 | 4.66 | 0.9175 | 0.1332 | |||
| HOFT / Hooker Furnishings Corporation | 0.23 | -51.14 | 7.49 | -36.41 | 0.8652 | -0.3520 | |||
| NLOK / NortonLifeLock Inc | 0.39 | 62.99 | 7.13 | 42.63 | 0.8231 | 0.3068 | |||
| ACCO / ACCO Brands Corporation | 0.79 | -50.37 | 7.07 | -37.50 | 0.8163 | -0.3522 | |||
| GHM / Graham Corporation | 0.35 | -28.17 | 6.88 | -14.96 | 0.7945 | -0.0413 | |||
| DCOM / Dime Community Bancshares, Inc. | 0.39 | -30.26 | 6.87 | -29.74 | 0.7934 | -0.2169 | |||
| RTEC / Rudolph Technologies, Inc. | 0.50 | -50.83 | 6.87 | -52.77 | 0.7934 | -0.7094 | |||
| 247850100 / Deltic Timber Corp. | 0.11 | -18.63 | 6.77 | -16.87 | 0.7822 | -0.0596 | |||
| SHYF / The Shyft Group, Inc. | 1.69 | -33.84 | 6.66 | -15.98 | 0.7698 | -0.0498 | |||
| GVA / Granite Construction Incorporated | 0.14 | -61.53 | 6.64 | -57.14 | 0.7670 | -0.8340 | |||
| CDR / Cedar Realty Trust Inc | 0.92 | -41.60 | 6.63 | -40.35 | 0.7659 | -0.3829 | |||
| US4989042001 / Knoll Inc | 0.28 | -44.62 | 6.10 | -36.23 | 0.7050 | -0.2840 | |||
| ARNC / Arconic Corporation | 0.63 | -10.58 | 6.01 | -13.21 | 0.6938 | -0.0214 | |||
| VG / Venture Global, Inc. | 1.30 | -44.52 | 5.96 | -55.83 | 0.6883 | -0.7059 | |||
| NCI / Neo-Concept International Group Holdings Limited | 0.37 | -32.07 | 5.91 | -33.13 | 0.6825 | -0.2307 | |||
| SWC / Stillwater Mining Company | 0.54 | -46.67 | 5.77 | -33.73 | 0.6666 | -0.2333 | |||
| AA / Alcoa Corporation | 0.17 | -19.57 | 5.69 | -20.35 | 0.6568 | -0.0810 | |||
| AEIS / Advanced Energy Industries, Inc. | 0.16 | -52.50 | 5.64 | -41.47 | 0.6514 | -0.3442 | |||
| SCSC / ScanSource, Inc. | 0.14 | -40.27 | 5.58 | -25.14 | 0.6447 | -0.1257 | |||
| MYGN / Myriad Genetics, Inc. | 0.15 | -59.98 | 5.49 | -65.29 | 0.6339 | -0.9999 | |||
| LNDC / Landec Corp. | 0.51 | -40.06 | 5.39 | -46.80 | 0.6224 | -0.4243 | |||
| RPXC / RPX Corporation | 0.45 | -20.25 | 5.05 | -18.36 | 0.5837 | -0.0559 | |||
| RAIL / FreightCar America, Inc. | 0.30 | -33.80 | 4.67 | -46.92 | 0.5393 | -0.3697 | |||
| MEI / Methode Electronics, Inc. | 0.16 | -41.30 | 4.65 | -46.08 | 0.5371 | -0.3541 | |||
| PLXS / Plexus Corp. | 0.11 | -45.98 | 4.43 | -38.86 | 0.5116 | -0.2370 | |||
| HNRG / Hallador Energy Company | 0.97 | -33.38 | 4.42 | -33.24 | 0.5109 | -0.1737 | |||
| SYNA / Synaptics Incorporated | 0.06 | -48.09 | 4.42 | -48.48 | 0.5101 | -0.3756 | |||
| WIRE / Encore Wire Corporation | 0.11 | -26.13 | 4.33 | -22.47 | 0.5003 | -0.0770 | |||
| CHKDG / Chesapeake Energy Corp., 5.00% Cumulative Convertible Preferred Stock | 0.26 | -14.41 | 4.25 | -19.56 | 0.4906 | -0.0551 | |||
| HBAN / Huntington Bancshares Incorporated | 0.44 | -31.98 | 4.17 | -41.33 | 0.4811 | -0.2525 | |||
| NUE / Nucor Corporation | 0.09 | 576.89 | 4.09 | 694.76 | 0.4728 | 0.4196 | |||
| CROX / Crocs, Inc. | 0.41 | -43.43 | 3.90 | -46.86 | 0.4511 | -0.3083 | |||
| CAAS / China Automotive Systems, Inc. | 0.79 | -20.20 | 3.68 | -19.15 | 0.4252 | -0.0453 | |||
| GORO / Gold Resource Corporation | 1.52 | 85.26 | 3.55 | 160.03 | 0.4103 | 0.2691 | |||
| BRCD / Brocade Communications Systems, Inc. | 0.33 | -11.49 | 3.52 | 2.03 | 0.4068 | 0.0501 | |||
| RIO / Rio Tinto Group - Depositary Receipt (Common Stock) | 0.12 | 3.47 | 0.4011 | 0.4011 | |||||
| WGO / Winnebago Industries, Inc. | 0.15 | -42.67 | 3.41 | -35.32 | 0.3937 | -0.1508 | |||
| MGRC / McGrath RentCorp | 0.13 | -41.55 | 3.37 | -41.81 | 0.3889 | -0.2090 | |||
| / CHRISTOPHER & BANKS CORP | 1.36 | -16.86 | 3.24 | 20.39 | 0.3744 | 0.0962 | |||
| GM / General Motors Company | 0.10 | 3.68 | 3.11 | -4.19 | 0.3590 | 0.0238 | |||
| CAIAF / CA Immobilien Anlagen AG | 0.10 | -56.93 | 3.08 | -53.57 | 0.3558 | -0.3298 | |||
| UNM / Unum Group | 0.10 | -3.12 | 3.01 | -10.04 | 0.3479 | 0.0019 | |||
| JPM / JPMorgan Chase & Co. | 0.05 | -7.83 | 2.97 | -17.35 | 0.3433 | -0.0283 | |||
| BB / BlackBerry Limited | 0.36 | -6.53 | 2.90 | -18.51 | 0.3352 | -0.0328 | |||
| DSX / Diana Shipping Inc. | 1.05 | -17.91 | 2.81 | -49.61 | 0.3242 | -0.2515 | |||
| AGO / Assured Guaranty Ltd. | 0.11 | -6.48 | 2.73 | -10.48 | 0.3158 | 0.0002 | |||
| GME / GameStop Corp. | 0.08 | 610.22 | 2.61 | 704.31 | 0.3019 | 0.2684 | |||
| NR / NPK International Inc. | 0.60 | -38.67 | 2.60 | -49.83 | 0.3007 | -0.2355 | |||
| AFL / Aflac Incorporated | 0.04 | -49.15 | 2.33 | -46.41 | 0.2696 | -0.1804 | |||
| UIS / Unisys Corporation | 0.28 | -39.08 | 2.18 | -57.56 | 0.2522 | -0.2794 | |||
| HIG / The Hartford Insurance Group, Inc. | 0.05 | -65.83 | 2.11 | -63.77 | 0.2434 | -0.3575 | |||
| 16115QAC4 / Chart Industries, Inc. 2% Bond Due 8/1/2018 | 2.10 | 0.0000 | |||||||
| ELY / Topgolf Callaway Brands Corp | 0.22 | -59.41 | 2.05 | -60.70 | 0.2370 | -0.3026 | |||
| EXPR / Express, Inc. | 0.07 | 1.52 | 0.1756 | 0.1756 | |||||
| MGPI / MGP Ingredients, Inc. | 0.06 | -31.66 | 1.44 | -36.19 | 0.1668 | -0.0671 | |||
| MOS / The Mosaic Company | 0.04 | 150.49 | 1.11 | 145.35 | 0.1281 | 0.0814 | |||
| DVN / Devon Energy Corporation | 0.02 | 270.27 | 0.68 | 217.84 | 0.0782 | 0.0562 | |||
| CVX / Chevron Corporation | 0.01 | 2.12 | 0.67 | 8.31 | 0.0768 | 0.0134 | |||
| PPL / PPL Corporation | 0.02 | 0.00 | 0.66 | 11.51 | 0.0761 | 0.0150 | |||
| WFC / Wells Fargo & Company | 0.01 | 38.67 | 0.59 | 23.24 | 0.0686 | 0.0188 | |||
| SQI / SciQuest, Inc. | 0.04 | 0.58 | 0.0670 | 0.0670 | |||||
| J / Jacobs Solutions Inc. | 0.01 | 0.00 | 0.54 | 3.82 | 0.0628 | 0.0087 | |||
| ADTN / ADTRAN Holdings, Inc. | 0.03 | -13.33 | 0.53 | 1.74 | 0.0608 | 0.0073 | |||
| WLBA / WESTMORELAND COAL CO | 0.07 | 7.69 | 0.51 | 32.20 | 0.0583 | 0.0189 | |||
| JOY / Joy Global, Inc. | 0.03 | 20.00 | 0.48 | 53.02 | 0.0557 | 0.0231 | |||
| AOSL / Alpha and Omega Semiconductor Limited | 0.04 | -20.00 | 0.47 | 3.27 | 0.0548 | 0.0073 | |||
| ITRI / Itron, Inc. | 0.01 | -27.30 | 0.44 | -16.23 | 0.0513 | -0.0035 | |||
| CLF / Cleveland-Cliffs Inc. | 0.14 | 19.17 | 0.43 | 125.79 | 0.0496 | 0.0299 | |||
| PHM / PulteGroup, Inc. | 0.02 | 0.35 | 0.0410 | 0.0410 | |||||
| HP / Helmerich & Payne, Inc. | 0.01 | -36.10 | 0.29 | -29.83 | 0.0340 | -0.0093 | |||
| SU / Suncor Energy Inc. | 0.01 | -40.00 | 0.26 | -35.41 | 0.0299 | -0.0115 | |||
| THO / THOR Industries, Inc. | 0.00 | -37.88 | 0.25 | -29.55 | 0.0286 | -0.0077 | |||
| OSIR / Osiris Therapeutics, Inc. | 0.04 | 29.03 | 0.23 | -29.19 | 0.0263 | -0.0069 | |||
| BEBE / bebe stores, inc. | 0.27 | -9.05 | 0.15 | -11.76 | 0.0173 | -0.0002 | |||
| WRES / Warren Resources, Inc. | 0.46 | -27.35 | 0.08 | -40.60 | 0.0091 | -0.0046 | |||
| FTEK / Fuel Tech, Inc. | 0.04 | 60.00 | 0.07 | 48.94 | 0.0081 | 0.0032 | |||
| CHK / Chesapeake Energy Corporation | 0.00 | 0.00 | 0.0000 | 0.0000 | |||||
| ARE.PRD / Alexandria Real Estate Equities, Inc. 7.00% Series D Preferred | 0.00 | -100.00 | 0.00 | -100.00 | -1.1054 | ||||
| ZEUS / Olympic Steel, Inc. | 0.00 | 0.00 | 0.0000 | 0.0000 | |||||
| ATI / ATI Inc. | 0.00 | 0.00 | 0.0000 | 0.0000 | |||||
| GIFI / Gulf Island Fabrication, Inc. | 0.00 | 0.00 | 0.0000 | 0.0000 | |||||
| MSFT / Microsoft Corporation | 0.00 | -100.00 | 0.00 | -100.00 | -0.0283 | ||||
| IPI / Intrepid Potash, Inc. | 0.00 | -100.00 | 0.00 | -100.00 | -0.1993 | ||||
| NWL / Newell Brands Inc. | 0.00 | 0.00 | 0.0000 | 0.0000 | |||||
| BTU / Peabody Energy Corporation | 0.00 | -100.00 | 0.00 | -100.00 | -0.0091 | ||||
| AVP / Avon Products, Inc. | 0.00 | 0.00 | 0.0000 | 0.0000 |