Estatísticas Básicas
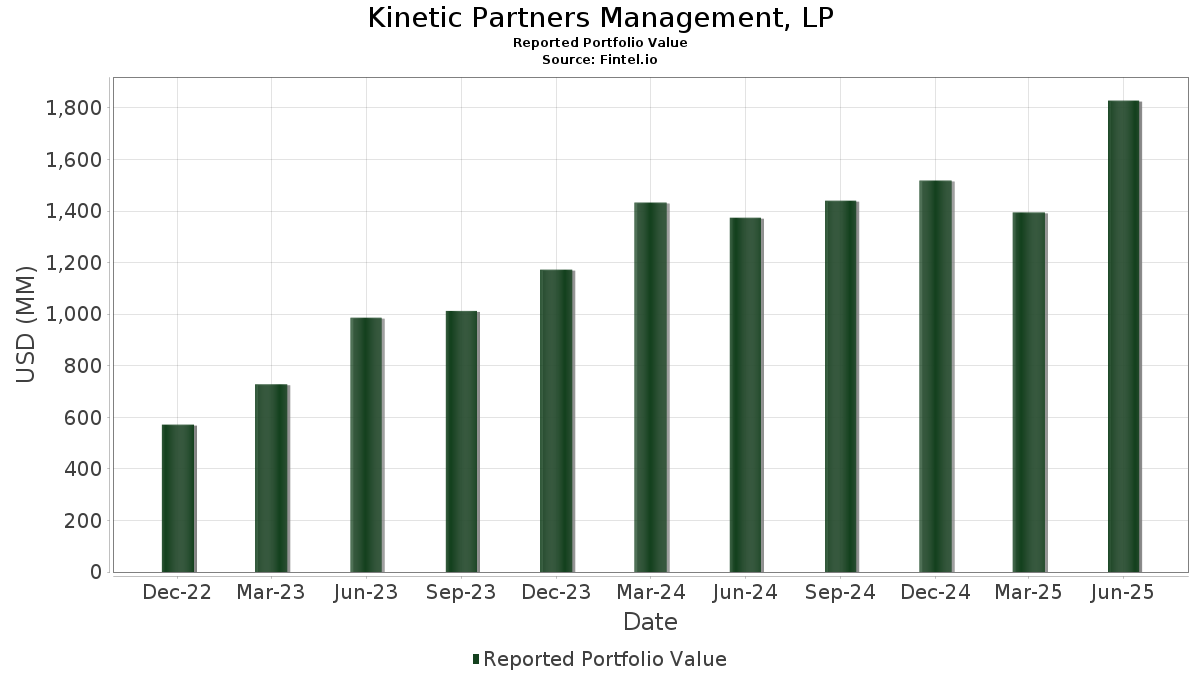
| Valor do Portfólio | $ 2,064,413,180 |
| Posições Atuais | 42 |
Últimas Participações, Desempenho, AUM (de 13F, 13D)
Kinetic Partners Management, LP divulgou 42 participações totais em seus últimos arquivamentos da SEC. O valor mais recente da carteira é calculado como $ 2,064,413,180 USD. O Ativo Total Sob Gestão (AUM) é esse valor mais o caixa (que não é divulgado). As principais posições de Kinetic Partners Management, LP são Amazon.com, Inc. (US:AMZN) , NVIDIA Corporation (US:NVDA) , Sea Limited - Depositary Receipt (Common Stock) (US:SE) , Taiwan Semiconductor Manufacturing Company Limited - Depositary Receipt (Common Stock) (US:TSM) , and Carpenter Technology Corporation (US:CRS) . As novas posições de Kinetic Partners Management, LP incluem Woodward, Inc. (US:WWD) , Warner Bros. Discovery, Inc. (US:WBD) , Seagate Technology Holdings plc (US:STX) , JFrog Ltd. (US:FROG) , and SiteOne Landscape Supply, Inc. (US:SITE) .
Maiores Aumentos Este Trimestre
Usamos a mudança na alocação do portfólio porque esta é a métrica mais significativa. As mudanças podem ser devido a operações ou mudanças nos preços das ações.
| Ativo | Ações (MM) |
Valor (MM$) |
% do Portfólio | Δ% do Portfólio |
|---|---|---|---|---|
| META / Meta Platforms, Inc. | 0.09 | 67.64 | 3.2763 | 3.2763 |
| WWD / Woodward, Inc. | 0.22 | 56.56 | 2.7396 | 2.7396 |
| RDDT / Reddit, Inc. | 0.21 | 48.09 | 2.3295 | 2.3295 |
| WBD / Warner Bros. Discovery, Inc. | 2.32 | 45.23 | 2.1907 | 2.1907 |
| APP / AppLovin Corporation | 0.13 | 92.05 | 4.4589 | 2.1772 |
| GOOG / Alphabet Inc. | 0.23 | 55.65 | 2.6957 | 1.6257 |
| ORCL / Oracle Corporation | 0.12 | 33.30 | 1.6130 | 1.6130 |
| SPOT / Spotify Technology S.A. | 0.10 | 68.75 | 3.3304 | 1.3370 |
| MDB / MongoDB, Inc. | 0.20 | 60.76 | 2.9433 | 1.1752 |
| STX / Seagate Technology Holdings plc | 0.10 | 23.68 | 1.1469 | 1.1469 |
Maiores Diminuições Este Trimestre
Usamos a mudança na alocação do portfólio porque esta é a métrica mais significativa. As mudanças podem ser devido a operações ou mudanças nos preços das ações.
| Ativo | Ações (MM) |
Valor (MM$) |
% do Portfólio | Δ% do Portfólio |
|---|---|---|---|---|
| AVGO / Broadcom Inc. | 0.13 | 43.52 | 2.1080 | -3.8212 |
| AER / AerCap Holdings N.V. | 0.14 | 16.45 | 0.7969 | -2.5980 |
| BKNG / Booking Holdings Inc. | 0.00 | 4.98 | 0.2411 | -2.0422 |
| DASH / DoorDash, Inc. | 0.29 | 79.89 | 3.8696 | -1.9774 |
| DIS / The Walt Disney Company | 0.58 | 66.82 | 3.2367 | -1.3111 |
| GEV / GE Vernova Inc. | 0.02 | 11.17 | 0.5411 | -1.1624 |
| SE / Sea Limited - Depositary Receipt (Common Stock) | 0.61 | 109.36 | 5.2972 | -0.7999 |
| INTU / Intuit Inc. | 0.08 | 51.83 | 2.5107 | -0.7586 |
| OWL / Blue Owl Capital Inc. | 2.77 | 46.91 | 2.2721 | -0.6386 |
| TSM / Taiwan Semiconductor Manufacturing Company Limited - Depositary Receipt (Common Stock) | 0.36 | 101.34 | 4.9090 | -0.6149 |
Arquivamentos 13F e Fundo
Este formulário foi arquivado em 2025-11-14 para o período de relatório 2025-09-30. Clique no ícone de link para ver o histórico completo da transação.
Atualize para desbloquear dados premium e exportar para Excel ![]() .
.
| Ativo | Tipo | Preço Médio por Ação | Ações (MM) |
ΔAções (%) |
Valor ($MM) |
ΔAções (%) |
Portfólio (%) |
ΔPortfólio (%) |
|
|---|---|---|---|---|---|---|---|---|---|
| AMZN / Amazon.com, Inc. | 0.79 | 7.17 | 173.65 | 7.26 | 8.4115 | -0.4427 | |||
| NVDA / NVIDIA Corporation | 0.77 | 5.87 | 142.80 | 25.02 | 6.9170 | 0.6706 | |||
| SE / Sea Limited - Depositary Receipt (Common Stock) | 0.61 | -12.22 | 109.36 | -1.91 | 5.2972 | -0.7999 | |||
| TSM / Taiwan Semiconductor Manufacturing Company Limited - Depositary Receipt (Common Stock) | 0.36 | -18.63 | 101.34 | 0.33 | 4.9090 | -0.6149 | |||
| CRS / Carpenter Technology Corporation | 0.39 | 15.48 | 94.90 | 2.59 | 4.5970 | -0.4620 | |||
| APP / AppLovin Corporation | 0.13 | 7.49 | 92.05 | 120.63 | 4.4589 | 2.1772 | |||
| MSFT / Microsoft Corporation | 0.17 | 18.33 | 88.92 | 23.22 | 4.3074 | 0.3607 | |||
| CVNA / Carvana Co. | 0.23 | 15.55 | 84.94 | 29.36 | 4.1144 | 0.5236 | |||
| DASH / DoorDash, Inc. | 0.29 | -32.28 | 79.89 | -25.28 | 3.8696 | -1.9774 | |||
| FERG / Ferguson Enterprises Inc. | 0.35 | 53.41 | 78.38 | 58.22 | 3.7966 | 1.0874 | |||
| LPX / Louisiana-Pacific Corporation | 0.85 | 0.00 | 75.58 | 3.31 | 3.6613 | -0.3397 | |||
| SPOT / Spotify Technology S.A. | 0.10 | 107.37 | 68.75 | 88.63 | 3.3304 | 1.3370 | |||
| META / Meta Platforms, Inc. | 0.09 | 67.64 | 3.2763 | 3.2763 | |||||
| DIS / The Walt Disney Company | 0.58 | -12.97 | 66.82 | -19.65 | 3.2367 | -1.3111 | |||
| MDB / MongoDB, Inc. | 0.20 | 27.16 | 60.76 | 87.95 | 2.9433 | 1.1752 | |||
| WWD / Woodward, Inc. | 0.22 | 56.56 | 2.7396 | 2.7396 | |||||
| GOOG / Alphabet Inc. | 0.23 | 107.16 | 55.65 | 184.43 | 2.6957 | 1.6257 | |||
| INTU / Intuit Inc. | 0.08 | 0.00 | 51.83 | -13.30 | 2.5107 | -0.7586 | |||
| RDDT / Reddit, Inc. | 0.21 | 48.09 | 2.3295 | 2.3295 | |||||
| OWL / Blue Owl Capital Inc. | 2.77 | 0.00 | 46.91 | -11.87 | 2.2721 | -0.6386 | |||
| WBD / Warner Bros. Discovery, Inc. | 2.32 | 45.23 | 2.1907 | 2.1907 | |||||
| AVGO / Broadcom Inc. | 0.13 | -66.46 | 43.52 | -59.86 | 2.1080 | -3.8212 | |||
| NU / Nu Holdings Ltd. | 2.32 | 0.00 | 37.10 | 16.69 | 1.7973 | 0.0584 | |||
| ORCL / Oracle Corporation | 0.12 | 33.30 | 1.6130 | 1.6130 | |||||
| STX / Seagate Technology Holdings plc | 0.10 | 23.68 | 1.1469 | 1.1469 | |||||
| CPNG / Coupang, Inc. | 0.73 | 23.64 | 1.1453 | 1.1453 | |||||
| FROG / JFrog Ltd. | 0.45 | 21.16 | 1.0248 | 1.0248 | |||||
| SITE / SiteOne Landscape Supply, Inc. | 0.16 | 20.29 | 0.9827 | 0.9827 | |||||
| NCNO / nCino, Inc. | 0.70 | 89.43 | 18.95 | 83.61 | 0.9179 | 0.3535 | |||
| CNM / Core & Main, Inc. | 0.32 | 17.11 | 0.8289 | 0.8289 | |||||
| SHW / The Sherwin-Williams Company | 0.05 | 0.00 | 16.70 | 0.85 | 0.8090 | -0.0967 | |||
| AER / AerCap Holdings N.V. | 0.14 | -74.38 | 16.45 | -73.50 | 0.7969 | -2.5980 | |||
| AEO / American Eagle Outfitters, Inc. | 0.85 | 14.62 | 0.7081 | 0.7081 | |||||
| GTM / ZoomInfo Technologies Inc. | 1.32 | 0.00 | 14.38 | 7.80 | 0.6968 | -0.0329 | |||
| SGI / Somnigroup International Inc. | 0.13 | -52.72 | 11.25 | -41.41 | 0.5447 | -0.5050 | |||
| GEV / GE Vernova Inc. | 0.02 | -69.14 | 11.17 | -64.14 | 0.5411 | -1.1624 | |||
| NFLX / Netflix, Inc. | 0.01 | 22.67 | 11.03 | 9.83 | 0.5343 | -0.0150 | |||
| PFSI / PennyMac Financial Services, Inc. | 0.09 | 1.38 | 10.90 | 26.05 | 0.5281 | 0.0551 | |||
| ATI / ATI Inc. | 0.13 | -43.70 | 10.80 | -46.97 | 0.5232 | -0.5906 | |||
| TSLA / Tesla, Inc. | 0.02 | 0.00 | 7.76 | 40.00 | 0.3759 | 0.0728 | |||
| SHOP / Shopify Inc. | 0.04 | -72.64 | 5.59 | -64.75 | 0.2709 | -0.5967 | |||
| BKNG / Booking Holdings Inc. | 0.00 | -87.22 | 4.98 | -88.08 | 0.2411 | -2.0422 | |||
| CEG / Constellation Energy Corporation | 0.00 | -100.00 | 0.00 | 0.0000 | |||||
| AAON / AAON, Inc. | 0.00 | -100.00 | 0.00 | 0.0000 | |||||
| PTC / PTC Inc. | 0.00 | -100.00 | 0.00 | 0.0000 | |||||
| DBRG / DigitalBridge Group, Inc. | 0.00 | -100.00 | 0.00 | 0.0000 | |||||
| GRAB / Grab Holdings Limited | 0.00 | -100.00 | 0.00 | 0.0000 | |||||
| TREX / Trex Company, Inc. | 0.00 | -100.00 | 0.00 | 0.0000 | |||||
| DDOG / Datadog, Inc. | 0.00 | -100.00 | 0.00 | 0.0000 | |||||
| RH / RH | 0.00 | -100.00 | 0.00 | 0.0000 |