Estatísticas Básicas
| Valor do Portfólio | $ 204,031,146 |
| Posições Atuais | 23 |
Últimas Participações, Desempenho, AUM (de 13F, 13D)
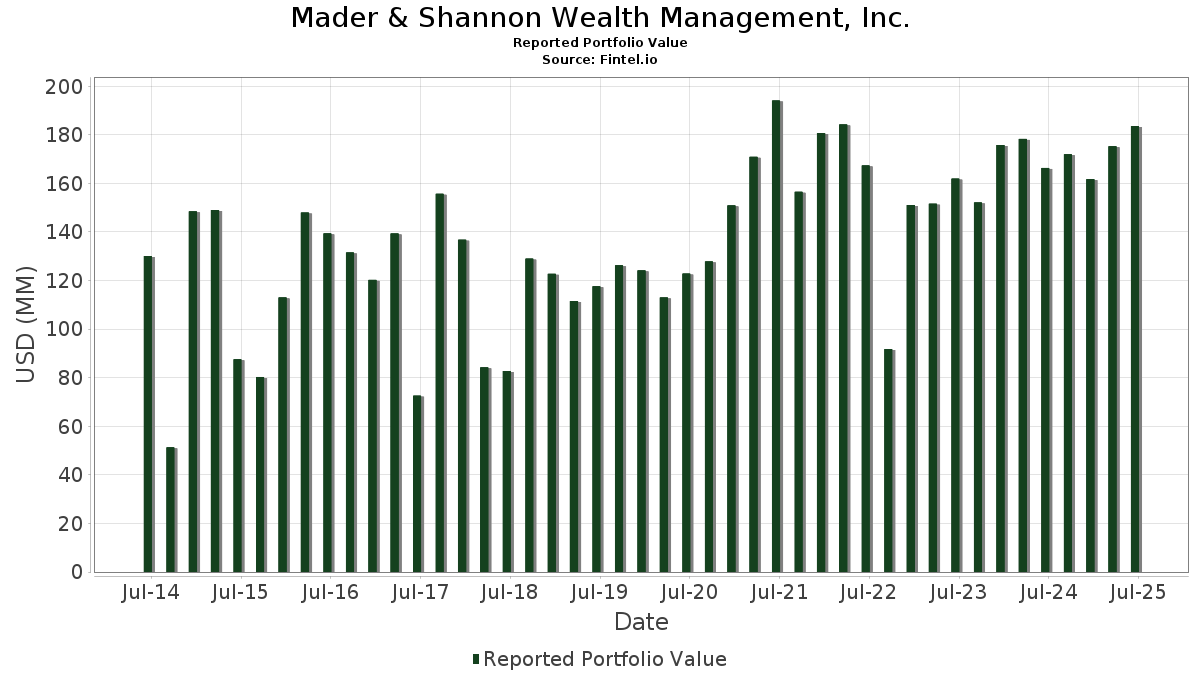
Mader & Shannon Wealth Management, Inc. divulgou 23 participações totais em seus últimos arquivamentos da SEC. O valor mais recente da carteira é calculado como $ 204,031,146 USD. O Ativo Total Sob Gestão (AUM) é esse valor mais o caixa (que não é divulgado). As principais posições de Mader & Shannon Wealth Management, Inc. são iShares Gold Trust (US:IAU) , SPDR Gold Shares (US:GLD) , iShares Trust - iShares 1-3 Year Treasury Bond ETF (US:SHY) , Invesco Exchange-Traded Fund Trust II - Invesco Variable Rate Preferred ETF (US:VRP) , and Invesco Exchange-Traded Fund Trust II - Invesco Preferred ETF (US:PGX) . As novas posições de Mader & Shannon Wealth Management, Inc. incluem Invesco Exchange-Traded Fund Trust II - Invesco Variable Rate Preferred ETF (US:VRP) , .
Maiores Aumentos Este Trimestre
Usamos a mudança na alocação do portfólio porque esta é a métrica mais significativa. As mudanças podem ser devido a operações ou mudanças nos preços das ações.
| Ativo | Ações (MM) |
Valor (MM$) |
% do Portfólio | Δ% do Portfólio |
|---|---|---|---|---|
| 0.86 | 21.16 | 10.3728 | 10.3728 | |
| 1.25 | 14.45 | 7.0815 | 7.0815 | |
| 0.15 | 11.67 | 5.7221 | 1.5002 | |
| 0.41 | 29.50 | 14.4578 | 0.9049 | |
| 0.08 | 29.49 | 14.4534 | 0.8865 | |
| 0.02 | 4.56 | 2.2326 | 0.4420 | |
| 0.02 | 3.99 | 1.9561 | 0.3672 | |
| 0.01 | 7.13 | 3.4928 | 0.3009 | |
| 0.07 | 3.57 | 1.7506 | 0.2390 | |
| 0.02 | 3.10 | 1.5203 | 0.1944 |
Maiores Diminuições Este Trimestre
Usamos a mudança na alocação do portfólio porque esta é a métrica mais significativa. As mudanças podem ser devido a operações ou mudanças nos preços das ações.
| Ativo | Ações (MM) |
Valor (MM$) |
% do Portfólio | Δ% do Portfólio |
|---|---|---|---|---|
| 0.02 | 1.74 | 0.8524 | -9.4631 | |
| 0.34 | 27.85 | 13.6475 | -6.3731 | |
| 0.03 | 3.15 | 1.5420 | -3.9684 | |
| 0.04 | 7.11 | 3.4853 | -0.7809 | |
| 0.14 | 5.65 | 2.7679 | -0.6536 | |
| 0.02 | 5.20 | 2.5483 | -0.2379 | |
| 0.02 | 2.03 | 0.9963 | -0.0446 | |
| 0.00 | 0.25 | 0.1228 | -0.0056 |
Arquivamentos 13F e Fundo
Este formulário foi arquivado em 2025-11-12 para o período de relatório 2025-09-30. Clique no ícone de link para ver o histórico completo da transação.
Atualize para desbloquear dados premium e exportar para Excel ![]() .
.
| Ativo | Tipo | Preço Médio por Ação | Ações (MM) |
ΔAções (%) |
Valor ($MM) |
ΔAções (%) |
Portfólio (%) |
ΔPortfólio (%) |
|
|---|---|---|---|---|---|---|---|---|---|
| IAU / iShares Gold Trust | 0.41 | 1.59 | 29.50 | 18.55 | 14.4578 | 0.9049 | |||
| GLD / SPDR Gold Shares | 0.08 | 1.53 | 29.49 | 18.40 | 14.4534 | 0.8865 | |||
| SHY / iShares Trust - iShares 1-3 Year Treasury Bond ETF | 0.34 | -24.34 | 27.85 | -24.24 | 13.6475 | -6.3731 | |||
| VRP / Invesco Exchange-Traded Fund Trust II - Invesco Variable Rate Preferred ETF | 0.86 | 21.16 | 10.3728 | 10.3728 | |||||
| PGX / Invesco Exchange-Traded Fund Trust II - Invesco Preferred ETF | 1.25 | 14.45 | 7.0815 | 7.0815 | |||||
| GDX / VanEck ETF Trust - VanEck Gold Miners ETF | 0.15 | 2.64 | 11.67 | 50.61 | 5.7221 | 1.5002 | |||
| MLM / Martin Marietta Materials, Inc. | 0.01 | 2.04 | 7.31 | 17.14 | 3.5837 | 0.1843 | |||
| TMO / Thermo Fisher Scientific Inc. | 0.01 | 1.66 | 7.13 | 21.60 | 3.4928 | 0.3009 | |||
| CDW / CDW Corporation | 0.04 | 1.80 | 7.11 | -9.21 | 3.4853 | -0.7809 | |||
| KNX / Knight-Swift Transportation Holdings Inc. | 0.14 | 0.64 | 5.65 | -10.09 | 2.7679 | -0.6536 | |||
| AMZN / Amazon.com, Inc. | 0.02 | 1.56 | 5.20 | 1.64 | 2.5483 | -0.2379 | |||
| UNH / UnitedHealth Group Incorporated | 0.01 | 1.67 | 5.16 | 12.54 | 2.5303 | 0.0314 | |||
| FSLR / First Solar, Inc. | 0.02 | 4.01 | 4.56 | 38.58 | 2.2326 | 0.4420 | |||
| DHI / D.R. Horton, Inc. | 0.02 | 4.08 | 3.99 | 36.82 | 1.9561 | 0.3672 | |||
| ITB / iShares Trust - iShares U.S. Home Construction ETF | 0.04 | 4.65 | 3.92 | 20.49 | 1.9230 | 0.1491 | |||
| DINO / HF Sinclair Corporation | 0.07 | 1.01 | 3.57 | 28.68 | 1.7506 | 0.2390 | |||
| MPC / Marathon Petroleum Corporation | 0.02 | 1.15 | 3.23 | 17.37 | 1.5832 | 0.0841 | |||
| SHV / iShares Trust - iShares 0-1 Year Treasury Bond ETF | 0.03 | -68.92 | 3.15 | -68.90 | 1.5420 | -3.9684 | |||
| VLO / Valero Energy Corporation | 0.02 | 0.60 | 3.10 | 27.40 | 1.5203 | 0.1944 | |||
| PSX / Phillips 66 | 0.02 | 1.71 | 2.81 | 15.97 | 1.3774 | 0.0574 | |||
| XLB / The Select Sector SPDR Trust - State Street Materials Select Sector SPDR ETF | 0.02 | 4.23 | 2.03 | 6.33 | 0.9963 | -0.0446 | |||
| SGOV / iShares Trust - iShares 0-3 Month Treasury Bond ETF | 0.02 | -90.82 | 1.74 | -90.82 | 0.8524 | -9.4631 | |||
| WMT / Walmart Inc. | 0.00 | 0.83 | 0.25 | 6.38 | 0.1228 | -0.0056 | |||
| FCX / Freeport-McMoRan Inc. | 0.00 | -100.00 | 0.00 | 0.0000 |