Estatísticas Básicas
| Gerente | Hamish Douglass |
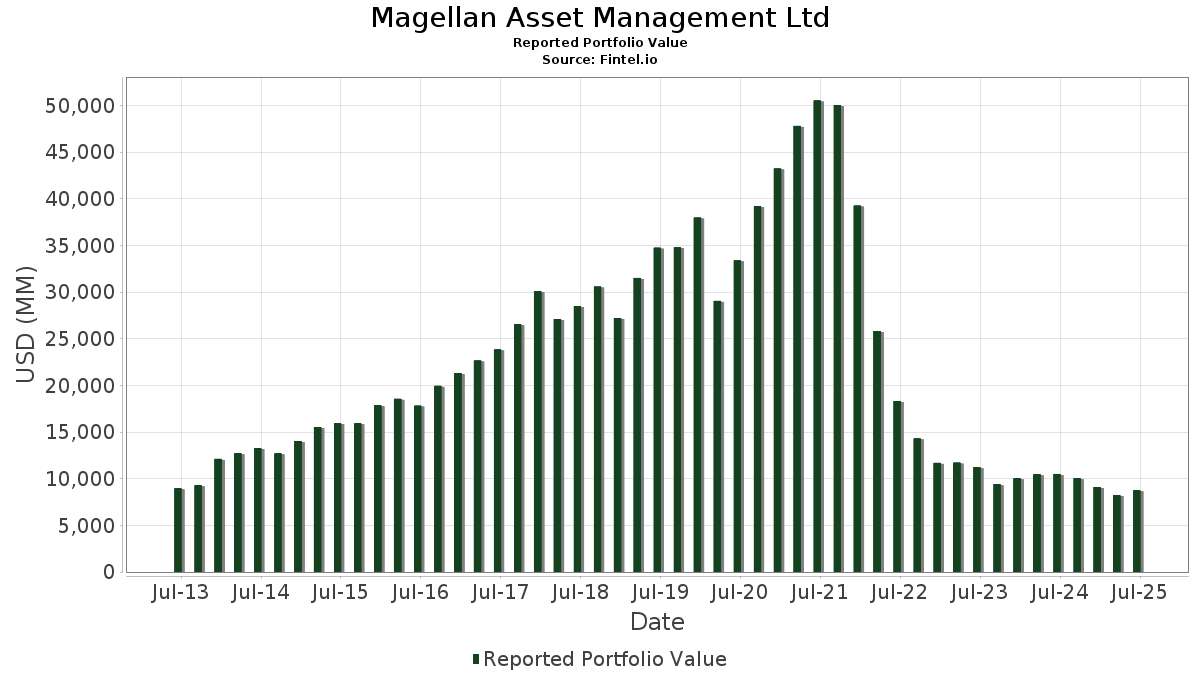
| Valor do Portfólio | $ 8,443,490,453 |
| Posições Atuais | 82 |
Últimas Participações, Desempenho, AUM (de 13F, 13D)
Magellan Asset Management Ltd divulgou 82 participações totais em seus últimos arquivamentos da SEC. Os gestores de carteira estão listados como Hamish Douglass. O valor mais recente da carteira é calculado como $ 8,443,490,453 USD. O Ativo Total Sob Gestão (AUM) é esse valor mais o caixa (que não é divulgado). As principais posições de Magellan Asset Management Ltd são Amazon.com, Inc. (US:AMZN) , Microsoft Corporation (US:MSFT) , Eversource Energy (US:ES) , Taiwan Semiconductor Manufacturing Company Limited - Depositary Receipt (Common Stock) (US:TSM) , and Mastercard Incorporated (US:MA) .
Maiores Aumentos Este Trimestre
Usamos a mudança na alocação do portfólio porque esta é a métrica mais significativa. As mudanças podem ser devido a operações ou mudanças nos preços das ações.
| Ativo | Ações (MM) |
Valor (MM$) |
% do Portfólio | Δ% do Portfólio |
|---|---|---|---|---|
| 1.33 | 126.35 | 1.4964 | 1.4964 | |
| 7.41 | 526.92 | 6.2405 | 1.1849 | |
| 1.55 | 104.73 | 1.2404 | 1.1215 | |
| 0.29 | 69.34 | 0.8213 | 0.8213 | |
| 0.11 | 53.23 | 0.6304 | 0.5727 | |
| 0.65 | 174.44 | 2.0660 | 0.5347 | |
| 2.13 | 171.42 | 2.0303 | 0.4710 | |
| 2.24 | 201.40 | 2.3853 | 0.4297 | |
| 0.81 | 280.22 | 3.3188 | 0.3844 | |
| 0.68 | 70.78 | 0.8383 | 0.3564 |
Maiores Diminuições Este Trimestre
Usamos a mudança na alocação do portfólio porque esta é a métrica mais significativa. As mudanças podem ser devido a operações ou mudanças nos preços das ações.
| Ativo | Ações (MM) |
Valor (MM$) |
% do Portfólio | Δ% do Portfólio |
|---|---|---|---|---|
| 0.00 | 0.08 | 0.0009 | -1.7752 | |
| 0.12 | 142.15 | 1.6836 | -1.6542 | |
| 0.46 | 339.67 | 4.0228 | -1.3274 | |
| 4.83 | 189.20 | 2.2408 | -0.9048 | |
| 0.42 | 154.68 | 1.8319 | -0.5683 | |
| 1.23 | 637.40 | 7.5490 | -0.4870 | |
| 0.76 | 259.74 | 3.0762 | -0.4817 | |
| 1.36 | 228.99 | 2.7120 | -0.3341 | |
| 2.83 | 172.90 | 2.0478 | -0.3019 | |
| 0.25 | 75.96 | 0.8996 | -0.2657 |
Arquivamentos 13F e Fundo
Este formulário foi arquivado em 2025-11-10 para o período de relatório 2025-09-30. Clique no ícone de link para ver o histórico completo da transação.
Atualize para desbloquear dados premium e exportar para Excel ![]() .
.
| Ativo | Tipo | Preço Médio por Ação | Ações (MM) |
ΔAções (%) |
Valor ($MM) |
ΔAções (%) |
Portfólio (%) |
ΔPortfólio (%) |
|
|---|---|---|---|---|---|---|---|---|---|
| AMZN / Amazon.com, Inc. | 2.96 | -6.20 | 649.54 | -6.13 | 7.6928 | -0.2163 | |||
| MSFT / Microsoft Corporation | 1.23 | -12.93 | 637.40 | -9.34 | 7.5490 | -0.4870 | |||
| ES / Eversource Energy | 7.41 | 6.54 | 526.92 | 19.13 | 6.2405 | 1.1849 | |||
| TSM / Taiwan Semiconductor Manufacturing Company Limited - Depositary Receipt (Common Stock) | 1.51 | -21.78 | 420.67 | -3.55 | 4.9822 | -0.0033 | |||
| MA / Mastercard Incorporated | 0.65 | -0.69 | 370.98 | 0.52 | 4.3937 | 0.1752 | |||
| META / Meta Platforms, Inc. | 0.46 | -27.07 | 339.67 | -27.43 | 4.0228 | -1.3274 | |||
| YUM / Yum! Brands, Inc. | 2.13 | -7.48 | 324.44 | -5.09 | 3.8424 | -0.0650 | |||
| UNH / UnitedHealth Group Incorporated | 0.81 | -1.38 | 280.22 | 9.16 | 3.3188 | 0.3844 | |||
| V / Visa Inc. | 0.76 | -13.21 | 259.74 | -16.55 | 3.0762 | -0.4817 | |||
| PG / The Procter & Gamble Company | 1.64 | -4.25 | 251.64 | -7.65 | 2.9803 | -0.1345 | |||
| ICE / Intercontinental Exchange, Inc. | 1.36 | -6.43 | 228.99 | -14.07 | 2.7120 | -0.3341 | |||
| GOOGL / Alphabet Inc. | 0.86 | -23.09 | 208.94 | 6.09 | 2.4746 | 0.2235 | |||
| SRE / Sempra | 2.24 | -0.87 | 201.40 | 17.72 | 2.3853 | 0.4297 | |||
| INTU / Intuit Inc. | 0.29 | 8.38 | 194.66 | -6.03 | 2.3055 | -0.0623 | |||
| MSCI / MSCI Inc. | 0.34 | 12.06 | 193.93 | 10.24 | 2.2968 | 0.2861 | |||
| AMT / American Tower Corporation | 1.01 | 20.05 | 193.31 | 4.46 | 2.2895 | 0.1742 | |||
| CMG / Chipotle Mexican Grill, Inc. | 4.83 | -1.49 | 189.20 | -31.25 | 2.2408 | -0.9048 | |||
| EVRG / Evergy, Inc. | 2.44 | 3.38 | 185.82 | 14.01 | 2.2008 | 0.3378 | |||
| CME / CME Group Inc. | 0.65 | 32.83 | 174.44 | 30.21 | 2.0660 | 0.5347 | |||
| D / Dominion Energy, Inc. | 2.83 | -22.28 | 172.90 | -15.89 | 2.0478 | -0.3019 | |||
| XEL / Xcel Energy Inc. | 2.13 | 6.12 | 171.42 | 25.67 | 2.0303 | 0.4710 | |||
| SYK / Stryker Corporation | 0.42 | -21.16 | 154.68 | -26.34 | 1.8319 | -0.5683 | |||
| KO / The Coca-Cola Company | 2.28 | 17.21 | 151.09 | 9.87 | 1.7894 | 0.2175 | |||
| WEC / WEC Energy Group, Inc. | 1.30 | -1.24 | 149.06 | 8.61 | 1.7654 | 0.1966 | |||
| NFLX / Netflix, Inc. | 0.12 | -45.63 | 142.15 | -51.32 | 1.6836 | -1.6542 | |||
| CCI / Crown Castle Inc. | 1.39 | 4.73 | 134.53 | -1.63 | 1.5933 | 0.0301 | |||
| MDT / Medtronic plc | 1.33 | 126.35 | 1.4964 | 1.4964 | |||||
| GOOG / Alphabet Inc. | 0.49 | -20.88 | 120.16 | 8.63 | 1.4231 | 0.1588 | |||
| CSX / CSX Corporation | 3.29 | 3.65 | 116.97 | 12.80 | 1.3853 | 0.2000 | |||
| LNT / Alliant Energy Corporation | 1.55 | 802.78 | 104.73 | 906.38 | 1.2404 | 1.1215 | |||
| NSC / Norfolk Southern Corporation | 0.25 | -36.51 | 75.96 | -25.49 | 0.8996 | -0.2657 | |||
| DG / Dollar General Corporation | 0.68 | 85.82 | 70.78 | 67.90 | 0.8383 | 0.3564 | |||
| UNP / Union Pacific Corporation | 0.29 | 69.34 | 0.8213 | 0.8213 | |||||
| BRK.A / Berkshire Hathaway Inc. | 0.12 | 44.78 | 59.52 | 49.83 | 0.7049 | 0.2509 | |||
| BKNG / Booking Holdings Inc. | 0.01 | 29.70 | 59.51 | 20.97 | 0.7047 | 0.1425 | |||
| ZBH / Zimmer Biomet Holdings, Inc. | 0.60 | 18.62 | 59.11 | 28.11 | 0.7001 | 0.1727 | |||
| USB / U.S. Bancorp | 1.11 | 16.43 | 53.81 | 24.35 | 0.6373 | 0.1427 | |||
| TMO / Thermo Fisher Scientific Inc. | 0.11 | 781.57 | 53.23 | 954.67 | 0.6304 | 0.5727 | |||
| NEE / NextEra Energy, Inc. | 0.53 | 12.77 | 39.73 | 22.63 | 0.4705 | 0.1002 | |||
| AEP / American Electric Power Company, Inc. | 0.34 | 7.04 | 38.44 | 16.06 | 0.4553 | 0.0767 | |||
| SO / The Southern Company | 0.40 | 13.78 | 38.22 | 17.43 | 0.4526 | 0.0806 | |||
| EXC / Exelon Corporation | 0.84 | 10.01 | 37.59 | 14.03 | 0.4452 | 0.0684 | |||
| DUK / Duke Energy Corporation | 0.30 | 7.92 | 37.14 | 13.18 | 0.4399 | 0.0648 | |||
| PEG / Public Service Enterprise Group Incorporated | 0.40 | 12.05 | 33.12 | 11.10 | 0.3923 | 0.0515 | |||
| ETR / Entergy Corporation | 0.35 | 17.25 | 32.93 | 31.46 | 0.3900 | 0.1037 | |||
| ED / Consolidated Edison, Inc. | 0.30 | 7.47 | 29.73 | 7.65 | 0.3521 | 0.0364 | |||
| DTE / DTE Energy Company | 0.17 | 17.94 | 23.65 | 25.92 | 0.2801 | 0.0654 | |||
| AEE / Ameren Corporation | 0.23 | 7.53 | 23.56 | 16.87 | 0.2790 | 0.0486 | |||
| AWK / American Water Works Company, Inc. | 0.17 | 12.85 | 23.41 | 12.92 | 0.2772 | 0.0403 | |||
| ATO / Atmos Energy Corporation | 0.13 | 12.30 | 22.29 | 24.43 | 0.2640 | 0.0592 | |||
| PPL / PPL Corporation | 0.58 | 21.41 | 21.58 | 33.12 | 0.2556 | 0.0703 | |||
| FE / FirstEnergy Corp. | 0.45 | 9.19 | 20.70 | 24.27 | 0.2451 | 0.0547 | |||
| CNP / CenterPoint Energy, Inc. | 0.53 | 19.10 | 20.38 | 25.78 | 0.2413 | 0.0561 | |||
| CMS / CMS Energy Corporation | 0.24 | 19.42 | 17.55 | 26.28 | 0.2078 | 0.0490 | |||
| SBAC / SBA Communications Corporation | 0.09 | 8.23 | 17.04 | -10.89 | 0.2018 | -0.0168 | |||
| NI / NiSource Inc. | 0.37 | 7.49 | 15.98 | 15.37 | 0.1893 | 0.0310 | |||
| WTRG / Essential Utilities, Inc. | 0.21 | 7.36 | 8.54 | 15.33 | 0.1011 | 0.0165 | |||
| PNW / Pinnacle West Capital Corporation | 0.09 | 7.79 | 7.91 | 8.01 | 0.0937 | 0.0100 | |||
| OGE / OGE Energy Corp. | 0.14 | 7.43 | 6.61 | 12.02 | 0.0782 | 0.0108 | |||
| SPGI / S&P Global Inc. | 0.01 | 71.76 | 5.13 | 58.58 | 0.0607 | 0.0238 | |||
| IDA / IDACORP, Inc. | 0.04 | 9.50 | 5.09 | 25.34 | 0.0603 | 0.0139 | |||
| MDLZ / Mondelez International, Inc. | 0.07 | 17.65 | 4.21 | 8.99 | 0.0498 | 0.0057 | |||
| OGS / ONE Gas, Inc. | 0.04 | 8.93 | 3.58 | 22.68 | 0.0424 | 0.0090 | |||
| SR / Spire Inc. | 0.04 | 5.82 | 3.51 | 18.19 | 0.0416 | 0.0076 | |||
| TXNM / TXNM Energy, Inc. | 0.06 | 6.08 | 3.44 | 6.50 | 0.0408 | 0.0038 | |||
| POR / Portland General Electric Company | 0.08 | 5.03 | 3.43 | 13.75 | 0.0406 | 0.0061 | |||
| BKH / Black Hills Corporation | 0.05 | 5.61 | 2.96 | 15.93 | 0.0351 | 0.0059 | |||
| ALE / ALLETE, Inc. | 0.04 | 6.99 | 2.94 | 10.89 | 0.0349 | 0.0045 | |||
| NWE / NorthWestern Energy Group, Inc. | 0.05 | 4.78 | 2.94 | 19.72 | 0.0348 | 0.0067 | |||
| CWT / California Water Service Group | 0.05 | 5.79 | 2.11 | 6.72 | 0.0250 | 0.0024 | |||
| AWR / American States Water Company | 0.03 | 8.36 | 2.11 | 3.63 | 0.0250 | 0.0017 | |||
| MGEE / MGE Energy, Inc. | 0.02 | 8.47 | 1.97 | 3.24 | 0.0234 | 0.0015 | |||
| AVA / Avista Corporation | 0.05 | 2.89 | 1.96 | 2.51 | 0.0233 | 0.0014 | |||
| CPK / Chesapeake Utilities Corporation | 0.01 | 2.22 | 1.65 | 14.48 | 0.0196 | 0.0031 | |||
| HTO / H2O America | 0.02 | 3.99 | 1.05 | -2.51 | 0.0124 | 0.0001 | |||
| NWN / Northwest Natural Holding Company | 0.02 | 2.60 | 1.00 | 16.16 | 0.0118 | 0.0020 | |||
| MSEX / Middlesex Water Company | 0.01 | 2.99 | 0.67 | 2.76 | 0.0080 | 0.0005 | |||
| CRM / Salesforce, Inc. | 0.00 | -99.43 | 0.11 | -99.51 | 0.0013 | -0.2440 | |||
| HCA / HCA Healthcare, Inc. | 0.00 | -99.96 | 0.08 | -99.95 | 0.0009 | -1.7752 | |||
| BLK / BlackRock, Inc. | 0.00 | -9.72 | 0.08 | 0.00 | 0.0009 | 0.0000 | |||
| HD / The Home Depot, Inc. | 0.00 | 0.07 | 0.0009 | 0.0009 | |||||
| PEP / PepsiCo, Inc. | 0.00 | -36.91 | 0.07 | -33.01 | 0.0008 | -0.0004 | |||
| MELI / MercadoLibre, Inc. | 0.00 | -100.00 | 0.00 | 0.0000 | |||||
| NVO / Novo Nordisk A/S - Depositary Receipt (Common Stock) | 0.00 | -100.00 | 0.00 | 0.0000 | |||||
| YUMC / Yum China Holdings, Inc. | 0.00 | -100.00 | 0.00 | 0.0000 | |||||
| MS / Morgan Stanley | 0.00 | -100.00 | 0.00 | 0.0000 | |||||
| ULTA / Ulta Beauty, Inc. | 0.00 | -100.00 | 0.00 | 0.0000 |