Estatísticas Básicas
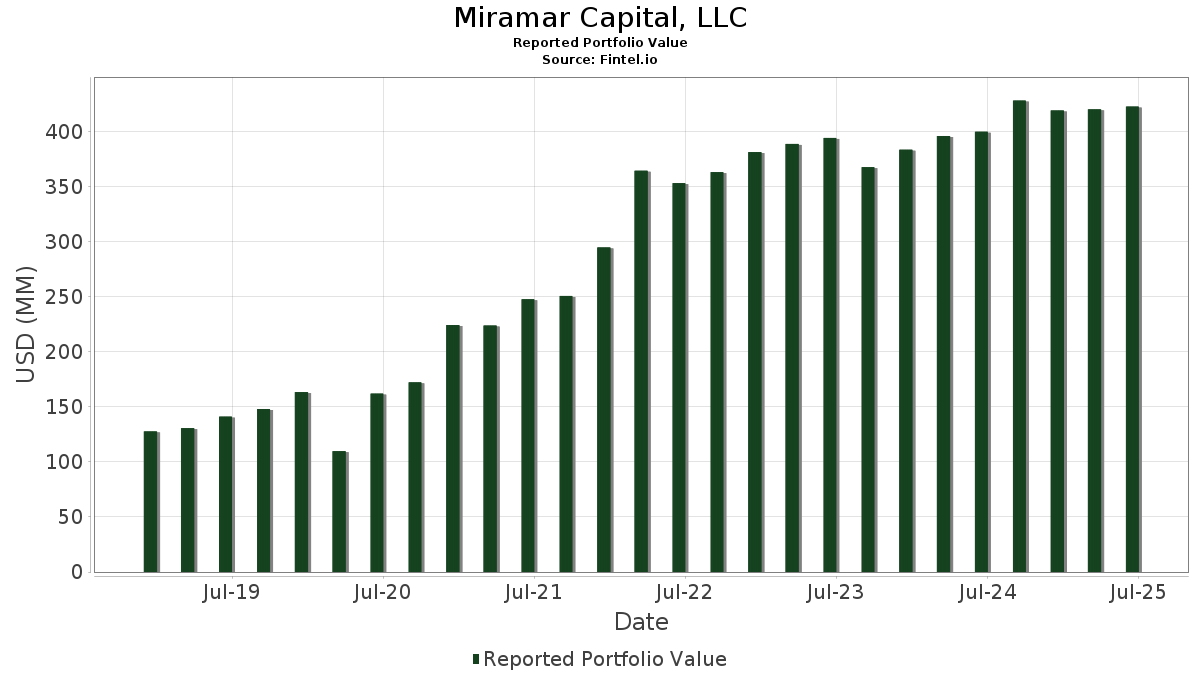
| Valor do Portfólio | $ 450,812,874 |
| Posições Atuais | 58 |
Últimas Participações, Desempenho, AUM (de 13F, 13D)
Miramar Capital, LLC divulgou 58 participações totais em seus últimos arquivamentos da SEC. O valor mais recente da carteira é calculado como $ 450,812,874 USD. O Ativo Total Sob Gestão (AUM) é esse valor mais o caixa (que não é divulgado). As principais posições de Miramar Capital, LLC são Microsoft Corporation (US:MSFT) , Broadcom Inc. (US:AVGO) , AbbVie Inc. (US:ABBV) , Alphabet Inc. (US:GOOGL) , and Verizon Communications Inc. (US:VZ) . As novas posições de Miramar Capital, LLC incluem Ford Motor Company (US:F) , Chesapeake Utilities Corporation (US:CPK) , .
Maiores Aumentos Este Trimestre
Usamos a mudança na alocação do portfólio porque esta é a métrica mais significativa. As mudanças podem ser devido a operações ou mudanças nos preços das ações.
| Ativo | Ações (MM) |
Valor (MM$) |
% do Portfólio | Δ% do Portfólio |
|---|---|---|---|---|
| 0.09 | 21.48 | 4.7650 | 1.1131 | |
| 0.11 | 24.64 | 5.4661 | 0.7347 | |
| 0.05 | 13.94 | 3.0932 | 0.4416 | |
| 0.11 | 8.91 | 1.9772 | 0.3574 | |
| 0.08 | 26.58 | 5.8953 | 0.3497 | |
| 0.06 | 14.67 | 3.2536 | 0.3016 | |
| 0.04 | 12.78 | 2.8352 | 0.2241 | |
| 0.04 | 17.31 | 3.8401 | 0.1818 | |
| 0.06 | 12.11 | 2.6860 | 0.1614 | |
| 0.08 | 11.15 | 2.4732 | 0.1549 |
Maiores Diminuições Este Trimestre
Usamos a mudança na alocação do portfólio porque esta é a métrica mais significativa. As mudanças podem ser devido a operações ou mudanças nos preços das ações.
| Ativo | Ações (MM) |
Valor (MM$) |
% do Portfólio | Δ% do Portfólio |
|---|---|---|---|---|
| 0.00 | 0.40 | 0.0887 | -1.2740 | |
| 0.00 | 0.00 | -1.0896 | ||
| 0.21 | 15.54 | 3.4476 | -0.5959 | |
| 0.04 | 14.22 | 3.1552 | -0.3441 | |
| 0.06 | 15.54 | 3.4470 | -0.3118 | |
| 0.22 | 9.84 | 2.1832 | -0.2191 | |
| 0.15 | 2.66 | 0.5904 | -0.1829 | |
| 0.05 | 27.47 | 6.0937 | -0.1816 | |
| 0.45 | 19.90 | 4.4150 | -0.1069 | |
| 0.08 | 9.80 | 2.1746 | -0.0867 |
Arquivamentos 13F e Fundo
Este formulário foi arquivado em 2025-11-12 para o período de relatório 2025-09-30. Clique no ícone de link para ver o histórico completo da transação.
Atualize para desbloquear dados premium e exportar para Excel ![]() .
.
| Ativo | Tipo | Preço Médio por Ação | Ações (MM) |
ΔAções (%) |
Valor ($MM) |
ΔAções (%) |
Portfólio (%) |
ΔPortfólio (%) |
|
|---|---|---|---|---|---|---|---|---|---|
| MSFT / Microsoft Corporation | 0.05 | -0.57 | 27.47 | 3.54 | 6.0937 | -0.1816 | |||
| AVGO / Broadcom Inc. | 0.08 | -5.30 | 26.58 | 13.34 | 5.8953 | 0.3497 | |||
| ABBV / AbbVie Inc. | 0.11 | -1.25 | 24.64 | 23.17 | 5.4661 | 0.7347 | |||
| GOOGL / Alphabet Inc. | 0.09 | 0.85 | 21.48 | 39.13 | 4.7650 | 1.1131 | |||
| VZ / Verizon Communications Inc. | 0.45 | 2.49 | 19.90 | 4.10 | 4.4150 | -0.1069 | |||
| CVX / Chevron Corporation | 0.11 | -0.50 | 17.36 | 7.91 | 3.8500 | 0.0460 | |||
| PEP / PepsiCo, Inc. | 0.12 | 3.45 | 17.34 | 10.03 | 3.8458 | 0.1192 | |||
| 0R1G / The Home Depot, Inc. | 0.04 | 1.27 | 17.31 | 11.92 | 3.8401 | 0.1818 | |||
| JPM / JPMorgan Chase & Co. | 0.05 | 1.77 | 16.46 | 10.73 | 3.6507 | 0.1355 | |||
| MCD / McDonald's Corporation | 0.05 | 1.01 | 16.11 | 5.06 | 3.5737 | -0.0529 | |||
| OKE / ONEOK, Inc. | 0.21 | 1.70 | 15.54 | -9.09 | 3.4476 | -0.5959 | |||
| CME / CME Group Inc. | 0.06 | -0.26 | 15.54 | -2.22 | 3.4470 | -0.3118 | |||
| UNP / Union Pacific Corporation | 0.06 | 14.39 | 14.67 | 17.51 | 3.2536 | 0.3016 | |||
| V / Visa Inc. | 0.04 | -0.01 | 14.22 | -3.87 | 3.1552 | -0.3441 | |||
| MDT / Medtronic plc | 0.15 | 0.44 | 14.06 | 9.75 | 3.1193 | 0.0887 | |||
| AAPL / Apple Inc. | 0.05 | 0.22 | 13.94 | 24.38 | 3.0932 | 0.4416 | |||
| LMT / Lockheed Martin Corporation | 0.03 | 0.53 | 13.79 | 8.36 | 3.0595 | 0.0491 | |||
| WM / Waste Management, Inc. | 0.06 | 16.39 | 12.82 | 12.33 | 2.8438 | 0.1443 | |||
| GD / General Dynamics Corporation | 0.04 | -0.98 | 12.78 | 15.78 | 2.8352 | 0.2241 | |||
| QCOM / QUALCOMM Incorporated | 0.08 | 6.33 | 12.72 | 11.07 | 2.8217 | 0.1130 | |||
| HSY / The Hershey Company | 0.06 | 0.64 | 12.11 | 13.43 | 2.6860 | 0.1614 | |||
| BLK / BlackRock, Inc. | 0.01 | 0.50 | 12.06 | 11.66 | 2.6761 | 0.1209 | |||
| GPC / Genuine Parts Company | 0.08 | -0.45 | 11.15 | 13.74 | 2.4732 | 0.1549 | |||
| ABT / Abbott Laboratories | 0.08 | 5.60 | 10.84 | 3.99 | 2.4056 | -0.0608 | |||
| BMY / Bristol-Myers Squibb Company | 0.22 | -0.55 | 9.84 | -3.11 | 2.1832 | -0.2191 | |||
| PAYX / Paychex, Inc. | 0.08 | 17.66 | 9.80 | 2.53 | 2.1746 | -0.0867 | |||
| EOG / EOG Resources, Inc. | 0.08 | 13.98 | 9.33 | 6.83 | 2.0707 | 0.0043 | |||
| MRKCL / Merck & Co., Inc. | 0.11 | 22.75 | 8.91 | 30.15 | 1.9772 | 0.3574 | |||
| VIG / Vanguard Specialized Funds - Vanguard Dividend Appreciation ETF | 0.01 | 5.60 | 2.94 | 11.33 | 0.6521 | 0.0276 | |||
| ACI / Albertsons Companies, Inc. | 0.15 | 0.00 | 2.66 | -18.60 | 0.5904 | -0.1829 | |||
| SCHD / Schwab Strategic Trust - Schwab U.S. Dividend Equity ETF | 0.08 | 0.00 | 2.12 | 3.02 | 0.4700 | -0.0164 | |||
| SPY / SPDR S&P 500 ETF | 0.00 | -3.02 | 1.63 | 4.57 | 0.3609 | -0.0071 | |||
| VAIGX / Vanguard Advice Select International Growth Fund | 0.01 | 2.64 | 1.26 | 8.56 | 0.2784 | 0.0049 | |||
| GLD / SPDR Gold Shares | 0.00 | 0.00 | 0.94 | 16.67 | 0.2082 | 0.0178 | |||
| VTI / Vanguard Index Funds - Vanguard Total Stock Market ETF | 0.00 | -20.63 | 0.88 | -14.33 | 0.1952 | -0.0477 | |||
| KVYO / Klaviyo, Inc. | 0.03 | 0.00 | 0.79 | -17.52 | 0.1755 | -0.0514 | |||
| MDY / SPDR S&P MidCap 400 ETF Trust | 0.00 | 0.32 | 0.75 | 5.67 | 0.1655 | -0.0017 | |||
| BRK.A / Berkshire Hathaway Inc. | 0.00 | -3.46 | 0.71 | -0.14 | 0.1585 | -0.0106 | |||
| CW / Curtiss-Wright Corporation | 0.00 | -4.65 | 0.67 | 5.87 | 0.1481 | -0.0009 | |||
| FAST / Fastenal Company | 0.01 | 0.00 | 0.65 | 16.85 | 0.1447 | 0.0126 | |||
| ED / Consolidated Edison, Inc. | 0.01 | 0.00 | 0.56 | 0.18 | 0.1249 | -0.0080 | |||
| COST / Costco Wholesale Corporation | 0.00 | 0.00 | 0.50 | -6.55 | 0.1109 | -0.0156 | |||
| QQQ / Invesco QQQ Trust, Series 1 | 0.00 | -5.03 | 0.50 | 3.32 | 0.1107 | -0.0035 | |||
| XPRO / Expro Group Holdings N.V. | 0.00 | 0.00 | 0.43 | -25.18 | 0.0944 | -0.0402 | |||
| UPS / United Parcel Service, Inc. | 0.00 | -91.61 | 0.40 | -93.06 | 0.0887 | -1.2740 | |||
| EMR / Emerson Electric Co. | 0.00 | -20.63 | 0.37 | -22.01 | 0.0812 | -0.0297 | |||
| PNC / The PNC Financial Services Group, Inc. | 0.00 | 0.00 | 0.34 | 7.84 | 0.0763 | 0.0008 | |||
| KMB / Kimberly-Clark Corporation | 0.00 | -10.14 | 0.32 | -13.35 | 0.0706 | -0.0163 | |||
| PG / The Procter & Gamble Company | 0.00 | -5.74 | 0.32 | -8.96 | 0.0699 | -0.0121 | |||
| VO / Vanguard Index Funds - Vanguard Mid-Cap ETF | 0.00 | -25.84 | 0.31 | -22.06 | 0.0690 | -0.0255 | |||
| JNJ / Johnson & Johnson | 0.00 | -0.48 | 0.31 | 20.62 | 0.0689 | 0.0081 | |||
| BAC / Bank of America Corporation | 0.01 | -7.58 | 0.30 | 0.66 | 0.0676 | -0.0039 | |||
| F / Ford Motor Company | 0.02 | 0.24 | 0.0536 | 0.0536 | |||||
| AMZN / Amazon.com, Inc. | 0.00 | -0.93 | 0.23 | -0.85 | 0.0516 | -0.0039 | |||
| LLY / Eli Lilly and Company | 0.00 | 0.00 | 0.23 | -2.15 | 0.0508 | -0.0045 | |||
| MET / MetLife, Inc. | 0.00 | 0.00 | 0.23 | 2.70 | 0.0506 | -0.0021 | |||
| XOM / Exxon Mobil Corporation | 0.00 | -7.84 | 0.23 | -3.43 | 0.0500 | -0.0053 | |||
| CPK / Chesapeake Utilities Corporation | 0.00 | 0.20 | 0.0448 | 0.0448 | |||||
| UNH / UnitedHealth Group Incorporated | 0.00 | -100.00 | 0.00 | -100.00 | -1.0896 | ||||
| VXUS / Vanguard STAR Funds - Vanguard Total International Stock ETF | 0.00 | -100.00 | 0.00 | -100.00 | -0.0492 | ||||
| UMBF / UMB Financial Corporation | 0.00 | -100.00 | 0.00 | 0.0000 | |||||
| META / Meta Platforms, Inc. | 0.00 | -100.00 | 0.00 | -100.00 | -0.0620 |