Estatísticas Básicas
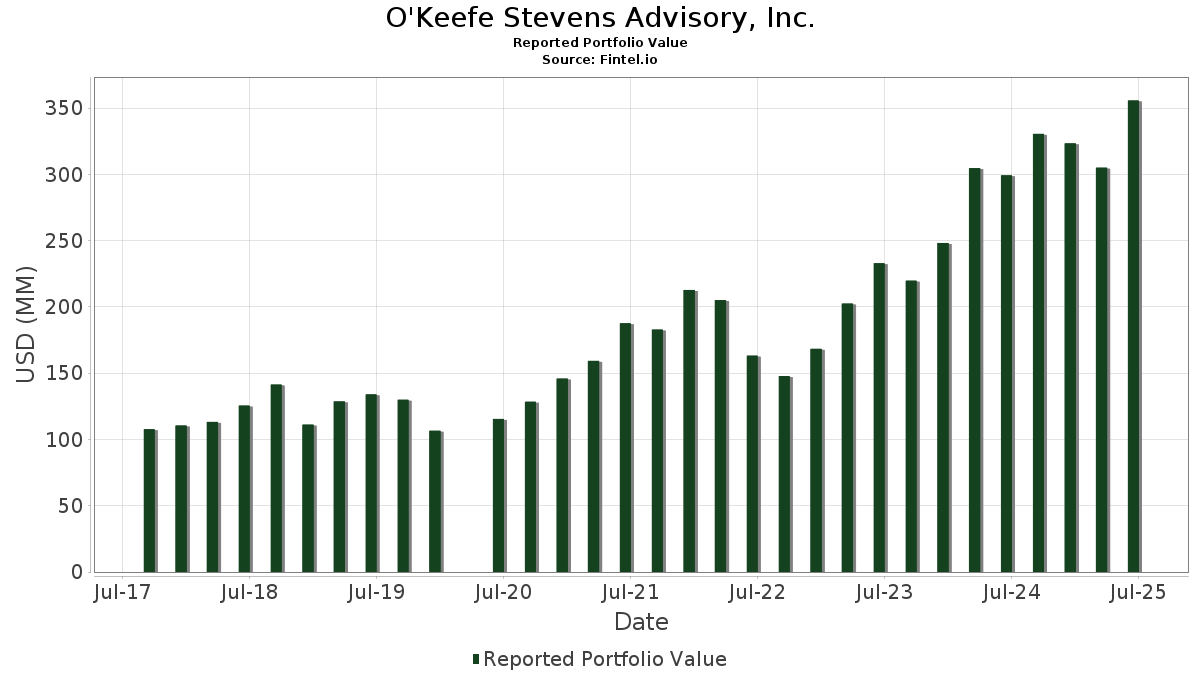
| Valor do Portfólio | $ 369,313,440 |
| Posições Atuais | 67 |
Últimas Participações, Desempenho, AUM (de 13F, 13D)
O'Keefe Stevens Advisory, Inc. divulgou 67 participações totais em seus últimos arquivamentos da SEC. O valor mais recente da carteira é calculado como $ 369,313,440 USD. O Ativo Total Sob Gestão (AUM) é esse valor mais o caixa (que não é divulgado). As principais posições de O'Keefe Stevens Advisory, Inc. são NVIDIA Corporation (US:NVDA) , Corning Incorporated (US:GLW) , QUALCOMM Incorporated (US:QCOM) , Warrior Met Coal, Inc. (US:HCC) , and AerCap Holdings N.V. (US:AER) .
Maiores Aumentos Este Trimestre
Usamos a mudança na alocação do portfólio porque esta é a métrica mais significativa. As mudanças podem ser devido a operações ou mudanças nos preços das ações.
| Ativo | Ações (MM) |
Valor (MM$) |
% do Portfólio | Δ% do Portfólio |
|---|---|---|---|---|
| 0.32 | 25.85 | 6.9989 | 2.3098 | |
| 0.43 | 14.73 | 3.9892 | 1.5337 | |
| 0.08 | 15.05 | 4.0759 | 1.4351 | |
| 0.29 | 18.53 | 5.0175 | 1.3125 | |
| 0.21 | 12.84 | 3.4767 | 1.0300 | |
| 0.14 | 16.84 | 4.5600 | 0.8989 | |
| 0.35 | 3.30 | 0.8926 | 0.8627 | |
| 2.32 | 14.25 | 3.8576 | 0.3280 | |
| 0.17 | 16.77 | 4.5409 | 0.2578 | |
| 0.02 | 3.36 | 0.9096 | 0.0997 |
Maiores Diminuições Este Trimestre
Usamos a mudança na alocação do portfólio porque esta é a métrica mais significativa. As mudanças podem ser devido a operações ou mudanças nos preços das ações.
| Ativo | Ações (MM) |
Valor (MM$) |
% do Portfólio | Δ% do Portfólio |
|---|---|---|---|---|
| 0.00 | 0.20 | 0.0553 | -4.0071 | |
| 0.39 | 71.94 | 19.4789 | -2.0136 | |
| 1.75 | 16.53 | 4.4752 | -0.4862 | |
| 0.22 | 5.00 | 1.3532 | -0.3136 | |
| 0.52 | 3.49 | 0.9447 | -0.2027 | |
| 0.37 | 9.12 | 2.4690 | -0.1403 | |
| 0.08 | 3.70 | 1.0012 | -0.1235 | |
| 0.57 | 10.94 | 2.9635 | -0.1197 | |
| 0.05 | 14.24 | 3.8569 | -0.0667 | |
| 0.01 | 1.11 | 0.2994 | -0.0573 |
Arquivamentos 13F e Fundo
Este formulário foi arquivado em 2025-10-14 para o período de relatório 2025-09-30. Clique no ícone de link para ver o histórico completo da transação.
Atualize para desbloquear dados premium e exportar para Excel ![]() .
.
| Ativo | Tipo | Preço Médio por Ação | Ações (MM) |
ΔAções (%) |
Valor ($MM) |
ΔAções (%) |
Portfólio (%) |
ΔPortfólio (%) |
|
|---|---|---|---|---|---|---|---|---|---|
| NVDA / NVIDIA Corporation | 0.39 | -20.31 | 71.94 | -5.89 | 19.4789 | -2.0136 | |||
| GLW / Corning Incorporated | 0.32 | -0.64 | 25.85 | 54.99 | 6.9989 | 2.3098 | |||
| QCOM / QUALCOMM Incorporated | 0.14 | 0.82 | 23.86 | 5.31 | 6.4614 | 0.0907 | |||
| HCC / Warrior Met Coal, Inc. | 0.29 | 1.27 | 18.53 | 40.62 | 5.0175 | 1.3125 | |||
| AER / AerCap Holdings N.V. | 0.14 | 25.06 | 16.84 | 29.33 | 4.5600 | 0.8989 | |||
| L / Loews Corporation | 0.17 | 0.51 | 16.77 | 10.09 | 4.5409 | 0.2578 | |||
| BGC / BGC Group, Inc. | 1.75 | 1.28 | 16.53 | -6.34 | 4.4752 | -0.4862 | |||
| BABA / Alibaba Group Holding Limited - Depositary Receipt (Common Stock) | 0.08 | 1.69 | 15.05 | 60.26 | 4.0759 | 1.4351 | |||
| TPH / Tri Pointe Homes, Inc. | 0.43 | 58.66 | 14.73 | 68.69 | 3.9892 | 1.5337 | |||
| FPH / Five Point Holdings, LLC | 2.32 | 1.82 | 14.25 | 13.49 | 3.8576 | 0.3280 | |||
| AMGN / Amgen Inc. | 0.05 | 0.99 | 14.24 | 2.07 | 3.8569 | -0.0667 | |||
| BRK.B / Berkshire Hathaway Inc. | 0.03 | 1.75 | 14.11 | 5.31 | 3.8215 | 0.0534 | |||
| SPHR / Sphere Entertainment Co. | 0.21 | -0.71 | 12.84 | 47.54 | 3.4767 | 1.0300 | |||
| CMP / Compass Minerals International, Inc. | 0.57 | 4.43 | 10.94 | -0.19 | 2.9635 | -0.1197 | |||
| MTB / M&T Bank Corporation | 0.05 | 0.96 | 9.17 | 2.85 | 2.4837 | -0.0238 | |||
| WY / Weyerhaeuser Company | 0.37 | 1.82 | 9.12 | -1.75 | 2.4690 | -0.1403 | |||
| UNP / Union Pacific Corporation | 0.03 | 3.39 | 6.39 | 6.20 | 1.7291 | 0.0386 | |||
| PRGO / Perrigo Company plc | 0.22 | 1.15 | 5.00 | -15.71 | 1.3532 | -0.3136 | |||
| SCL / Stepan Company | 0.08 | 5.77 | 3.70 | -7.57 | 1.0012 | -0.1235 | |||
| ARCO / Arcos Dorados Holdings Inc. | 0.52 | -0.07 | 3.49 | -14.51 | 0.9447 | -0.2027 | |||
| PSX / Phillips 66 | 0.02 | 2.29 | 3.36 | 16.63 | 0.9096 | 0.0997 | |||
| XOM / Exxon Mobil Corporation | 0.03 | 1.12 | 3.34 | 5.73 | 0.9044 | 0.0164 | |||
| MODG / Topgolf Callaway Brands Corp. | 0.35 | 2,528.45 | 3.30 | 3,009.43 | 0.8926 | 0.8627 | |||
| JPM / JPMorgan Chase & Co. | 0.01 | 0.31 | 3.09 | 9.12 | 0.8358 | 0.0406 | |||
| PFE / Pfizer Inc. | 0.09 | -8.89 | 2.37 | -4.24 | 0.6431 | -0.0542 | |||
| TKO / TKO Group Holdings, Inc. | 0.01 | 2.71 | 1.72 | 14.02 | 0.4669 | 0.0416 | |||
| HII / Huntington Ingalls Industries, Inc. | 0.01 | 0.70 | 1.66 | 20.07 | 0.4489 | 0.0607 | |||
| EBGEF / Enbridge Inc. - Preferred Stock | 0.03 | 1.73 | 1.58 | 13.31 | 0.4287 | 0.0357 | |||
| BLK / BlackRock, Inc. | 0.00 | 1.29 | 1.47 | 12.58 | 0.3976 | 0.0308 | |||
| SWX / Southwest Gas Holdings, Inc. | 0.02 | 2.03 | 1.46 | 7.49 | 0.3962 | 0.0133 | |||
| AAPL / Apple Inc. | 0.01 | -3.00 | 1.28 | 20.38 | 0.3473 | 0.0477 | |||
| WMB / The Williams Companies, Inc. | 0.02 | 1.61 | 1.24 | 2.49 | 0.3348 | -0.0044 | |||
| DUK / Duke Energy Corporation | 0.01 | 2.37 | 1.23 | 7.36 | 0.3317 | 0.0109 | |||
| GPC / Genuine Parts Company | 0.01 | 2.58 | 1.13 | 17.20 | 0.3063 | 0.0349 | |||
| APD / Air Products and Chemicals, Inc. | 0.00 | 2.81 | 1.13 | -0.62 | 0.3055 | -0.0136 | |||
| PAYX / Paychex, Inc. | 0.01 | 0.00 | 1.11 | -12.85 | 0.2994 | -0.0573 | |||
| MDT / Medtronic plc | 0.01 | 2.23 | 1.08 | 11.66 | 0.2931 | 0.0206 | |||
| KO / The Coca-Cola Company | 0.02 | 3.02 | 1.05 | -3.41 | 0.2840 | -0.0214 | |||
| SBUX / Starbucks Corporation | 0.01 | 3.80 | 1.00 | -4.11 | 0.2719 | -0.0227 | |||
| LMT / Lockheed Martin Corporation | 0.00 | 1.96 | 0.96 | 9.83 | 0.2604 | 0.0142 | |||
| OMC / Omnicom Group Inc. | 0.01 | 4.38 | 0.91 | 18.34 | 0.2464 | 0.0301 | |||
| UPS / United Parcel Service, Inc. | 0.01 | 7.01 | 0.84 | -11.44 | 0.2266 | -0.0391 | |||
| APA / APA Corporation | 0.03 | 0.02 | 0.72 | 32.78 | 0.1942 | 0.0423 | |||
| MSFT / Microsoft Corporation | 0.00 | 0.00 | 0.71 | 4.26 | 0.1923 | 0.0005 | |||
| JNJ / Johnson & Johnson | 0.00 | 0.00 | 0.66 | 21.39 | 0.1799 | 0.0260 | |||
| AMAT / Applied Materials, Inc. | 0.00 | 0.00 | 0.66 | 11.82 | 0.1793 | 0.0128 | |||
| ROKU / Roku, Inc. | 0.01 | 1.85 | 0.62 | 16.20 | 0.1690 | 0.0178 | |||
| ROK / Rockwell Automation, Inc. | 0.00 | 0.00 | 0.56 | 5.27 | 0.1514 | 0.0020 | |||
| CLMT / Calumet, Inc. | 0.03 | 2.23 | 0.50 | 18.48 | 0.1355 | 0.0167 | |||
| GJR / Strats Trust For Procter & Gambel Security - Preferred Security | 0.00 | 0.00 | 0.43 | -3.62 | 0.1156 | -0.0089 | |||
| MCD / McDonald's Corporation | 0.00 | -2.18 | 0.40 | 1.80 | 0.1070 | -0.0022 | |||
| GOOGL / Alphabet Inc. | 0.00 | 0.00 | 0.37 | 37.27 | 0.1010 | 0.0246 | |||
| DGX / Quest Diagnostics Incorporated | 0.00 | -25.00 | 0.36 | -20.49 | 0.0968 | -0.0295 | |||
| BK / The Bank of New York Mellon Corporation | 0.00 | 0.00 | 0.34 | 19.51 | 0.0931 | 0.0123 | |||
| DIS / The Walt Disney Company | 0.00 | 0.00 | 0.30 | -7.62 | 0.0821 | -0.0102 | |||
| ORCL / Oracle Corporation | 0.00 | -50.30 | 0.30 | -36.23 | 0.0817 | -0.0510 | |||
| SEG / Seaport Entertainment Group Inc. | 0.01 | 5.96 | 0.30 | 30.57 | 0.0810 | 0.0164 | |||
| PM / Philip Morris International Inc. | 0.00 | 0.00 | 0.29 | -10.80 | 0.0783 | -0.0130 | |||
| BNL / Broadstone Net Lease, Inc. | 0.02 | 0.00 | 0.29 | 11.63 | 0.0780 | 0.0053 | |||
| GE / General Electric Company | 0.00 | 0.00 | 0.28 | 16.87 | 0.0771 | 0.0086 | |||
| SCHW / The Charles Schwab Corporation | 0.00 | 0.00 | 0.25 | 4.53 | 0.0689 | 0.0005 | |||
| ITW / Illinois Tool Works Inc. | 0.00 | 0.00 | 0.25 | 5.60 | 0.0664 | 0.0010 | |||
| ABT / Abbott Laboratories | 0.00 | 0.00 | 0.22 | -1.37 | 0.0586 | -0.0032 | |||
| MRK / Merck & Co., Inc. | 0.00 | 0.00 | 0.21 | 5.97 | 0.0578 | 0.0012 | |||
| META / Meta Platforms, Inc. | 0.00 | -1.69 | 0.21 | -2.30 | 0.0577 | -0.0036 | |||
| CVX / Chevron Corporation | 0.00 | 0.21 | 0.0562 | 0.0562 | |||||
| DFIN / Donnelley Financial Solutions, Inc. | 0.00 | -98.31 | 0.20 | -98.59 | 0.0553 | -4.0071 | |||
| FC / Franklin Covey Co. | 0.00 | -100.00 | 0.00 | 0.0000 | |||||
| LAZ / Lazard, Inc. | 0.00 | -100.00 | 0.00 | 0.0000 |