Estatísticas Básicas
| Valor do Portfólio | $ 275,208,739 |
| Posições Atuais | 65 |
Últimas Participações, Desempenho, AUM (de 13F, 13D)
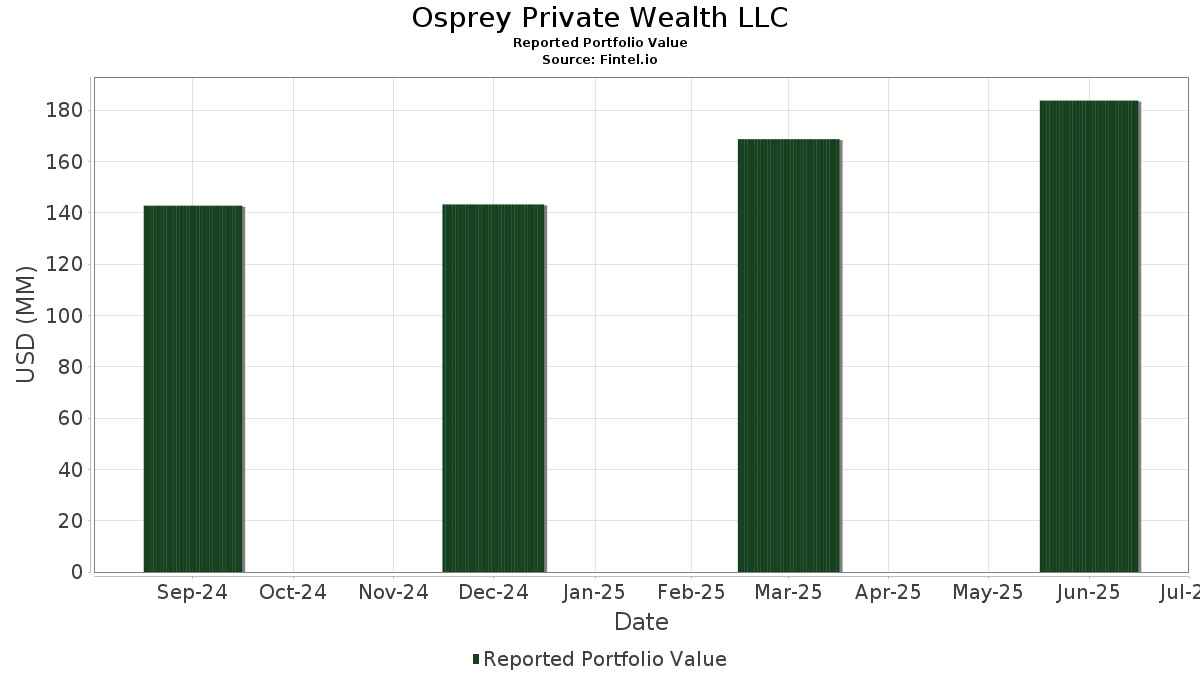
Osprey Private Wealth LLC divulgou 65 participações totais em seus últimos arquivamentos da SEC. O valor mais recente da carteira é calculado como $ 275,208,739 USD. O Ativo Total Sob Gestão (AUM) é esse valor mais o caixa (que não é divulgado). As principais posições de Osprey Private Wealth LLC são NVIDIA Corporation (US:NVDA) , Alphabet Inc. (US:GOOGL) , JPMorgan Chase & Co. (US:JPM) , Meta Platforms, Inc. (US:META) , and Visa Inc. (US:V) . As novas posições de Osprey Private Wealth LLC incluem Amazon.com, Inc. (US:AMZN) , The Procter & Gamble Company (US:PG) , Abbott Laboratories (US:ABT) , iShares Trust - iShares Core S&P 500 ETF (US:IVV) , and Starbucks Corporation (US:SBUX) .
Maiores Aumentos Este Trimestre
Usamos a mudança na alocação do portfólio porque esta é a métrica mais significativa. As mudanças podem ser devido a operações ou mudanças nos preços das ações.
| Ativo | Ações (MM) |
Valor (MM$) |
% do Portfólio | Δ% do Portfólio |
|---|---|---|---|---|
| 0.08 | 19.02 | 6.9129 | 1.2099 | |
| 0.05 | 7.41 | 2.6909 | 0.6880 | |
| 0.02 | 4.70 | 1.7080 | 0.6180 | |
| 0.01 | 3.42 | 1.2415 | 0.4440 | |
| 0.00 | 1.02 | 0.3714 | 0.3714 | |
| 0.01 | 0.97 | 0.3542 | 0.3542 | |
| 0.11 | 21.11 | 7.6711 | 0.3276 | |
| 0.04 | 6.81 | 2.4728 | 0.3242 | |
| 0.01 | 0.87 | 0.3171 | 0.3171 | |
| 0.00 | 6.69 | 2.4303 | 0.3003 |
Maiores Diminuições Este Trimestre
Usamos a mudança na alocação do portfólio porque esta é a métrica mais significativa. As mudanças podem ser devido a operações ou mudanças nos preços das ações.
| Ativo | Ações (MM) |
Valor (MM$) |
% do Portfólio | Δ% do Portfólio |
|---|---|---|---|---|
| 0.02 | 14.74 | 5.3564 | -1.0076 | |
| 0.04 | 12.47 | 4.5319 | -0.8055 | |
| 0.31 | 10.20 | 3.7051 | -0.6546 | |
| 0.02 | 5.10 | 1.8543 | -0.6504 | |
| 0.05 | 5.28 | 1.9203 | -0.4796 | |
| 0.02 | 6.06 | 2.2034 | -0.4569 | |
| 0.02 | 2.92 | 1.0625 | -0.4263 | |
| 0.05 | 8.21 | 2.9842 | -0.3840 | |
| 0.02 | 8.14 | 2.9584 | -0.3421 | |
| 0.06 | 4.24 | 1.5410 | -0.2825 |
Arquivamentos 13F e Fundo
Este formulário foi arquivado em 2025-10-08 para o período de relatório 2025-09-30. Clique no ícone de link para ver o histórico completo da transação.
Atualize para desbloquear dados premium e exportar para Excel ![]() .
.
| Ativo | Tipo | Preço Médio por Ação | Ações (MM) |
ΔAções (%) |
Valor ($MM) |
ΔAções (%) |
Portfólio (%) |
ΔPortfólio (%) |
|
|---|---|---|---|---|---|---|---|---|---|
| NVDA / NVIDIA Corporation | 0.11 | 33.66 | 21.11 | 56.52 | 7.6711 | 0.3276 | |||
| GOOGL / Alphabet Inc. | 0.08 | 34.63 | 19.02 | 81.61 | 6.9129 | 1.2099 | |||
| JPM / JPMorgan Chase & Co. | 0.05 | 38.44 | 15.43 | 47.53 | 5.6058 | -0.0875 | |||
| META / Meta Platforms, Inc. | 0.02 | 23.47 | 14.74 | 26.11 | 5.3564 | -1.0076 | |||
| V / Visa Inc. | 0.04 | 33.73 | 12.47 | 27.21 | 4.5319 | -0.8055 | |||
| ABBV / AbbVie Inc. | 0.05 | 28.64 | 11.65 | 57.36 | 4.2327 | 0.2026 | |||
| MSFT / Microsoft Corporation | 0.02 | 40.32 | 11.11 | 45.69 | 4.0379 | -0.1145 | |||
| TTEK / Tetra Tech, Inc. | 0.31 | 39.61 | 10.20 | 27.32 | 3.7051 | -0.6546 | |||
| HD / The Home Depot, Inc. | 0.02 | 37.77 | 9.84 | 50.20 | 3.5770 | 0.0086 | |||
| BLK / BlackRock, Inc. | 0.01 | 30.83 | 9.24 | 40.96 | 3.3585 | -0.2116 | |||
| ARES / Ares Management Corporation | 0.05 | 47.75 | 8.21 | 32.75 | 2.9842 | -0.3840 | |||
| BRK.A / Berkshire Hathaway Inc. | 0.02 | 29.56 | 8.14 | 34.30 | 2.9584 | -0.3421 | |||
| TMO / Thermo Fisher Scientific Inc. | 0.02 | 35.21 | 7.93 | 52.75 | 2.8832 | 0.0551 | |||
| TJX / The TJX Companies, Inc. | 0.05 | 75.28 | 7.41 | 101.33 | 2.6909 | 0.6880 | |||
| JNJ / Johnson & Johnson | 0.04 | 45.08 | 6.81 | 72.45 | 2.4728 | 0.3242 | |||
| ECL / Ecolab Inc. | 0.02 | 52.85 | 6.71 | 52.72 | 2.4390 | 0.0463 | |||
| AZO / AutoZone, Inc. | 0.00 | 50.19 | 6.69 | 70.96 | 2.4303 | 0.3003 | |||
| PGR / The Progressive Corporation | 0.02 | 31.49 | 6.06 | 24.09 | 2.2034 | -0.4569 | |||
| COST / Costco Wholesale Corporation | 0.01 | 43.48 | 6.03 | 34.54 | 2.1899 | -0.2486 | |||
| DIS / The Walt Disney Company | 0.05 | 29.83 | 5.28 | 19.87 | 1.9203 | -0.4796 | |||
| ACN / Accenture plc | 0.02 | 37.09 | 5.10 | 10.93 | 1.8543 | -0.6504 | |||
| AAPL / Apple Inc. | 0.02 | 96.91 | 4.70 | 134.77 | 1.7080 | 0.6180 | |||
| RTX / RTX Corporation | 0.03 | 40.92 | 4.44 | 61.78 | 1.6121 | 0.1192 | |||
| MCD / McDonald's Corporation | 0.01 | 40.69 | 4.25 | 45.36 | 1.5442 | -0.0472 | |||
| CSCO / Cisco Systems, Inc. | 0.06 | 28.37 | 4.24 | 26.63 | 1.5410 | -0.2825 | |||
| PEP / PepsiCo, Inc. | 0.03 | 41.92 | 4.12 | 47.23 | 1.4977 | -0.0264 | |||
| ROP / Roper Technologies, Inc. | 0.01 | 62.46 | 4.04 | 41.38 | 1.4690 | -0.0876 | |||
| ADBE / Adobe Inc. | 0.01 | 35.35 | 4.02 | 25.88 | 1.4602 | -0.2779 | |||
| GOOGL / Alphabet Inc. | 0.01 | 72.24 | 3.42 | 133.33 | 1.2415 | 0.4440 | |||
| BX / Blackstone Inc. | 0.02 | 29.61 | 3.41 | 42.74 | 1.2391 | -0.0615 | |||
| DHR / Danaher Corporation | 0.02 | 40.41 | 3.05 | 36.99 | 1.1076 | -0.1037 | |||
| ZTS / Zoetis Inc. | 0.02 | 16.33 | 2.92 | 6.95 | 1.0625 | -0.4263 | |||
| UNH / UnitedHealth Group Incorporated | 0.01 | 18.05 | 2.33 | 32.10 | 0.8450 | -0.1133 | |||
| ADP / Automatic Data Processing, Inc. | 0.01 | 123.33 | 1.97 | 112.08 | 0.7145 | 0.2095 | |||
| REGN / Regeneron Pharmaceuticals, Inc. | 0.00 | 4.48 | 1.82 | 7.37 | 0.6617 | -0.2620 | |||
| SPY / SPDR S&P 500 ETF | 0.00 | 27.75 | 1.42 | 36.02 | 0.5149 | -0.0520 | |||
| LLY / Eli Lilly and Company | 0.00 | 242.97 | 1.36 | 235.31 | 0.4935 | 0.2729 | |||
| XOM / Exxon Mobil Corporation | 0.01 | 169.49 | 1.31 | 170.95 | 0.4747 | 0.2121 | |||
| MRK / Merck & Co., Inc. | 0.02 | 140.71 | 1.28 | 149.90 | 0.4643 | 0.1856 | |||
| VZ / Verizon Communications Inc. | 0.03 | 49.42 | 1.14 | 50.86 | 0.4128 | 0.0026 | |||
| AMZN / Amazon.com, Inc. | 0.00 | 1.02 | 0.3714 | 0.3714 | |||||
| PG / The Procter & Gamble Company | 0.01 | 0.97 | 0.3542 | 0.3542 | |||||
| NVS / Novartis AG - Depositary Receipt (Common Stock) | 0.01 | 7.12 | 0.92 | 12.67 | 0.3332 | -0.1098 | |||
| ABT / Abbott Laboratories | 0.01 | 0.87 | 0.3171 | 0.3171 | |||||
| IVV / iShares Trust - iShares Core S&P 500 ETF | 0.00 | 0.67 | 0.2447 | 0.2447 | |||||
| SBUX / Starbucks Corporation | 0.01 | 0.66 | 0.2410 | 0.2410 | |||||
| SPGI / S&P Global Inc. | 0.00 | 0.55 | 0.2007 | 0.2007 | |||||
| NFLX / Netflix, Inc. | 0.00 | 0.00 | 0.45 | -7.61 | 0.1634 | -0.1015 | |||
| TSM / Taiwan Semiconductor Manufacturing Company Limited - Depositary Receipt (Common Stock) | 0.00 | 0.00 | 0.42 | 18.75 | 0.1522 | -0.0395 | |||
| PM / Philip Morris International Inc. | 0.00 | 0.00 | 0.40 | -9.36 | 0.1444 | -0.0942 | |||
| EOG / EOG Resources, Inc. | 0.00 | 1.60 | 0.36 | -7.55 | 0.1293 | -0.0802 | |||
| CSL / Carlisle Companies Incorporated | 0.00 | 0.35 | 0.1273 | 0.1273 | |||||
| UNP / Union Pacific Corporation | 0.00 | 0.30 | 0.1074 | 0.1074 | |||||
| TSLA / Tesla, Inc. | 0.00 | 0.29 | 0.1050 | 0.1050 | |||||
| KO / The Coca-Cola Company | 0.00 | 0.27 | 0.0997 | 0.0997 | |||||
| VUG / Vanguard Index Funds - Vanguard Growth ETF | 0.00 | 0.26 | 0.0958 | 0.0958 | |||||
| DCI / Donaldson Company, Inc. | 0.00 | 0.00 | 0.26 | 14.47 | 0.0952 | -0.0290 | |||
| NOW / ServiceNow, Inc. | 0.00 | 0.24 | 0.0856 | 0.0856 | |||||
| GNRC / Generac Holdings Inc. | 0.00 | 0.00 | 0.23 | 9.76 | 0.0821 | -0.0299 | |||
| SCHM / Schwab Strategic Trust - Schwab U.S. Mid-Cap ETF | 0.01 | 0.22 | 0.0808 | 0.0808 | |||||
| INTU / Intuit Inc. | 0.00 | 0.00 | 0.22 | -12.65 | 0.0806 | -0.0575 | |||
| VB / Vanguard Index Funds - Vanguard Small-Cap ETF | 0.00 | 0.22 | 0.0793 | 0.0793 | |||||
| CVX / Chevron Corporation | 0.00 | 0.22 | 0.0790 | 0.0790 | |||||
| AIG / American International Group, Inc. | 0.00 | 0.00 | 0.21 | -5.45 | 0.0756 | -0.0444 | |||
| GLD / SPDR Gold Trust | 0.00 | 0.20 | 0.0743 | 0.0743 | |||||
| PYPL / PayPal Holdings, Inc. | 0.00 | -100.00 | 0.00 | -100.00 | -0.1209 |