Estatísticas Básicas
| Valor do Portfólio | $ 311,647,880 |
| Posições Atuais | 69 |
Últimas Participações, Desempenho, AUM (de 13F, 13D)
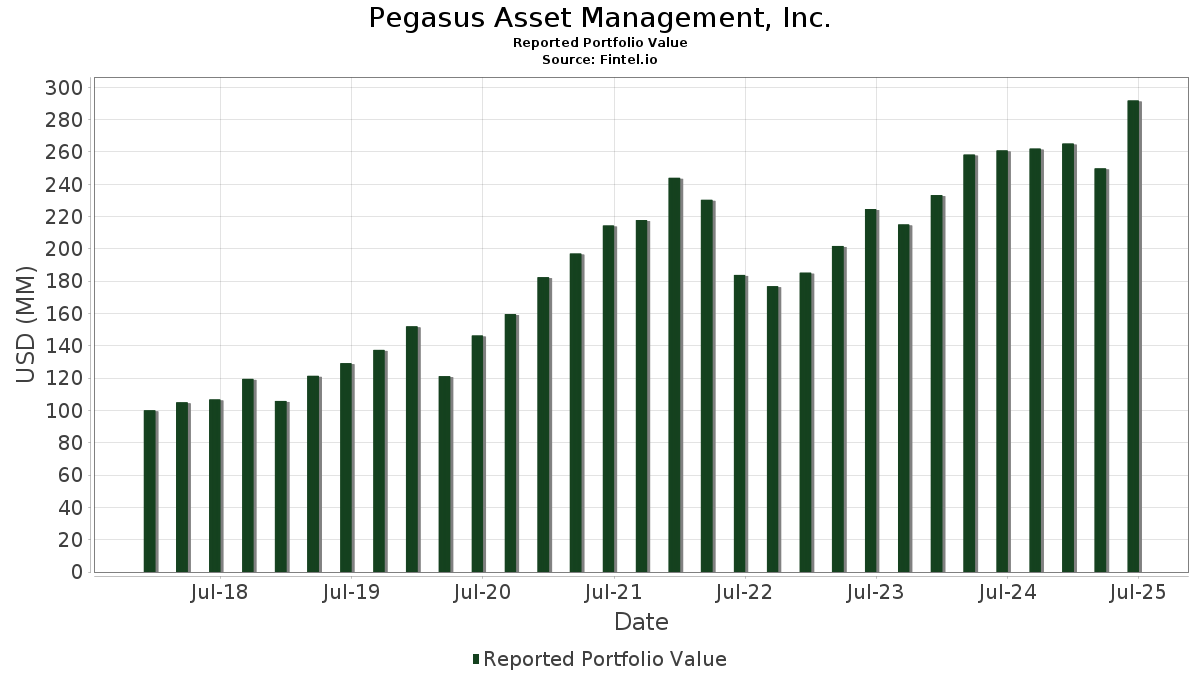
Pegasus Asset Management, Inc. divulgou 69 participações totais em seus últimos arquivamentos da SEC. O valor mais recente da carteira é calculado como $ 311,647,880 USD. O Ativo Total Sob Gestão (AUM) é esse valor mais o caixa (que não é divulgado). As principais posições de Pegasus Asset Management, Inc. são Schwab Strategic Trust - Schwab U.S. Broad Market ETF (US:SCHB) , Apple Inc. (US:AAPL) , Microsoft Corporation (US:MSFT) , Alphabet Inc. (US:GOOG) , and Direxion Shares ETF Trust - Direxion Daily NVDA Bear 1X Shares (US:NVDD) .
Maiores Aumentos Este Trimestre
Usamos a mudança na alocação do portfólio porque esta é a métrica mais significativa. As mudanças podem ser devido a operações ou mudanças nos preços das ações.
| Ativo | Ações (MM) |
Valor (MM$) |
% do Portfólio | Δ% do Portfólio |
|---|---|---|---|---|
| 0.06 | 14.67 | 4.7069 | 1.0534 | |
| 0.08 | 21.18 | 6.7966 | 0.9707 | |
| 0.02 | 4.09 | 1.3118 | 0.5997 | |
| 0.08 | 14.67 | 4.7065 | 0.4514 | |
| 0.13 | 3.44 | 1.1053 | 0.2974 | |
| 0.01 | 4.99 | 1.6010 | 0.2246 | |
| 0.02 | 2.07 | 0.6658 | 0.2241 | |
| 0.05 | 8.61 | 2.7630 | 0.2019 | |
| 0.01 | 7.01 | 2.2483 | 0.2015 | |
| 0.01 | 11.01 | 3.5335 | 0.1913 |
Maiores Diminuições Este Trimestre
Usamos a mudança na alocação do portfólio porque esta é a métrica mais significativa. As mudanças podem ser devido a operações ou mudanças nos preços das ações.
| Ativo | Ações (MM) |
Valor (MM$) |
% do Portfólio | Δ% do Portfólio |
|---|---|---|---|---|
| 0.00 | 0.00 | -0.7937 | ||
| 0.08 | 5.00 | 1.6030 | -0.4643 | |
| 0.02 | 12.75 | 4.0921 | -0.2800 | |
| 0.02 | 4.03 | 1.2936 | -0.2666 | |
| 0.04 | 4.42 | 1.4182 | -0.1687 | |
| 0.02 | 9.97 | 3.2001 | -0.1658 | |
| 0.04 | 8.43 | 2.7045 | -0.1612 | |
| 0.04 | 18.77 | 6.0243 | -0.1378 | |
| 0.03 | 5.26 | 1.6873 | -0.1352 | |
| 0.01 | 2.80 | 0.9000 | -0.0861 |
Arquivamentos 13F e Fundo
Este formulário foi arquivado em 2025-11-03 para o período de relatório 2025-09-30. Clique no ícone de link para ver o histórico completo da transação.
Atualize para desbloquear dados premium e exportar para Excel ![]() .
.
| Ativo | Tipo | Preço Médio por Ação | Ações (MM) |
ΔAções (%) |
Valor ($MM) |
ΔAções (%) |
Portfólio (%) |
ΔPortfólio (%) |
|
|---|---|---|---|---|---|---|---|---|---|
| SCHB / Schwab Strategic Trust - Schwab U.S. Broad Market ETF | 1.16 | -1.10 | 29.92 | 6.70 | 9.6004 | -0.0082 | |||
| AAPL / Apple Inc. | 0.08 | 0.39 | 21.18 | 24.59 | 6.7966 | 0.9707 | |||
| MSFT / Microsoft Corporation | 0.04 | 0.27 | 18.77 | 4.41 | 6.0243 | -0.1378 | |||
| GOOG / Alphabet Inc. | 0.06 | 0.21 | 14.67 | 37.59 | 4.7069 | 1.0534 | |||
| NVDD / Direxion Shares ETF Trust - Direxion Daily NVDA Bear 1X Shares | 0.08 | 0.03 | 14.67 | 18.13 | 4.7065 | 0.4514 | |||
| META / Meta Platforms, Inc. | 0.02 | 0.46 | 12.75 | -0.05 | 4.0921 | -0.2800 | |||
| ETN / Eaton Corporation plc | 0.03 | 0.51 | 11.75 | 5.36 | 3.7688 | -0.0511 | |||
| PH / Parker-Hannifin Corporation | 0.02 | 0.58 | 11.39 | 9.17 | 3.6556 | 0.0797 | |||
| GSCE / GS Connect S&P GSCI Enhanced Commodity Total Return ETN | 0.01 | 0.35 | 11.01 | 12.91 | 3.5335 | 0.1913 | |||
| JPM / JPMorgan Chase & Co. | 0.03 | 0.96 | 10.53 | 9.85 | 3.3783 | 0.0938 | |||
| MA / Mastercard Incorporated | 0.02 | 0.31 | 9.97 | 1.53 | 3.2001 | -0.1658 | |||
| BLK / BlackRock, Inc. | 0.01 | 0.57 | 8.87 | 11.75 | 2.8469 | 0.1261 | |||
| RTX / RTX Corporation | 0.05 | 0.54 | 8.61 | 15.21 | 2.7630 | 0.2019 | |||
| AMZN / Amazon.com, Inc. | 0.04 | 0.71 | 8.43 | 0.79 | 2.7045 | -0.1612 | |||
| BRK.B / Berkshire Hathaway Inc. | 0.02 | 0.65 | 8.37 | 4.17 | 2.6851 | -0.0677 | |||
| LLY / Eli Lilly and Company | 0.01 | 19.85 | 7.01 | 17.31 | 2.2483 | 0.2015 | |||
| PWR / Quanta Services, Inc. | 0.01 | 1.21 | 5.81 | 10.93 | 1.8633 | 0.0696 | |||
| PG / The Procter & Gamble Company | 0.03 | 2.52 | 5.26 | -1.13 | 1.6873 | -0.1352 | |||
| SPY / SPDR S&P 500 ETF | 0.01 | -1.86 | 5.02 | 5.82 | 1.6113 | -0.0150 | |||
| CARR / Carrier Global Corporation | 0.08 | 1.53 | 5.00 | -17.19 | 1.6030 | -0.4643 | |||
| ASML / ASML Holding N.V. - Depositary Receipt (Common Stock) | 0.01 | 2.83 | 4.99 | 24.23 | 1.6010 | 0.2246 | |||
| CVX / Chevron Corporation | 0.03 | 1.64 | 4.86 | 10.22 | 1.5581 | 0.0486 | |||
| PEP / PepsiCo, Inc. | 0.03 | 1.26 | 4.65 | 7.72 | 1.4912 | 0.0125 | |||
| DUK / Duke Energy Corporation | 0.04 | 1.50 | 4.61 | 6.45 | 1.4778 | -0.0049 | |||
| WMT / Walmart Inc. | 0.04 | 0.54 | 4.49 | 5.97 | 1.4418 | -0.0112 | |||
| DIS / The Walt Disney Company | 0.04 | 3.37 | 4.42 | -4.56 | 1.4182 | -0.1687 | |||
| VTI / Vanguard Index Funds - Vanguard Total Stock Market ETF | 0.01 | 3.19 | 4.38 | 11.41 | 1.4070 | 0.0583 | |||
| PANW / Palo Alto Networks, Inc. | 0.02 | 97.73 | 4.09 | 96.82 | 1.3118 | 0.5997 | |||
| CRM / Salesforce, Inc. | 0.02 | 1.88 | 4.03 | -11.46 | 1.2936 | -0.2666 | |||
| SOFI / SoFi Technologies, Inc. | 0.13 | 0.71 | 3.44 | 46.12 | 1.1053 | 0.2974 | |||
| MDY / SPDR S&P MidCap 400 ETF Trust | 0.00 | 0.00 | 2.97 | 5.20 | 0.9540 | -0.0143 | |||
| BA / The Boeing Company | 0.01 | 1.84 | 2.86 | 4.91 | 0.9185 | -0.0166 | |||
| ADP / Automatic Data Processing, Inc. | 0.01 | 2.42 | 2.80 | -2.54 | 0.9000 | -0.0861 | |||
| MAR / Marriott International, Inc. | 0.01 | 2.42 | 2.46 | -2.38 | 0.7886 | -0.0740 | |||
| HD / The Home Depot, Inc. | 0.01 | 1.30 | 2.44 | 11.95 | 0.7819 | 0.0360 | |||
| SBUX / Starbucks Corporation | 0.02 | 74.35 | 2.07 | 60.90 | 0.6658 | 0.2241 | |||
| GLD / SPDR Gold Shares | 0.01 | -1.65 | 2.01 | 14.67 | 0.6448 | 0.0443 | |||
| SYK / Stryker Corporation | 0.01 | 2.69 | 1.93 | -4.08 | 0.6195 | -0.0700 | |||
| GOOGL / Alphabet Inc. | 0.01 | 0.00 | 1.39 | 37.86 | 0.4467 | 0.1009 | |||
| HON / Honeywell International Inc. | 0.01 | 0.00 | 1.30 | -9.62 | 0.4163 | -0.0756 | |||
| CRWD / CrowdStrike Holdings, Inc. | 0.00 | 2.47 | 1.22 | -1.37 | 0.3920 | -0.0323 | |||
| TSLA / Tesla, Inc. | 0.00 | 0.00 | 1.10 | 40.00 | 0.3528 | 0.0837 | |||
| 0I35 / Consolidated Edison, Inc. | 0.01 | -0.35 | 1.02 | -0.20 | 0.3259 | -0.0228 | |||
| XOM / Exxon Mobil Corporation | 0.01 | -0.93 | 0.95 | 3.60 | 0.3048 | -0.0093 | |||
| DIA / SPDR Dow Jones Industrial Average ETF Trust | 0.00 | -3.07 | 0.94 | 2.07 | 0.3007 | -0.0141 | |||
| MRKCL / Merck & Co., Inc. | 0.01 | -11.47 | 0.92 | -6.21 | 0.2961 | -0.0408 | |||
| MDXG / MiMedx Group, Inc. | 0.12 | -22.50 | 0.87 | -11.46 | 0.2777 | -0.0573 | |||
| IBM / International Business Machines Corporation | 0.00 | 1.04 | 0.82 | -3.30 | 0.2632 | -0.0274 | |||
| VOO / Vanguard Index Funds - Vanguard S&P 500 ETF | 0.00 | 65.94 | 0.79 | 79.01 | 0.2547 | 0.1026 | |||
| SCHM / Schwab Strategic Trust - Schwab U.S. Mid-Cap ETF | 0.03 | 0.00 | 0.76 | 5.68 | 0.2449 | -0.0026 | |||
| BRK.A / Berkshire Hathaway Inc. | 0.00 | 0.00 | 0.75 | 3.57 | 0.2420 | -0.0077 | |||
| SCHA / Schwab Strategic Trust - Schwab U.S. Small-Cap ETF | 0.02 | 0.00 | 0.68 | 10.34 | 0.2194 | 0.0069 | |||
| JEPI / J.P. Morgan Exchange-Traded Fund Trust - JPMorgan Equity Premium Income ETF | 0.01 | 35.66 | 0.64 | 36.11 | 0.2047 | 0.0443 | |||
| VYMI / Vanguard Whitehall Funds - Vanguard International High Dividend Yield ETF | 0.01 | 34.38 | 0.47 | 42.04 | 0.1519 | 0.0377 | |||
| IWO / iShares Trust - iShares Russell 2000 Growth ETF | 0.00 | 0.00 | 0.43 | 12.14 | 0.1394 | 0.0064 | |||
| V / Visa Inc. | 0.00 | 0.09 | 0.37 | -3.66 | 0.1182 | -0.0130 | |||
| SCHX / Schwab Strategic Trust - Schwab U.S. Large-Cap ETF | 0.01 | 51.67 | 0.36 | 63.23 | 0.1170 | 0.0406 | |||
| AFL / Aflac Incorporated | 0.00 | 0.00 | 0.34 | 5.92 | 0.1094 | -0.0009 | |||
| COST / Costco Wholesale Corporation | 0.00 | 0.00 | 0.33 | -6.44 | 0.1072 | -0.0152 | |||
| BX / Blackstone Inc. | 0.00 | 0.00 | 0.33 | 14.29 | 0.1055 | 0.0069 | |||
| UNP / Union Pacific Corporation | 0.00 | 0.16 | 0.31 | 3.04 | 0.0980 | -0.0037 | |||
| SCHD / Schwab Strategic Trust - Schwab U.S. Dividend Equity ETF | 0.01 | -4.69 | 0.30 | -1.97 | 0.0958 | -0.0084 | |||
| PEG / Public Service Enterprise Group Incorporated | 0.00 | 0.00 | 0.28 | -1.05 | 0.0907 | -0.0070 | |||
| ORCL / Oracle Corporation | 0.00 | 0.00 | 0.28 | 28.90 | 0.0902 | 0.0153 | |||
| NFLX / Netflix, Inc. | 0.00 | 0.00 | 0.27 | -10.40 | 0.0858 | -0.0165 | |||
| IJR / iShares Trust - iShares Core S&P Small-Cap ETF | 0.00 | 0.00 | 0.26 | 8.94 | 0.0822 | 0.0015 | |||
| BR / Broadridge Financial Solutions, Inc. | 0.00 | 0.00 | 0.23 | -2.13 | 0.0740 | -0.0066 | |||
| SCHG / Schwab Strategic Trust - Schwab U.S. Large-Cap Growth ETF | 0.01 | -7.25 | 0.23 | 1.35 | 0.0725 | -0.0039 | |||
| CLX / The Clorox Company | 0.00 | -0.36 | 0.21 | 2.50 | 0.0658 | -0.0029 | |||
| IRM / Iron Mountain Incorporated | 0.00 | -100.00 | 0.00 | 0.0000 | |||||
| ACN / Accenture plc | 0.00 | -100.00 | 0.00 | 0.0000 | |||||
| NKE / NIKE, Inc. | 0.00 | -100.00 | 0.00 | -100.00 | -0.7937 |