Estatísticas Básicas
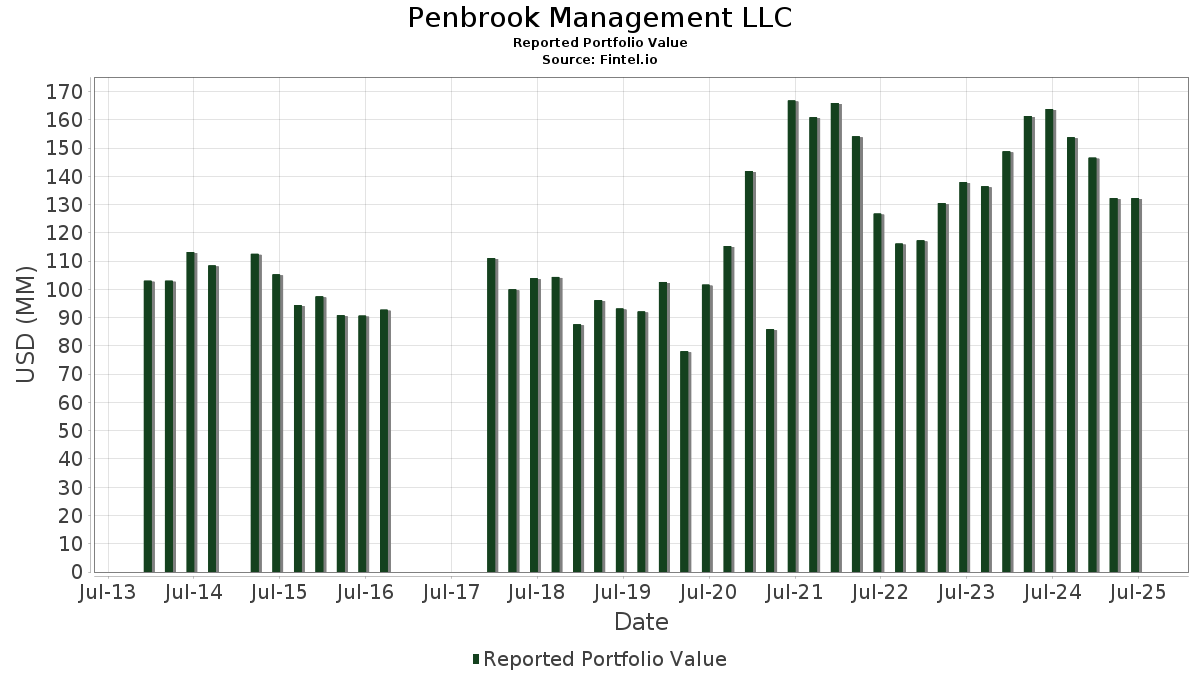
| Valor do Portfólio | $ 144,978,590 |
| Posições Atuais | 97 |
Últimas Participações, Desempenho, AUM (de 13F, 13D)
Penbrook Management LLC divulgou 97 participações totais em seus últimos arquivamentos da SEC. O valor mais recente da carteira é calculado como $ 144,978,590 USD. O Ativo Total Sob Gestão (AUM) é esse valor mais o caixa (que não é divulgado). As principais posições de Penbrook Management LLC são Novo Nordisk A/S - Depositary Receipt (Common Stock) (US:NVO) , Amazon.com, Inc. (US:AMZN) , Microsoft Corporation (US:MSFT) , Alphabet Inc. (US:GOOGL) , and Alphabet Inc. (US:GOOG) . As novas posições de Penbrook Management LLC incluem DoubleVerify Holdings, Inc. (US:DV) , Triple Flag Precious Metals Corp. (US:TFPM) , Paysign, Inc. (US:PAYS) , Iovance Biotherapeutics, Inc. (US:IOVA) , and .
Maiores Aumentos Este Trimestre
Usamos a mudança na alocação do portfólio porque esta é a métrica mais significativa. As mudanças podem ser devido a operações ou mudanças nos preços das ações.
| Ativo | Ações (MM) |
Valor (MM$) |
% do Portfólio | Δ% do Portfólio |
|---|---|---|---|---|
| 0.30 | 5.82 | 4.0159 | 1.1683 | |
| 0.02 | 7.25 | 5.0023 | 1.0696 | |
| 0.02 | 7.08 | 4.8817 | 1.0183 | |
| 0.10 | 1.18 | 0.8120 | 0.8120 | |
| 0.11 | 3.54 | 2.4430 | 0.6582 | |
| 0.35 | 2.76 | 1.9064 | 0.6393 | |
| 0.10 | 2.84 | 1.9591 | 0.3312 | |
| 0.05 | 11.95 | 8.2407 | 0.3087 | |
| 0.01 | 6.95 | 4.7921 | 0.2511 | |
| 0.01 | 0.34 | 0.2325 | 0.2325 |
Maiores Diminuições Este Trimestre
Usamos a mudança na alocação do portfólio porque esta é a métrica mais significativa. As mudanças podem ser devido a operações ou mudanças nos preços das ações.
| Ativo | Ações (MM) |
Valor (MM$) |
% do Portfólio | Δ% do Portfólio |
|---|---|---|---|---|
| 0.02 | 11.00 | 7.5890 | -1.2005 | |
| 0.32 | 16.10 | 11.1040 | -0.9684 | |
| 0.11 | 2.32 | 1.6001 | -0.8438 | |
| 0.02 | 3.30 | 2.2738 | -0.4211 | |
| 0.35 | 1.32 | 0.9103 | -0.3801 | |
| 0.02 | 1.28 | 0.8808 | -0.2709 | |
| 0.02 | 1.11 | 0.7652 | -0.2409 | |
| 0.00 | 0.00 | -0.2032 | ||
| 0.01 | 2.28 | 1.5735 | -0.1919 | |
| 0.00 | 0.00 | -0.1773 |
Arquivamentos 13F e Fundo
Este formulário foi arquivado em 2026-01-06 para o período de relatório 2025-12-31. Clique no ícone de link para ver o histórico completo da transação.
Atualize para desbloquear dados premium e exportar para Excel ![]() .
.
| Ativo | Tipo | Preço Médio por Ação | Ações (MM) |
ΔAções (%) |
Valor ($MM) |
ΔAções (%) |
Portfólio (%) |
ΔPortfólio (%) |
|
|---|---|---|---|---|---|---|---|---|---|
| NVO / Novo Nordisk A/S - Depositary Receipt (Common Stock) | 0.32 | 1.54 | 16.10 | -6.89 | 11.1040 | -0.9684 | |||
| AMZN / Amazon.com, Inc. | 0.05 | 0.04 | 11.95 | 5.17 | 8.2407 | 0.3087 | |||
| MSFT / Microsoft Corporation | 0.02 | -6.40 | 11.00 | -12.60 | 7.5890 | -1.2005 | |||
| GOOGL / Alphabet Inc. | 0.02 | 0.00 | 7.25 | 28.76 | 5.0023 | 1.0696 | |||
| GOOG / Alphabet Inc. | 0.02 | -0.73 | 7.08 | 27.91 | 4.8817 | 1.0183 | |||
| MCO / Moody's Corporation | 0.01 | -0.37 | 6.95 | 6.83 | 4.7921 | 0.2511 | |||
| PL / Planet Labs PBC | 0.30 | -6.04 | 5.82 | 42.77 | 4.0159 | 1.1683 | |||
| PLAB / Photronics, Inc. | 0.11 | -0.63 | 3.54 | 38.54 | 2.4430 | 0.6582 | |||
| TRI / Thomson Reuters Corporation | 0.02 | 0.40 | 3.30 | -14.59 | 2.2738 | -0.4211 | |||
| ALKT / Alkami Technology, Inc. | 0.13 | 2.86 | 2.95 | -4.48 | 2.0318 | -0.1212 | |||
| SA / Seabridge Gold Inc. | 0.10 | -0.57 | 2.84 | 21.84 | 1.9591 | 0.3312 | |||
| ELVA / Electrovaya Inc. | 0.35 | 13.62 | 2.76 | 52.32 | 1.9064 | 0.6393 | |||
| AEHR / Aehr Test Systems, Inc. | 0.11 | -1.16 | 2.32 | -33.74 | 1.6001 | -0.8438 | |||
| BX / Blackstone Inc. | 0.01 | 0.00 | 2.28 | -9.77 | 1.5735 | -0.1919 | |||
| VMD / Viemed Healthcare, Inc. | 0.27 | -0.29 | 2.02 | 9.09 | 1.3917 | 0.1006 | |||
| NNY / Nuveen New York Municipal Value Fund | 0.21 | 0.00 | 1.83 | 3.68 | 1.2625 | 0.0299 | |||
| SONY / Sony Group Corporation - Depositary Receipt (Common Stock) | 0.07 | 0.00 | 1.75 | -11.11 | 1.2096 | -0.1674 | |||
| BRK.B / Berkshire Hathaway Inc. | 0.00 | -0.74 | 1.68 | -0.77 | 1.1615 | -0.0232 | |||
| VET / Vermilion Energy Inc. | 0.20 | 10.16 | 1.65 | 17.46 | 1.1369 | 0.1573 | |||
| ADP / Automatic Data Processing, Inc. | 0.01 | 0.00 | 1.62 | -12.39 | 1.1178 | -0.1732 | |||
| MESO / Mesoblast Limited - Depositary Receipt (Common Stock) | 0.09 | -0.11 | 1.58 | 11.83 | 1.0897 | 0.1035 | |||
| BPOP / Popular, Inc. | 0.01 | -5.20 | 1.48 | -7.06 | 1.0178 | -0.0907 | |||
| CSCO / Cisco Systems, Inc. | 0.02 | 0.00 | 1.41 | 12.59 | 0.9750 | 0.0984 | |||
| CURI / CuriosityStream Inc. | 0.35 | -0.40 | 1.32 | -28.63 | 0.9103 | -0.3801 | |||
| TRGP / Targa Resources Corp. | 0.01 | -21.13 | 1.30 | -13.14 | 0.8944 | -0.1480 | |||
| SYF / Synchrony Financial | 0.02 | -14.84 | 1.29 | 0.00 | 0.8920 | -0.0109 | |||
| ACLS / Axcelis Technologies, Inc. | 0.02 | -5.92 | 1.28 | -22.56 | 0.8808 | -0.2709 | |||
| VZ / Verizon Communications Inc. | 0.03 | -6.32 | 1.27 | -13.15 | 0.8747 | -0.1451 | |||
| ET / Energy Transfer LP - Limited Partnership | 0.07 | -8.71 | 1.23 | -12.29 | 0.8472 | -0.1303 | |||
| ABNB / Airbnb, Inc. | 0.01 | 1.13 | 1.21 | 13.04 | 0.8378 | 0.0876 | |||
| ABBV / AbbVie Inc. | 0.01 | -0.82 | 1.20 | -2.05 | 0.8243 | -0.0282 | |||
| DV / DoubleVerify Holdings, Inc. | 0.10 | 1.18 | 0.8120 | 0.8120 | |||||
| SPY / SPDR S&P 500 ETF | 0.00 | -4.18 | 1.17 | -1.92 | 0.8090 | -0.0259 | |||
| WMB / The Williams Companies, Inc. | 0.02 | -0.78 | 1.15 | -5.90 | 0.7932 | -0.0596 | |||
| QQQ / Invesco QQQ Trust, Series 1 | 0.00 | -3.86 | 1.15 | -1.63 | 0.7924 | -0.0229 | |||
| DAIO / Data I/O Corporation | 0.36 | 1.16 | 1.13 | -3.99 | 0.7803 | -0.0423 | |||
| META / Meta Platforms, Inc. | 0.00 | 0.00 | 1.12 | -10.10 | 0.7740 | -0.0977 | |||
| FNF / Fidelity National Financial, Inc. | 0.02 | -14.69 | 1.11 | -22.99 | 0.7652 | -0.2409 | |||
| HESM / Hess Midstream LP | 0.03 | 30.50 | 1.04 | 30.31 | 0.7152 | 0.1597 | |||
| NVDD / Direxion Shares ETF Trust - Direxion Daily NVDA Bear 1X Shares | 0.01 | 0.00 | 0.97 | 0.00 | 0.6719 | -0.0085 | |||
| USAC / USA Compression Partners, LP - Limited Partnership | 0.04 | 5.66 | 0.94 | 1.18 | 0.6510 | 0.0002 | |||
| FBP / First BanCorp. | 0.04 | -14.64 | 0.93 | -19.76 | 0.6420 | -0.1678 | |||
| COHU / Cohu, Inc. | 0.04 | -22.63 | 0.89 | -11.43 | 0.6147 | -0.0879 | |||
| ASUR / Asure Software, Inc. | 0.09 | -1.57 | 0.84 | 13.06 | 0.5798 | 0.0608 | |||
| OKE / ONEOK, Inc. | 0.01 | -0.88 | 0.83 | -0.12 | 0.5734 | -0.0079 | |||
| MRVL / Marvell Technology, Inc. | 0.01 | -0.10 | 0.83 | 0.98 | 0.5703 | -0.0014 | |||
| NPKI / NPK International Inc. | 0.07 | -1.95 | 0.80 | 3.35 | 0.5529 | 0.0113 | |||
| NVS / Novartis AG - Depositary Receipt (Common Stock) | 0.01 | 0.00 | 0.77 | 7.51 | 0.5335 | 0.0312 | |||
| PAR / PAR Technology Corporation | 0.02 | 55.35 | 0.72 | 42.46 | 0.4959 | 0.1434 | |||
| SGOL / abrdn Gold ETF Trust - abrdn Physical Gold Shares ETF | 0.02 | -4.40 | 0.70 | 6.67 | 0.4861 | 0.0249 | |||
| EMR / Emerson Electric Co. | 0.01 | -1.85 | 0.70 | -0.71 | 0.4852 | -0.0094 | |||
| SHEL / Shell plc - Depositary Receipt (Common Stock) | 0.01 | 0.00 | 0.69 | 2.68 | 0.4764 | 0.0070 | |||
| WES / Western Midstream Partners, LP - Limited Partnership | 0.02 | 8.90 | 0.63 | 9.60 | 0.4332 | 0.0327 | |||
| REGN / Regeneron Pharmaceuticals, Inc. | 0.00 | 0.00 | 0.62 | 37.28 | 0.4243 | 0.1114 | |||
| BLFS / BioLife Solutions, Inc. | 0.02 | -0.86 | 0.56 | -5.93 | 0.3829 | -0.0296 | |||
| CYRX / Cryoport, Inc. | 0.05 | 0.12 | 0.51 | 1.40 | 0.3499 | 0.0006 | |||
| CVE / Cenovus Energy Inc. | 0.03 | 0.00 | 0.51 | -0.39 | 0.3487 | -0.0057 | |||
| MGNI / Magnite, Inc. | 0.03 | 9.48 | 0.50 | -18.45 | 0.3483 | -0.0839 | |||
| RRC / Range Resources Corporation | 0.01 | -0.70 | 0.50 | -6.86 | 0.3463 | -0.0305 | |||
| PIM / Putnam Master Intermediate Income Trust | 0.15 | 0.00 | 0.49 | -2.77 | 0.3388 | -0.0144 | |||
| IBM / International Business Machines Corporation | 0.00 | -1.51 | 0.48 | 3.22 | 0.3324 | 0.0070 | |||
| AAPL / Apple Inc. | 0.00 | -11.57 | 0.42 | -5.68 | 0.2867 | -0.0207 | |||
| TTI / TETRA Technologies, Inc. | 0.04 | -1.40 | 0.41 | 60.94 | 0.2842 | 0.1052 | |||
| LINC / Lincoln Educational Services Corporation | 0.02 | 36.20 | 0.41 | 40.27 | 0.2836 | 0.0785 | |||
| GPN / Global Payments Inc. | 0.01 | 0.00 | 0.40 | -6.84 | 0.2731 | -0.0236 | |||
| EPD / Enterprise Products Partners L.P. - Limited Partnership | 0.01 | 0.00 | 0.37 | 2.52 | 0.2527 | 0.0032 | |||
| DMLP / Dorchester Minerals, L.P. - Limited Partnership | 0.02 | 15.69 | 0.36 | -0.28 | 0.2502 | -0.0033 | |||
| BMY / Bristol-Myers Squibb Company | 0.01 | 0.34 | 0.2325 | 0.2325 | |||||
| OSS / One Stop Systems, Inc. | 0.05 | -1.42 | 0.34 | 31.89 | 0.2315 | 0.0540 | |||
| BLZE / Backblaze, Inc. | 0.07 | 37.15 | 0.33 | -31.12 | 0.2293 | -0.1077 | |||
| POWI / Power Integrations, Inc. | 0.01 | 0.00 | 0.33 | -11.65 | 0.2255 | -0.0328 | |||
| KLIC / Kulicke and Soffa Industries, Inc. | 0.01 | -17.44 | 0.32 | -7.45 | 0.2231 | -0.0209 | |||
| GBDC / Golub Capital BDC, Inc. | 0.02 | -5.11 | 0.32 | -5.87 | 0.2216 | -0.0169 | |||
| RSP / Invesco Exchange-Traded Fund Trust - Invesco S&P 500 Equal Weight ETF | 0.00 | 0.00 | 0.32 | 0.95 | 0.2207 | -0.0005 | |||
| BBSI / Barrett Business Services, Inc. | 0.01 | -22.12 | 0.32 | -36.40 | 0.2198 | -0.1299 | |||
| HTGC / Hercules Capital, Inc. | 0.01 | -0.05 | 0.28 | -0.72 | 0.1917 | -0.0034 | |||
| AQST / Aquestive Therapeutics, Inc. | 0.04 | -3.27 | 0.27 | 11.93 | 0.1879 | 0.0177 | |||
| KOPN / Kopin Corporation | 0.11 | -16.06 | 0.27 | -18.98 | 0.1856 | -0.0468 | |||
| FAF / First American Financial Corporation | 0.00 | -2.27 | 0.26 | -6.38 | 0.1822 | -0.0151 | |||
| WBS / Webster Financial Corporation | 0.00 | 0.00 | 0.26 | 6.05 | 0.1815 | 0.0080 | |||
| SPYM / SPDR Series Trust - State Street SPDR Portfolio S&P 500 ETF | 0.00 | -8.57 | 0.26 | -6.57 | 0.1771 | -0.0144 | |||
| NKE / NIKE, Inc. | 0.00 | -1.27 | 0.25 | -9.85 | 0.1707 | -0.0209 | |||
| JEPI / J.P. Morgan Exchange-Traded Fund Trust - JPMorgan Equity Premium Income ETF | 0.00 | -2.31 | 0.24 | -2.03 | 0.1668 | -0.0056 | |||
| UTG / Reaves Utility Income Fund | 0.01 | -0.82 | 0.22 | -8.33 | 0.1520 | -0.0160 | |||
| AFL / Aflac Incorporated | 0.00 | 0.00 | 0.22 | -0.92 | 0.1483 | -0.0038 | |||
| FIS / Fidelity National Information Services, Inc. | 0.00 | -21.82 | 0.21 | -21.03 | 0.1478 | -0.0421 | |||
| JPM / JPMorgan Chase & Co. | 0.00 | 0.00 | 0.21 | 1.92 | 0.1467 | 0.0013 | |||
| CVX / Chevron Corporation | 0.00 | 0.00 | 0.21 | -1.88 | 0.1448 | -0.0045 | |||
| TFPM / Triple Flag Precious Metals Corp. | 0.01 | 0.20 | 0.1395 | 0.1395 | |||||
| VKQ / Invesco Municipal Trust | 0.02 | 0.00 | 0.19 | 0.00 | 0.1331 | -0.0016 | |||
| NUV / Nuveen Municipal Value Fund, Inc. | 0.02 | 0.00 | 0.18 | 1.12 | 0.1250 | -0.0004 | |||
| PAYS / Paysign, Inc. | 0.03 | 0.16 | 0.1095 | 0.1095 | |||||
| ONDS / Ondas Holdings Inc. | 0.01 | -27.79 | 0.10 | -8.49 | 0.0674 | -0.0073 | |||
| IOVA / Iovance Biotherapeutics, Inc. | 0.03 | 0.09 | 0.0639 | 0.0639 | |||||
| XGN / Exagen Inc. | 0.01 | -32.55 | 0.08 | -62.84 | 0.0563 | -0.0965 | |||
| BTQ / Morgan Stanley - Preferred Stock | 0.01 | -28.34 | 0.05 | -47.06 | 0.0373 | -0.0339 | |||
| MIN / MFS Intermediate Income Trust | 0.02 | -27.02 | 0.05 | -29.41 | 0.0338 | -0.0143 | |||
| DEFT / DeFi Technologies Inc. | 0.00 | -100.00 | 0.00 | -100.00 | -0.0159 | ||||
| CISO / CISO Global Inc. | 0.00 | -100.00 | 0.00 | 0.0000 | |||||
| INVE / Identiv, Inc. | 0.00 | -100.00 | 0.00 | -100.00 | -0.1773 | ||||
| ASPN / Aspen Aerogels, Inc. | 0.00 | -100.00 | 0.00 | 0.0000 | |||||
| PBI / Pitney Bowes Inc. | 0.00 | -100.00 | 0.00 | 0.0000 | |||||
| JPC / Nuveen Preferred & Income Opportunities Fund | 0.00 | -100.00 | 0.00 | 0.0000 | |||||
| IREN / IREN Limited | 0.00 | -100.00 | 0.00 | -100.00 | -0.2032 | ||||
| OPTT / Ocean Power Technologies, Inc. | 0.00 | -100.00 | 0.00 | 0.0000 | |||||
| OESX / Orion Energy Systems, Inc. | 0.00 | -100.00 | 0.00 | 0.0000 | |||||
| BLDR / Builders FirstSource, Inc. | 0.00 | -100.00 | 0.00 | 0.0000 | |||||
| WLY / John Wiley & Sons, Inc. | 0.00 | -100.00 | 0.00 | 0.0000 | |||||
| UAMY / United States Antimony Corporation | 0.00 | -100.00 | 0.00 | 0.0000 |