Estatísticas Básicas
| Valor do Portfólio | $ 11,574,812 |
| Posições Atuais | 33 |
Últimas Participações, Desempenho, AUM (de 13F, 13D)
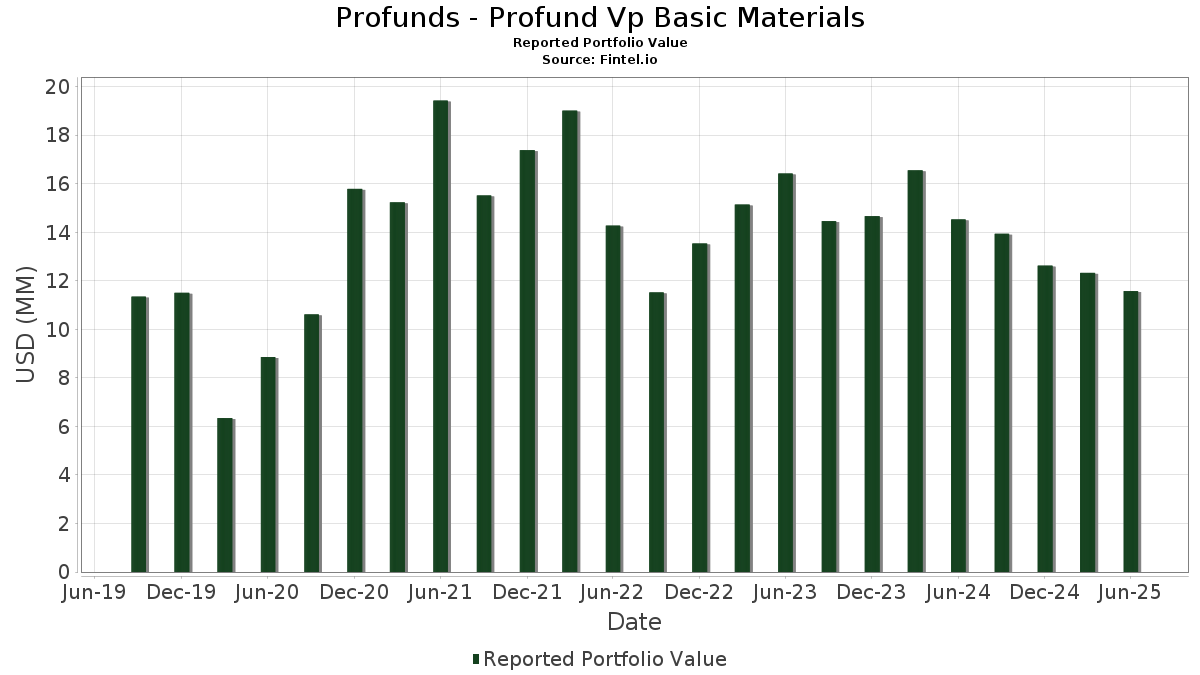
Profunds - Profund Vp Basic Materials divulgou 33 participações totais em seus últimos arquivamentos da SEC. O valor mais recente da carteira é calculado como $ 11,574,812 USD. O Ativo Total Sob Gestão (AUM) é esse valor mais o caixa (que não é divulgado). As principais posições de Profunds - Profund Vp Basic Materials são Linde plc (US:LIN) , The Sherwin-Williams Company (US:SHW) , Ecolab Inc. (US:ECL) , Newmont Corporation (US:NEM) , and Freeport-McMoRan Inc. (US:FCX) .
Maiores Aumentos Este Trimestre
Usamos a mudança na alocação do portfólio porque esta é a métrica mais significativa. As mudanças podem ser devido a operações ou mudanças nos preços das ações.
| Ativo | Ações (MM) |
Valor (MM$) |
% do Portfólio | Δ% do Portfólio |
|---|---|---|---|---|
| 0.04 | 0.34 | 2.9295 | 1.1457 | |
| 0.09 | 0.8070 | 0.8070 | ||
| 0.00 | 0.51 | 4.3926 | 0.6756 | |
| 0.00 | 0.48 | 4.1584 | 0.5636 | |
| 0.06 | 0.5409 | 0.5409 | ||
| 0.01 | 0.19 | 1.6099 | 0.5182 | |
| 0.00 | 0.51 | 4.3621 | 0.4415 | |
| 0.00 | 0.42 | 3.5920 | 0.3642 | |
| 0.00 | 0.24 | 2.0734 | 0.3433 | |
| 0.03 | 0.2662 | 0.2662 |
Maiores Diminuições Este Trimestre
Usamos a mudança na alocação do portfólio porque esta é a métrica mais significativa. As mudanças podem ser devido a operações ou mudanças nos preços das ações.
| Ativo | Ações (MM) |
Valor (MM$) |
% do Portfólio | Δ% do Portfólio |
|---|---|---|---|---|
| 0.00 | 1.87 | 16.0563 | -2.0623 | |
| 0.00 | 0.67 | 5.7544 | -0.8565 | |
| 0.00 | 0.53 | 4.5624 | -0.8001 | |
| 0.01 | 0.30 | 2.6040 | -0.5231 | |
| 0.00 | 0.58 | 4.9412 | -0.2792 | |
| 0.00 | 0.24 | 2.0695 | -0.2524 | |
| 0.01 | 0.40 | 3.4392 | -0.1392 | |
| 0.00 | 0.14 | 1.1993 | -0.0919 | |
| 0.01 | 0.53 | 4.5156 | -0.0892 | |
| 0.00 | 0.12 | 1.0261 | -0.0514 |
Arquivamentos 13F e Fundo
Este formulário foi arquivado em 2025-08-26 para o período de relatório 2025-06-30. Clique no ícone de link para ver o histórico completo da transação.
Atualize para desbloquear dados premium e exportar para Excel ![]() .
.
| Ativo | Tipo | Preço Médio por Ação | Ações (MM) |
ΔAções (%) |
Valor ($MM) |
ΔAções (%) |
Portfólio (%) |
ΔPortfólio (%) |
|
|---|---|---|---|---|---|---|---|---|---|
| LIN / Linde plc | 0.00 | -17.47 | 1.87 | -16.85 | 16.0563 | -2.0623 | |||
| SHW / The Sherwin-Williams Company | 0.00 | -16.94 | 0.67 | -18.29 | 5.7544 | -0.8565 | |||
| ECL / Ecolab Inc. | 0.00 | -16.43 | 0.58 | -11.13 | 4.9412 | -0.2792 | |||
| NEM / Newmont Corporation | 0.01 | -22.33 | 0.56 | -6.41 | 4.7719 | -0.0056 | |||
| FCX / Freeport-McMoRan Inc. | 0.01 | -14.93 | 0.54 | -2.54 | 4.6158 | 0.1695 | |||
| APD / Air Products and Chemicals, Inc. | 0.00 | -16.53 | 0.53 | -20.15 | 4.5624 | -0.8001 | |||
| CTVA / Corteva, Inc. | 0.01 | -22.31 | 0.53 | -8.06 | 4.5156 | -0.0892 | |||
| MLM / Martin Marietta Materials, Inc. | 0.00 | -3.42 | 0.51 | 10.85 | 4.3926 | 0.6756 | |||
| VMC / Vulcan Materials Company | 0.00 | -6.62 | 0.51 | 4.53 | 4.3621 | 0.4415 | |||
| NUE / Nucor Corporation | 0.00 | 0.84 | 0.48 | 8.52 | 4.1584 | 0.5636 | |||
| DD / DuPont de Nemours, Inc. | 0.01 | 2.71 | 0.47 | -5.68 | 3.9932 | 0.0212 | |||
| PPG / PPG Industries, Inc. | 0.00 | 0.38 | 0.42 | 4.50 | 3.5920 | 0.3642 | |||
| IPCL / International Paper Company | 0.01 | 2.74 | 0.40 | -9.91 | 3.4392 | -0.1392 | |||
| SW / Smurfit Westrock Plc | 0.01 | 2.89 | 0.35 | -1.42 | 2.9767 | 0.1420 | |||
| AMCR / Amcor plc | 0.04 | 62.65 | 0.34 | 54.30 | 2.9295 | 1.1457 | |||
| IFF / International Flavors & Fragrances Inc. | 0.00 | 2.65 | 0.30 | -2.88 | 2.6174 | 0.0927 | |||
| DOW / Dow Inc. | 0.01 | 3.04 | 0.30 | -21.91 | 2.6040 | -0.5231 | |||
| STLD / Steel Dynamics, Inc. | 0.00 | 0.04 | 0.29 | 2.51 | 2.4585 | 0.2054 | |||
| PKG / Packaging Corporation of America | 0.00 | 2.84 | 0.27 | -2.16 | 2.3428 | 0.0966 | |||
| BLL / Ball Corp. | 0.00 | -4.63 | 0.25 | 2.86 | 2.1646 | 0.1876 | |||
| CF / CF Industries Holdings, Inc. | 0.00 | -4.48 | 0.24 | 12.62 | 2.0734 | 0.3433 | |||
| LYB / LyondellBasell Industries N.V. | 0.00 | 1.76 | 0.24 | -16.32 | 2.0695 | -0.2524 | |||
| AVY / Avery Dennison Corporation | 0.00 | -0.16 | 0.22 | -1.33 | 1.9087 | 0.0893 | |||
| MOS / The Mosaic Company | 0.01 | 2.45 | 0.19 | 38.52 | 1.6099 | 0.5182 | |||
| EMN / Eastman Chemical Company | 0.00 | 2.86 | 0.14 | -13.12 | 1.1993 | -0.0919 | |||
| ALB / Albemarle Corporation | 0.00 | 2.69 | 0.12 | -10.53 | 1.0261 | -0.0514 | |||
| HSBC SECURITIES (USA), INC. B 4.3 , 7/01/2025 / RA (N/A) | 0.09 | 0.8070 | 0.8070 | ||||||
| SOCIETE' GENERALE 4.26 , 7/01/2025 / RA (N/A) | 0.06 | 0.5409 | 0.5409 | ||||||
| CREDIT AGRICOLE CIB NY 4.26 , 7/01/2025 / RA (N/A) | 0.03 | 0.2662 | 0.2662 | ||||||
| UMB FINANCIAL CORP. B 4.1 , 7/01/2025 / RA (N/A) | 0.03 | 0.2576 | 0.2576 | ||||||
| NATWEST MARKETS PLC 4.24 , 7/01/2025 / RA (N/A) | 0.03 | 0.2232 | 0.2232 | ||||||
| ROYAL BANK OF CANADA 4.15 , 7/01/2025 / RA (N/A) | 0.01 | 0.1288 | 0.1288 | ||||||
| VPBM_IXB_GOLDMAN / DE (N/A) | 0.00 | 0.0170 | 0.0170 |