Estatísticas Básicas
| Valor do Portfólio | $ 193,008,585 |
| Posições Atuais | 28 |
Últimas Participações, Desempenho, AUM (de 13F, 13D)
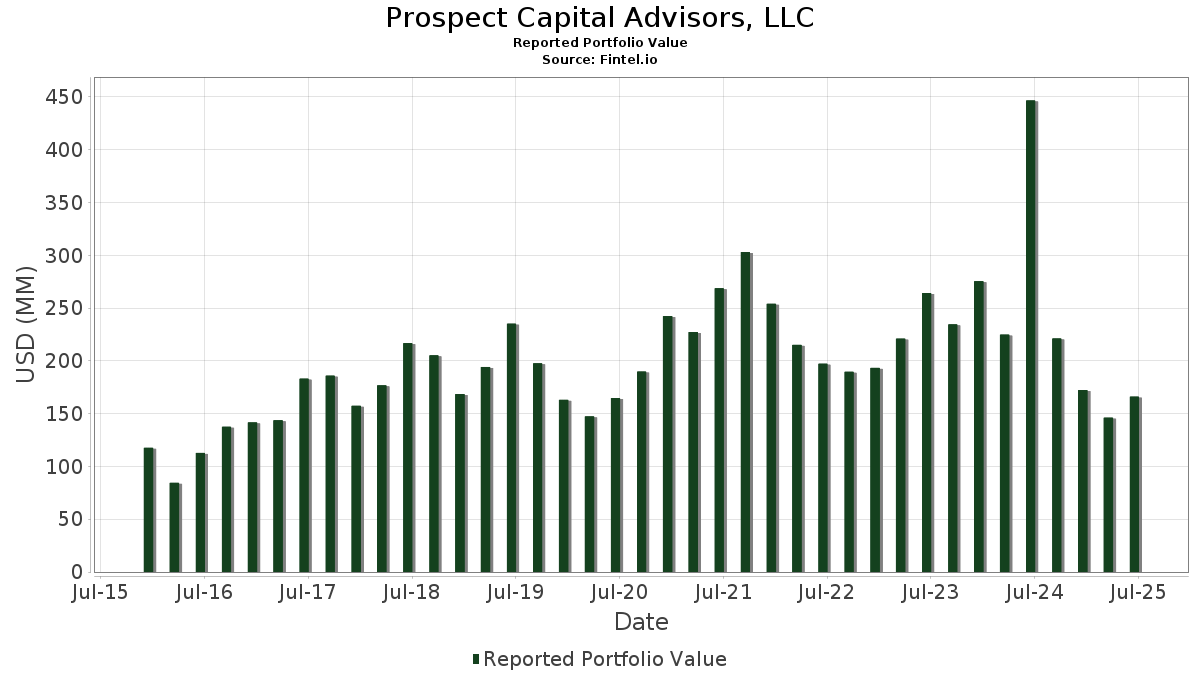
Prospect Capital Advisors, LLC divulgou 28 participações totais em seus últimos arquivamentos da SEC. O valor mais recente da carteira é calculado como $ 193,008,585 USD. O Ativo Total Sob Gestão (AUM) é esse valor mais o caixa (que não é divulgado). As principais posições de Prospect Capital Advisors, LLC são PJT Partners Inc. (US:PJT) , Grand Canyon Education, Inc. (US:LOPE) , OSI Systems, Inc. (US:OSIS) , Rush Street Interactive, Inc. (US:RSI) , and InterDigital, Inc. (US:IDCC) . As novas posições de Prospect Capital Advisors, LLC incluem ACI Worldwide, Inc. (US:ACIW) , Evolus, Inc. (US:EOLS) , .
Maiores Aumentos Este Trimestre
Usamos a mudança na alocação do portfólio porque esta é a métrica mais significativa. As mudanças podem ser devido a operações ou mudanças nos preços das ações.
| Ativo | Ações (MM) |
Valor (MM$) |
% do Portfólio | Δ% do Portfólio |
|---|---|---|---|---|
| 0.09 | 9.25 | 4.7942 | 3.2266 | |
| 0.07 | 3.84 | 1.9904 | 1.9904 | |
| 1.82 | 6.64 | 2.5408 | 1.7151 | |
| 0.04 | 8.30 | 4.3003 | 1.3611 | |
| 0.21 | 2.80 | 1.0691 | 1.0691 | |
| 0.21 | 1.28 | 0.6620 | 0.6620 | |
| 0.01 | 5.26 | 2.7252 | 0.1025 | |
| 0.03 | 10.23 | 5.3016 | 0.0410 |
Maiores Diminuições Este Trimestre
Usamos a mudança na alocação do portfólio porque esta é a métrica mais significativa. As mudanças podem ser devido a operações ou mudanças nos preços das ações.
| Ativo | Ações (MM) |
Valor (MM$) |
% do Portfólio | Δ% do Portfólio |
|---|---|---|---|---|
| 0.10 | 17.07 | 6.5273 | -3.0171 | |
| 0.05 | 13.08 | 5.0029 | -2.2411 | |
| 0.54 | 9.07 | 3.4697 | -2.1003 | |
| 0.01 | 0.40 | 0.1521 | -1.9236 | |
| 0.10 | 2.40 | 0.9166 | -1.8991 | |
| 0.09 | 8.38 | 4.3399 | -1.4714 | |
| 0.11 | 6.44 | 3.3360 | -1.3910 | |
| 0.13 | 7.49 | 3.8826 | -1.3729 | |
| 0.25 | 8.18 | 3.1288 | -1.0689 | |
| 0.03 | 6.05 | 3.1328 | -1.0527 |
Arquivamentos 13F e Fundo
Este formulário foi arquivado em 2025-11-14 para o período de relatório 2025-09-30. Clique no ícone de link para ver o histórico completo da transação.
Atualize para desbloquear dados premium e exportar para Excel ![]() .
.
| Ativo | Tipo | Preço Médio por Ação | Ações (MM) |
ΔAções (%) |
Valor ($MM) |
ΔAções (%) |
Portfólio (%) |
ΔPortfólio (%) |
|
|---|---|---|---|---|---|---|---|---|---|
| PJT / PJT Partners Inc. | 0.10 | 0.00 | 17.07 | 7.71 | 6.5273 | -3.0171 | |||
| LOPE / Grand Canyon Education, Inc. | 0.07 | -3.44 | 15.41 | 12.15 | 7.9843 | -0.2919 | |||
| OSIS / OSI Systems, Inc. | 0.05 | -1.87 | 13.08 | 8.77 | 5.0029 | -2.2411 | |||
| RSI / Rush Street Interactive, Inc. | 0.60 | 0.00 | 12.24 | 37.44 | 4.6823 | -0.6828 | |||
| IDCC / InterDigital, Inc. | 0.03 | -23.90 | 10.23 | 17.16 | 5.3016 | 0.0410 | |||
| ENVA / Enova International, Inc. | 0.08 | -1.75 | 9.69 | 1.39 | 5.0196 | -0.7357 | |||
| TPB / Turning Point Brands, Inc. | 0.09 | 172.49 | 9.25 | 255.61 | 4.7942 | 3.2266 | |||
| ARLO / Arlo Technologies, Inc. | 0.54 | -1.83 | 9.07 | -1.89 | 3.4697 | -2.1003 | |||
| SIMO / Silicon Motion Technology Corporation - Depositary Receipt (Common Stock) | 0.09 | -31.16 | 8.38 | -13.18 | 4.3399 | -1.4714 | |||
| DAVE / Dave Inc. | 0.04 | 129.02 | 8.30 | 70.10 | 4.3003 | 1.3611 | |||
| IMAX / IMAX Corporation | 0.25 | 0.22 | 8.18 | 17.38 | 3.1288 | -1.0689 | |||
| TTMI / TTM Technologies, Inc. | 0.13 | -39.13 | 7.49 | -14.12 | 3.8826 | -1.3729 | |||
| CMPO / CompoSecure, Inc. | 0.34 | -11.91 | 7.04 | 30.17 | 2.6933 | -0.5656 | |||
| BLND / Blend Labs, Inc. | 1.82 | 338.17 | 6.64 | 384.89 | 2.5408 | 1.7151 | |||
| BLBD / Blue Bird Corporation | 0.11 | -38.47 | 6.44 | -17.96 | 3.3360 | -1.3910 | |||
| AMT / American Tower Corporation | 0.03 | 0.00 | 6.05 | -12.98 | 3.1328 | -1.0527 | |||
| MSFT / Microsoft Corporation | 0.01 | 0.00 | 5.96 | 4.14 | 3.0874 | -0.3595 | |||
| WSO / Watsco, Inc. | 0.01 | 31.95 | 5.26 | 20.79 | 2.7252 | 0.1025 | |||
| POOL / Pool Corporation | 0.02 | 0.00 | 4.82 | 6.37 | 1.8452 | -0.8866 | |||
| UAMY / United States Antimony Corporation | 0.70 | -46.31 | 4.32 | 52.70 | 1.6536 | -0.0520 | |||
| ACIW / ACI Worldwide, Inc. | 0.07 | 3.84 | 1.9904 | 1.9904 | |||||
| FSS / Federal Signal Corporation | 0.03 | -3.21 | 3.59 | 8.20 | 1.3725 | -0.6249 | |||
| GDOT / Green Dot Corporation | 0.21 | 2.80 | 1.0691 | 1.0691 | |||||
| FIVN / Five9, Inc. | 0.10 | -43.90 | 2.40 | -48.74 | 0.9166 | -1.8991 | |||
| LSCC / Lattice Semiconductor Corporation | 0.03 | -33.18 | 2.29 | 0.04 | 0.8754 | -0.5032 | |||
| NXST / Nexstar Media Group, Inc. | 0.01 | 0.00 | 1.48 | 14.34 | 0.7684 | -0.0129 | |||
| EOLS / Evolus, Inc. | 0.21 | 1.28 | 0.6620 | 0.6620 | |||||
| SEZL / Sezzle Inc. | 0.01 | -73.99 | 0.40 | -88.48 | 0.1521 | -1.9236 | |||
| WSC / WillScot Holdings Corporation | 0.00 | -100.00 | 0.00 | 0.0000 |